Designing Interpretable Molecular Property
Predictors
by
Nithin Buduma
S.B. Computer Science and Engineering, Massachusetts Institute of
Technology (2019)
Submitted to the Department of Electrical Engineering and Computer
Science
in partial fulfillment of the requirements for the degree of
Master of Engineering in Electrical Engineering and Computer Science
at the
MASSACHUSETTS INSTITUTE OF TECHNOLOGY
May 2020
c
○ Massachusetts Institute of Technology 2020. All rights reserved.
Author . . . .
Department of Electrical Engineering and Computer Science
May 18, 2020
Certified by . . . .
Tommi S. Jaakkola
Professor of Electrical Engineering and Computer Science
Thesis Supervisor
Accepted by . . . .
Katrina LaCurts
Chair, Master of Engineering Thesis Committee
Designing Interpretable Molecular Property Predictors
by
Nithin Buduma
Submitted to the Department of Electrical Engineering and Computer Science on May 18, 2020, in partial fulfillment of the
requirements for the degree of
Master of Engineering in Electrical Engineering and Computer Science
Abstract
Complex neural models often suffer from a lack of interpretability, i.e., they lack methodology for justifying their predictions. For example, while there have been many performance improvements in molecular property prediction, these advances have come in the form of black box models. As deep learning and chemistry are becoming increasingly intertwined, it is imperative that we continue to investigate interpretability of associated models. We propose a method to augment property predictors with extractive rationalization, where the model selects a subset of the input, or rationale, that it believes to be most relevant for the property of interest. These rationales serve as the model’s explanations for its decisions. We show that our methodology can generate reasonable rationales while also maintaining predictive performance, and propose some future directions.
Thesis Supervisor: Tommi S. Jaakkola
Acknowledgments
I would like to thank my research advisor, Tommi, for all of his support throughout my M.Eng, even in the midst of this pandemic. Without his advice, this project would not have been possible.
Contents
1 Introduction 13
2 Related Work 17
3 Background 19
3.1 Recurrent Neural Architectures . . . 19
3.2 Policy Gradient Method . . . 21
4 Methods 23 4.1 Methods Background . . . 23
4.2 Masking . . . 24
4.3 Rationale Generator . . . 25
4.4 Rationale Predictor . . . 28
5 Experiments and Results 31 5.1 Datasets . . . 31
5.2 Masking Experiments . . . 32
5.3 Rationale Generation Experiments . . . 34
6 Conclusion 37 6.1 Discussion . . . 37
6.2 Future Work . . . 37
A Appendix 39 A.1 Background on Graphs . . . 39
A.2 Graph-based Methods . . . 42 A.3 Preliminary Results using Graphs . . . 45
List of Figures
3-1 GRU Cell Architecture, from [25] . . . 20
5-1 Test 1, Ground-truth . . . 35 5-2 Test 1, Predicted . . . 35 5-3 Test 2, Ground-truth . . . 35 5-4 Test 2, Predicted . . . 35 5-5 Test 3, Ground-truth . . . 35 5-6 Test 3, Predicted . . . 35
5-7 Ground-truth (left) vs Predicted (right) Rationales . . . 35
List of Tables
4.1 Training Approaches . . . 24
5.1 Random Mask Performance . . . 33
5.2 Best Architecture Performance . . . 34
Chapter 1
Introduction
The field of interpretability in complex neural models has much room for exploration. Before models such as neural nets came into popular use, we had models such as generalized linear models, famous examples of which are linear regression and logistic regression, random forest classification and regression, SVM/SVR, etc. The listed models trade off performance for interpretability - for example, we can clearly point to the learned weights in a logistic regression model as a measure of feature importance for decision making. However, such models have a high bias due to their constrained nature, and thus have limited capability for generalization. Bias refers to the classical bias-variance tradeoff, where high bias models tend to underfit to the training data due to strong prior assumptions built into the learning algorithm. High variance models, on the other hand, have a tendency to overfit to the training data due to their flexible nature, often modeling noise in the dataset too closely [11].
Neural networks trade off the interpretability of high bias models for performance. Due to the large number of parameters used in most neural nets today, the added nonlinearities and complex loss landscape [16], stochastic gradient descent as an op-timization algorithm (amongst other concerns) [26], it is near impossible to pinpoint an exact mechanism or reasoning by which a decision was made. However, the strong generalization capabilities of neural nets are well documented in academic literature [12]. Although neural nets have such capabilities, their use in fields where justifica-tion is key, such as in finance where vast amounts of civilian money are managed,
or in healthcare, where patient’s lives are on the line every day, is limited due to concerns regarding interpretability. The main goal of research in interpretability is to mitigate these concerns by lessening the polarity in tradeoff between performance and interpretabilty, and hopefully some day have completely interpretable models that perform at least as well as state-of-the-art models today.
One approach to interpretability is to generate explanations for black box models such as neural networks after the fact. One popular method for explaining individual predictions is Local Surrogate (LIME) [19, 31]. With LIME, we first select an input datapoint whose prediction is to be explained. Then, we sample random inputs within a defined neighborhood of the input datapoint, and generate predictions for these datapoints using our black box model. LIME fits a high bias, interpretable model such as linear regression to the generated predictions and initial prediction as a way to understand the influence small changes in features have locally. The main issue with LIME, however, is that it can return vastly different explanations with only small changes in parameters such as the kernel width for neigbhorhood definition. This requires significant fine-tuning for explanation of any individual example, which could be intractable depending on the number of examples one wants to explain [31]. To begin, one must define what interpretability means in their specific research context. There are two main views of interpretability: extractive and abstractive. In this paper, we are only concerned with extractive rationalization, which means that the rationale, or model justification, is simply a subset of the input. As is discussed further in Related Work, extractive rationalization has been applied successfully to problems in NLP such as sentiment prediction [15]. The model used was designed in a two-step process: the first step selects a subsequence from the text input, termed the rationale, and the second step uses solely the rationale to perform sentiment prediction. If optimized correctly, the generated rationale should contain relevant information from the input for sentiment prediction and can serve as an explanation. Note that these rationales were learned in a completely unsupervised manner, and thus, their model could simply replace a black box property predictor given strong enough performance and reasonable rationales.
In my work, I hope to emulate the success of the described approach in the chemi-cal domain. I use the SMILES string representation (discussed more in Related Work) of a molecule as input to the model, and the model-generated rationale is a subse-quence of the input SMILES string. In this approach, I use recurrent architectures for both the rationale generator, which selects a rationale from the input, and the rationale predictor, which performs property prediction using the model-generated rationale. For the datasets where ground truth rationales are known, we can compare the model-generated rationales with the ground truth rationales to gauge the efficacy of our method. Given that we can generate reasonable rationales on datasets of this nature, we then move to datasets where ground truth rationales are not known, and provide explanations for decisions that can be further tested in the lab, potentially refining existing processes.
In order for an extractive rationalization method to work, the model must be able to both generate reasonable rationales and learn to predict using partial information, since the rationale predictor only ever sees a subset of the input during prediction. Clearly the problem of generating reasonable rationales is difficult given its combina-torial nature. We propose a robust training methodology allowing the predictor to efficiently pick up on signal in the presence of noisy, or masked, inputs and learn in the partial information setting. Note that the predictor is learned without assuming any prior knowledge of the ground-truth rationale, so this training methodology can be extended to datasets where we don’t know the ground-truth. After showing reason-able success in this space, we move to the problem of rationale generation, where we train a network that can produce these high-performing subsequences using feedback from the predictor. We propose a few different methods for training such a generator and predictor in tandem to efficiently search for these rationales, which are further discussed in the Methods section.
Chapter 2
Related Work
Over the past few years, we have made strong gains in property prediction [23], molecular design [8, 9], and drug development [7]. Chemprop, which came out of MIT, is a famous example of our ability to do molecular property prediction [23]. Chemprop used message passing neural networks, or MPNNs, to create a learned representation for each molecule via bond message-passing, i.e. updating a feature vector for each bond in the molecule by summarizing information from its neighboring bonds and atoms, up to a specified depth. A feed-forward neural network was used for property prediction given the learned representation of the molecule. Other methods include those that use molecular fingerprints, such as Morgan fingerprints [14, 13], and those that operate directly on SMILES [32] strings, which are strings that can describe a molecular structure in its entirety (bonds, rings, etc.) and uniquely encode a single structure. However, a molecular structure need not have one unique SMILES string associated with it.
In this thesis, I augment the idea of molecular property prediction with rationale generation, giving us an opportunity to explore interpretability in such models. There are obvious challenges to this, such as the combinatorial nature of rationale gener-ation and if we can even do molecular property prediction effectively in the partial information setting. I investigated methods for both graph convolutional networks, which are related to MPNNs from above, and SMILES strings. One argument people may have against the importance of this research is the recent popularity of attention
mechanisms, a method for weighting parts of the input most important for prediction that is learned alongside other features during training [2]. However tailor-made this approach may seem to our application, the soft selection that attention employs is not readily interpretable in the chemical domain. For example, it is hard to give a chemical meaning to the statement that a fraction of an atom or bond is influential for predicting a certain property. The hard selection scheme that we propose, masking out atoms and bonds in a binary fashion, is much more well-suited.
There has also been recent work in selective rationalization specifically applied to natural language processing. [15] tackles the problem of selecting relevant portions of input text for rating prediction. Their model trains a rationale generator to mask in relevant portions of the text, and rationale predictor to predict the rating given selected portion. We can think of this binary mask 𝑠𝑖 for any token 𝑥𝑖 in the input
𝑥 as a latent variable describing its usefulness for predicting the property 𝑦. [24] extends the above method with complement control to prevent the generator and predictor from cooperatively devising a degenerate encoding scheme (e.g. location of punctuation) to convey information. These sorts of degenerate solutions, if sig-nificantly correlated with the label, would actually give "better" rationales than the desired function according to the loss formulation. Complement control restricts the information in the complement rationale, where the complement rationale is every-thing in the input that is excluded from the rationale. If the complement rationale has relevant information for predicting the associated label 𝑦, then the model tries to push this information into the rationale. In the appendix I talk about some of my work from first semester, where I tried augmenting graph-based rationale generation with adversarial complement control.
Chapter 3
Background
3.1
Recurrent Neural Architectures
Recurrent architectures were initially developed as a method for modeling sequential data [20]. Since their inception, they have been applied successfully in a variety of tasks across fields. Recurrent architectures led to major breakthroughs in language tasks such as machine translation [22], text to speech [17], and are applied to many instances of time series data. Recurrent architectures have even found success in modeling non-temporal data, examples including image generation tasks [5]. Recur-rent neural networks, or RNNs, are amongst the simplest of such models. We can formulate an RNN as follows:
ℎ0 = 𝑓 (𝑥0)
ℎ𝑖 = 𝑓 (𝑥𝑖, ℎ𝑖−1)
Where 𝑓 is a feedforward layer, or learned weight matrix, and defined activation function that acts on the input at all timesteps. To learn 𝑓 , we unroll the recursive procedure shown and perform backpropagation through this unrolled computational graph. However, famously, RNNs suffer from the problem of exploding and vanishing gradients, leading to either unstable training or little training at all [18]. This can be mitigated in many different ways. Examples include smarter weight initialization
[21] for 𝑓 , using different activation functions such as ReLU, and using more com-plex architectures such as Long Short Term Memory networks (LSTM) [6] and Gated Recurrent Units (GRU) [3]. LSTMs add in a more complex information control flow via gating, which allows them to model long-term dependencies much better than vanilla RNNs, and GRUs are a further variant upon LSTMs. Below is a diagram of information flow within an GRU:
Figure 3-1: GRU Cell Architecture, from [25]
The red circles with operations in the figure above all represent elementwise oper-ations. We can think of the output hidden state of a cell as a linear interpolation between the candidate hidden state, denoted as ˜ℎ𝑡, and the previous cell’s hidden
state ℎ𝑡−1, where the weighting factor is denoted as 𝑧𝑡. The weighting factor is a
function of both the current input 𝑥𝑡 and the previous hidden state ℎ𝑡−1. 𝑧𝑡 is also
termed the update gate. The candidate hidden state is a function of the previous cell’s hidden state ℎ𝑡−1, the current input 𝑥𝑡, and the reset gate 𝑟𝑡. The reset gate, which
is a function of the previous hidden state ℎ𝑡−1 and the current input 𝑥𝑡, decides how
much of the previous state to forget when calculating the ˜ℎ𝑡. GRUs were introduced
as an alternative to LSTMs, which have an extra gate and parameters. One main difference between LSTMs and GRUs is that the memory component of an LSTM is modulated by an output gate. This means that the following cell only operates on a filtered version of the memory, rather than the memory being fully exposed like in a
GRU [4]. However, both architectures tend to perform similarly in practice [4], so I test both in my work.
3.2
Policy Gradient Method
The policy gradient method, also termed the REINFORCE algorithm [33], originated in reinforcement learning and is a type of on-policy learning algorithm. In this setting, we can imagine an agent in some state at any timepoint 𝑡, which we call 𝑠𝑡. We
can think of 𝑠𝑡 as the environmental variables that influence an agent’s actions
-this environment could be a game in which the agent is a player, or could be a hospital emergency room in which the agent is a doctor making decisions. Once in 𝑠𝑡, the agent selects an action 𝑎𝑡 from a pre-defined set of actions allowable at that
state. Taking an action returns to the agent some reward, 𝑟𝑡(𝑠𝑡, 𝑎𝑡), and we hope
to maximize that reward, where higher rewards represent more favorable outcomes. This reward is shaped per the specifications of the problem - for example, in sepsis treatment, a favorable outcome could represent patient recovery, while a negative outcome would be patient death. The purpose of the policy gradient method is to learn a policy, or probability distribution of actions given state, which maximizes the expected reward. Here, we focus on a specific setting of reinforcement learning termed contextual bandits. At every iteration, the agent is presented with a new state randomly sampled from the distribution of states at that iteration. We also note that in this setting, the agent’s actions in any given state do not affect the distribution of future states. The agent is tasked with selecting the most favorable action, i.e. the action that returns the highest reward, in each state. Formally, we wish to learn the policy 𝑞𝜃*(𝑎|𝑠) maximizing the cumulative reward over 𝑇 iterations [1]:
𝐽 (𝜃) = 𝑇 ∑︁ 𝑡=1 E𝑠𝑡∼𝑝(𝑠𝑡)[E𝑎𝑡∼𝑞𝜃(𝑎𝑡|𝑠𝑡)[𝑟𝑡(𝑠𝑡, 𝑎𝑡)]] (3.1) 𝜃* = arg max 𝜃 𝐽 (𝜃) (3.2)
Where 𝜃 represents the weights of a neural net, for example, which parametrizes the policy. 𝐽 (𝜃) is the objective we are trying to maximize. The logical next step is to perform gradient ascent w.r.t 𝜃 in order to maximize 𝐽 (𝜃):
∇𝜃𝐽 (𝜃) = 𝑇 ∑︁ 𝑡=1 E𝑠𝑡∼𝑝(𝑠𝑡)[∇𝜃E𝑎𝑡∼𝑞𝜃(𝑎𝑡|𝑠𝑡)[𝑟𝑡(𝑠𝑡, 𝑎𝑡)]] (3.3) ≈ 𝑇 ∑︁ 𝑡=1 ∇𝜃E𝑎𝑡∼𝑞𝜃(𝑎𝑡|𝑠𝑡=𝑆𝑡)[𝑟𝑡(𝑠𝑡= 𝑆𝑡, 𝑎𝑡)] (3.4) = 𝑇 ∑︁ 𝑡=1 ∑︁ 𝐴𝑡 ∇𝜃𝑞𝜃(𝑎𝑡= 𝐴𝑡|𝑠𝑡 = 𝑆𝑡)𝑟𝑡(𝑠𝑡= 𝑆𝑡, 𝑎𝑡= 𝐴𝑡) (3.5) = 𝑇 ∑︁ 𝑡=1 ∑︁ 𝐴𝑡 𝑞𝜃(𝑎𝑡= 𝐴𝑡|𝑠𝑡 = 𝑆𝑡) ∇𝜃𝑞𝜃(𝑎𝑡= 𝐴𝑡|𝑠𝑡= 𝑆𝑡) 𝑞𝜃(𝑎𝑡= 𝐴𝑡|𝑠𝑡= 𝑆𝑡) 𝑟𝑡(𝑠𝑡= 𝑆𝑡, 𝑎𝑡= 𝐴𝑡) (3.6) = 𝑇 ∑︁ 𝑡=1 E𝑎𝑡∼𝑞𝜃(𝑎𝑡|𝑠𝑡=𝑆𝑡)[ ∇𝜃𝑞𝜃(𝑎𝑡|𝑠𝑡= 𝑆𝑡) 𝑞𝜃(𝑎𝑡|𝑠𝑡= 𝑆𝑡) 𝑟𝑡(𝑠𝑡 = 𝑆𝑡, 𝑎𝑡)] (3.7) ≈ 𝑇 ∑︁ 𝑡=1 ∇𝜃𝑞𝜃(𝑎𝑡= 𝐴𝑡|𝑠𝑡= 𝑆𝑡) 𝑞𝜃(𝑎𝑡= 𝐴𝑡|𝑠𝑡= 𝑆𝑡) 𝑟𝑡(𝑠𝑡= 𝑆𝑡, 𝑎𝑡= 𝐴𝑡) (3.8) = 𝑇 ∑︁ 𝑡=1 ∇𝜃log 𝑞𝜃(𝑎𝑡 = 𝐴𝑡|𝑠𝑡= 𝑆𝑡)𝑟𝑡(𝑠𝑡 = 𝑆𝑡, 𝑎𝑡= 𝐴𝑡) (3.9)
Where (10) to (11) comes from the identity ∇𝑥log 𝑓 (𝑥) = ∇𝑥𝑓 (𝑥)
𝑓 (𝑥) . We have achieved a
sampled approximation to ∇𝜃𝐽 (𝜃) in (11), which we can now use for stochastic
gradi-ent ascgradi-ent on 𝐽 (𝜃). The stochastic update in (11) is much more tractable compared to the gradient ascent update presented in (5), which requires a summation over states and actions at every iteration. Note that in the derivation above I use a single action sample for simplicity in the contextual bandit setting, but one can generally take the empirical average over multiple samples if desired.
Chapter 4
Methods
4.1
Methods Background
I would like to give some context on the different training methods, which will inform the remaining subsections within the Methods. I denote an input molecule’s SMILE representation as 𝑥, the property to be predicted as 𝑦, and the binary mask vector over all tokens 𝑥𝑖 in 𝑥 as 𝑠, where 𝑠𝑖 = 1 denotes 𝑥𝑖 is in the masked input and 𝑠𝑖 = 0
otherwise. We can thus interpret 𝑠 * 𝑥 as the masked input. Broadly, I tried three different methods to learning a rationale generator 𝑝(𝑠|𝑥) and a rationale predictor 𝑝(𝑦|𝑠 * 𝑥) (both parametrized by neural nets). The first was to pretrain a rationale predictor on both masked and complete data and learn the desired distribution 𝑝(𝑦|𝑠* 𝑥). Keeping this fixed, I trained a rationale generator to learn 𝑝(𝑠|𝑥). The second was to pretrain a rationale predictor on complete data, first learning the distribution 𝑝(𝑦|𝑥), and then co-evolving the generator and predictor until they achieved the desired distributions. The last was to do a full joint training of the generator and predictor. Below is a table summarizing these three approaches. Exact details on these will be covered in the following subsections.
Approach Approach Details
1 Pretrained (complete+masked) pred, fixed during gen training
2 Pretrained (complete) pred, joint training with gen
3 No pretraining, joint training of pred and gen
Table 4.1: Training Approaches
4.2
Masking
The purpose of this algorithm is to generate masked inputs for the training method involving pretraining the rationale predictor on masked and complete data. To mask, I choose one of four options uniformly at random: mask out prefix of SMILES string, mask out suffix of SMILES string, mask out both, or mask out substring within SMILES string. Masking out a substring involves replacing it with the character "*". With probability 𝜖, we recurse on the masked substring, and break the process if the masked string is below a threshold length. The masking process is done in this manner to ensure, with high probability, that the necessary signal for property prediction is preserved. The purpose of masking in this manner as opposed to masking character by character for the selected substring is to give the predictor as little information as possible regarding the length of the masked input. A character by character mask would enable the predictor to easily associate the masked input with its complete input. If the property predictor is flexible enough to classify inputs correctly when we know the ground-truth rationale, then we should be able to use this predictor to find the best rationale according to our loss formulation. Note that we provide no information regarding the ground-truth rationale. Thus, this masking process can be applied in real-world applications to datasets where we as the users have no information regarding the ground-truth rationales. Here are some examples of masked inputs from our synthetic toxicity dataset [29] (tuples with first index being original and second being the masked version):
∙ (’CCN(CCO)Cc1csc2ccccc12.Cl’, ’*CN(CCO)*sc2ccccc12.*’) ∙ (’FC(F)(F)c1ccc(Cl)c(-n2c(S)nnc2-c2ccco2)c1’, ’FC(F)(*)nn*’)
(-c3ccccc3)[nH]2)CC1’)
∙ (’CC(Oc1ccccc1)C(=O)Nc1ccc(S(=O)(=O)N2CCOCC2)cc1’, ’*(=O)Nc1ccc(S(*’) ∙ (’O=C(O)CN1C(=O)C(=Cc2cccc(OCc3ccc(Cl)cc3Cl)c2)SC1=S’, ’*O)CN*C1=S’)
4.3
Rationale Generator
The overall loss which we are optimizing our system with respect to must take a couple of considerations into account. The rationales we wish to generate are short and concise, while also summarizing all of the useful information within the molecule for property prediction. We also would like the model to favor contiguous rationales, since common functional groups, or substructures, within a molecule often strongly influence its properties, and these substructures tend to appear as substrings within a molecule’s SMILES string. We formally detail how the system loss takes these considerations into account below.
We have 𝑠, the mask chosen by the generator 𝑝(𝑠|𝑥), where 𝑠 ∈ {0, 1}𝑛 (𝑛 is the number of tokens in the input string 𝑥). During masking, any substring of 𝑥𝑖’s
for which all corresponding 𝑠𝑖’s are 0 is replaced with a single "*". The
regular-izer loss term is 𝑅(𝑠) = 𝑤𝑠 * ‖𝑠‖1 + 𝑤𝑐 * 𝑛−1
∑︀
𝑖=1
|𝑠𝑖+1− 𝑠𝑖|. The first term is the size
of the rationale, and the second is the number of transitions, as a higher number of transitions indicates many disconnected components. The predictor loss term is 𝐿𝑝(𝑠, 𝑥, 𝑦) = 𝐻(Ber(𝑦); 𝑝(𝑦|𝑠 * 𝑥)), the cross entropy between true distribution and
predicted distribution over the binary label. This measure quantifies how off the predicted distribution is as an approximation of the true distribution. We describe predictor training methods in the next section, but here, we only need to assume its existence. The overall loss of the system is 𝐿𝑔(𝑠, 𝑥, 𝑦) = 𝑅(𝑠) + 𝑤𝑝* 𝐿𝑝(𝑠, 𝑥, 𝑦), where
𝑤𝑠, 𝑤𝑐 and 𝑤𝑝 are hyperparameters to be optimized. We would like to minimize
E𝑠∼𝑝(𝑠|𝑥)[𝐿𝑔(𝑠, 𝑥, 𝑦)] w.r.t 𝜃𝑔, where 𝜃𝑔 represents the parameters of the generator. We
can’t minimize the expected cost without taking a sum over all possible rationales, which is computationally infeasible. However, we can approximate the gradient of
the expected cost using the policy gradient method described in the Background: ∇𝜃𝑔E𝑠∼𝑝(𝑠|𝑥,𝜃𝑔)[𝐿𝑔(𝑠, 𝑥, 𝑦)] = 1 𝐾 𝐾 ∑︁ 𝑘=1 ∇𝜃𝑔log 𝑝(𝑠 𝑘|𝑥, 𝜃 𝑔)𝐿𝑔(𝑠𝑘, 𝑥, 𝑦) (4.1)
The number of samples 𝐾 per example will be a hyperparameter during training. Beyond formulas, what is the meaning of this gradient estimate? Intuitively, the cost term 𝐿𝑔(𝑠𝑘, 𝑥, 𝑦) expresses the weight associated with the gradient update for
a particular 𝑠𝑘 given molecule 𝑥. Descending the gradient of the log probability for
some action 𝑎𝑖 given a state 𝑠𝑗 leads to an decrease in probability of 𝑎𝑖 occurring when
we are in state 𝑠𝑗. The higher the cost associated with taking action 𝑎𝑖 in state 𝑠𝑗, the
more we would like to weight this nudge in probability density. From this perspective of reinforcement learning, we can also think of the current state as the molecule 𝑥, and the action as choosing a mask 𝑠𝑘to keep only the useful information for property prediction. This is equivalent to the setting of contextual bandits presented in the Background since states, or molecules, are chosen at random for each iteration, independent of the mask, or action, chosen for any previous state.
Often times, in practice, we will actually subtract a baseline 𝐵(𝑥) from the the cost function for variance reduction, and instead optimize with
E𝑠∼𝑝(𝑠|𝑥,𝜃𝑔)[∇𝜃𝑔log 𝑝(𝑠|𝑥, 𝜃𝑔)(𝐿𝑔(𝑠, 𝑥, 𝑦) − 𝐵(𝑥))]. This is actually equal to the original
E𝑠∼𝑝(𝑠|𝑥,𝜃𝑔)[∇𝜃𝑔log 𝑝(𝑠|𝑥, 𝜃𝑔)(𝐿𝑔(𝑠, 𝑥, 𝑦))]:
E𝑠∼𝑝(𝑠|𝑥,𝜃𝑔)[∇𝜃𝑔log 𝑝(𝑠|𝑥, 𝜃𝑔)(𝐿𝑔(𝑠, 𝑥, 𝑦) − 𝐵(𝑥))] (4.2)
= E𝑠∼𝑝(𝑠|𝑥,𝜃𝑔)[∇𝜃𝑔log 𝑝(𝑠|𝑥, 𝜃𝑔)𝐿𝑔(𝑠, 𝑥, 𝑦)] − E𝑠∼𝑝(𝑠|𝑥,𝜃𝑔)[∇𝜃𝑔log 𝑝(𝑠|𝑥, 𝜃𝑔)𝐵(𝑥)] (4.3)
= E𝑠∼𝑝(𝑠|𝑥,𝜃𝑔)[∇𝜃𝑔log 𝑝(𝑠|𝑥, 𝜃𝑔)𝐿𝑔(𝑠, 𝑥, 𝑦)] − 𝐵(𝑥)E𝑠∼𝑝(𝑠|𝑥,𝜃𝑔)[∇𝜃𝑔log 𝑝(𝑠|𝑥, 𝜃𝑔)] (4.4)
= E𝑠∼𝑝(𝑠|𝑥,𝜃𝑔)[∇𝜃𝑔log 𝑝(𝑠|𝑥, 𝜃𝑔)𝐿𝑔(𝑠, 𝑥, 𝑦)] (4.5)
expec-tation, and (8) from E𝑠∼𝑝(𝑠|𝑥,𝜃𝑔)[∇𝜃𝑔log 𝑝(𝑠|𝑥, 𝜃𝑔)] = 0. We show (8): E𝑠∼𝑝(𝑠|𝑥,𝜃𝑔)[∇𝜃𝑔log 𝑝(𝑠|𝑥, 𝜃𝑔)] = E𝑠∼𝑝(𝑠|𝑥,𝜃𝑔)[ ∇𝜃𝑔𝑝(𝑠|𝑥, 𝜃𝑔) 𝑝(𝑠|𝑥, 𝜃𝑔) ] (4.6) =∑︁ 𝑠 𝑝(𝑠|𝑥, 𝜃𝑔) ∇𝜃𝑔𝑝(𝑠|𝑥, 𝜃𝑔) 𝑝(𝑠|𝑥, 𝜃𝑔) (4.7) =∑︁ 𝑠 ∇𝜃𝑔𝑝(𝑠|𝑥, 𝜃𝑔) (4.8) = ∇𝜃𝑔 ∑︁ 𝑠 𝑝(𝑠|𝑥, 𝜃𝑔) (4.9) = ∇𝜃𝑔1 = 0 (4.10)
And thus optimizing with subtracting a baseline is fine as it leaves us with an unbiased gradient estimate in expectation. When optimizing with a baseline, there are a couple of different options. I generally worked with a baseline of 𝐵(𝑥) = 12𝑤𝑟* size(𝑥), where
the baseline can also be intepreted as setting an advantage for sampled masks with a cost that falls under the baseline. Regardless, we have satisfied the main purpose as a method for variance reduction.
To model the generator 𝑝(𝑠|𝑥) parametrized by 𝜃𝑔, we use a bidirectional recurrent
architecture to predict a mask for each individual token, 𝑝(𝑠𝑖|𝑥). One assumption
we can make is 𝑠𝑖⊥𝑠∖{𝑠𝑖}|𝑥, ∀𝑖. The conditional distribution 𝑝(𝑠|𝑥) then factorizes
as
𝑛
∏︀
𝑖=1
𝑝(𝑠𝑖|𝑥). This is a reasonable assumption to make since all of the information
regarding whether an atom or bond in the molecule should be included in the rationale (𝑠𝑖 = 1) is contained within the structure of the molecule itself, i.e. the type of
the atom or bond and it’s neighbors. More specifically, the generator is composed of a bidirectional recurrent architecture followed by a fully connected layer and an independent sigmoid to predict 𝑠𝑖 for each token 𝑥𝑖. We can express the forward and
backward embeddings for any token in the input molecule, 𝑥𝑖 ∈ 𝑥, as ℎ→(𝑥𝑖) and
ℎ←(𝑥𝑖) respectively. The overall architecture can be represented as follows:
ℎ𝑖 = 𝑊𝑔ℎ([ℎ→(𝑥𝑖); ℎ←(𝑥𝑖)]) + 𝑏ℎ𝑔
Where 𝑊𝑔ℎ and 𝑏ℎ𝑔 are the learned weights and bias of the fully connected layer and 𝜎 is the sigmoid function, returning the probability that 𝑠𝑖 = 1. This architecture follows
the conditional independence assumption mentioned above since a prediction regard-ing 𝑝(𝑠𝑖|𝑥) is made independently of all other 𝑠𝑗’s and only depends on information
contained within 𝑥.
4.4
Rationale Predictor
As mentioned in the Methods Background, I tried three different methods for training the predictor. The first involved a full pretraining of the predictor on masked and complete data, the second involved pretraining on just complete data and co-evolving the generator and predictor jointly, and the third was a full joint training of the generator and predictor absent any pretraining (Table 4.1). I will first describe the first and third approaches, as the the second training method can be seen as a combination of these two approaches.
In the first approach, the rationale predictor 𝑝(𝑦|𝑠 * 𝑥) is optimized to learn using complete data and masked data. I give the masking methodology for pretraining and example masks for each dataset in the Experimentation section. The loss we are trying to minimize is 𝐿𝑝(𝑠, 𝑥, 𝑦) = 𝐻(Ber(𝑦), 𝑝(𝑦|𝑠 * 𝑥)). During training of the generator,
this predictor remains fixed. All recurrent architectures were followed by a fully connected layer and sigmoid for prediction. Formally, we have 𝑥 as our input (which we will assume is 𝑠 * 𝑥orig in the masked input case), which consists of 𝑛 tokens 𝑥𝑖, 𝑖 =
1, ..., 𝑛. Since our architectures here are also bidirectional recurrent, we can use the same terminology from the previous section. After the model runs to completion for a given 𝑥, we are left with a hidden state ℎ→(𝑥𝑛) in the forwards direction and ℎ←(𝑥1)
in the backwards direction. We concatenate these two embeddings, and run this concatenation through a fully connected layer and sigmoid to output a distribution
over the binary label:
ℎ = 𝑊𝑝ℎ([ℎ→(𝑥𝑛); ℎ←(𝑥1)]) + 𝑏ℎ𝑝
𝑝(𝑦𝑖 = 1|𝑥) = 𝜎(ℎ)
In the third approach, we have the exact same architecture as above. To train the rationale predictor, recall the overall system loss from the Rationale Generator section, 𝐿𝑔(𝑠, 𝑥, 𝑦). Here, we would like to minimize E𝑠∼𝑝(𝑠|𝑥)[𝐿𝑔(𝑠, 𝑥, 𝑦)] w.r.t. 𝜃𝑝, the
parameters of the predictor. In the case of the predictor, this is similar to stochastic gradient descent in standard neural net training:
∇𝜃𝑝E𝑠∼𝑝(𝑠|𝑥,𝜃𝑔)[𝐿𝑔(𝑠, 𝑥, 𝑦)] = ∇𝜃𝑝 ∑︁ 𝑠 𝑝(𝑠|𝑥, 𝜃𝑔)𝐿𝑔(𝑠, 𝑥, 𝑦) (4.11) =∑︁ 𝑠 𝑝(𝑠|𝑥, 𝜃𝑔)∇𝜃𝑝𝐿𝑔(𝑠, 𝑥, 𝑦) (4.12) = E𝑠∼𝑝(𝑠|𝑥,𝜃𝑔)[∇𝜃𝑝𝐿𝑔(𝑠, 𝑥, 𝑦)] (4.13)
Thus we can get an empirical estimate of the desired gradient via a few samples 𝑠 from the generator. Since this is a joint training method, these samples from the generator are used to update both the generator and predictor.
The second approach resembles a combination of the first and third. We start by pretraining a property predictor with just complete data, parametrizing 𝑝(𝑦|𝑥). We do this by normal means of supervised learning, minimizing 𝐻(Ber(𝑦), 𝑝(𝑦|𝑥)). During joint training, we co-evolve the generator and predictor; the predictor is fine-tuned with masked inputs from the generator. By keeping the regularizer loss small at first, we sample minimally masked inputs, which is a self-consistent solution given our property predictor has been pretrained on only complete inputs. We increase the regularizer loss incrementally, making the sampled rationales increasingly more concise, while carefully monitoring the validation performance of the predictor to ensure stable training and that our predictor is behaving as expected. We follow the methodology from the third approach here, updating our predictor via a sampled
approximation of the desired gradient. Again, our goal is to eventually have the rationale predictor parametrize the distribution 𝑝(𝑦|𝑠 * 𝑥).
Chapter 5
Experiments and Results
5.1
Datasets
I mainly work with two datasets, one where the ground truth rationales are known and one where we would like to use the developed methodology to discover potential rationales within the data:
∙ Synthetic dataset [29]: A dataset of 100k randomly selected molecules from ChEMBL, where a molecule is labeled as toxic if it contains any one of the structural alerts found in Sushko et. al. 2012. These structural alerts are asso-ciated with human and/or environmental hazards. This dataset is key for our experimentation since we know the ground-truth rationales a priori, and thus can verify the effectiveness of our approach by comparing the model-generated rationales against the ground truth. This dataset is imbalanced, the minority being toxic with a ratio of approximately 15:85.
∙ SARS-CoV-1 dataset [28]: This dataset consists of a training dataset of 290k molecules, of which 405 molecules have shown significant inhibition of the SARS-CoV 3CL protease. The test set consists of 6k molecules, of which 41 are experimentally validated hits. Clearly this dataset is severely imbalanced, much more so than our synthetic dataset. This dataset is more experimental, as we have no access to a set of ground-truth rationales. Thus we would like to use our
framework to propose potential rationales, or specific molecular substructures, as important for enzyme inhibition. This is an important, real-world task as it could help further refine the antiviral development process for coronaviruses.
5.2
Masking Experiments
The experiment I tried involved generating randomly masked data for each example 𝑥, and training a recurrent architecture to predict the original label 𝑦 for complete inputs 𝑥 and masked inputs 𝑠𝑟* 𝑥, where 𝑠𝑟 denotes a random mask. The masks were
generated using the masking methodology as described in the Methods. This stage served as both a sanity check when training on our synthetic data where we knew the desired rationale a priori and a method to pretrain the rationale predictor 𝑝(𝑦|𝑠 * 𝑥) (detailed in the first of three approaches described in the Methods). This was a sanity check because we could probe the rationale predictor with random masks 𝑠𝑟 to ensure
𝐻(Ber(𝑦), 𝑝(𝑦|𝑠𝑟* 𝑥)) was minimized when 𝑠𝑟 contained the desired rationale, and
thus know it would at least be possible for a rationale generator trained either jointly or with predictor fixed to produce said rationale. I found that, after pretraining the rationale predictor in the above manner, the model achieved good test performance on complete data and the rationales 𝑠 that minimized 𝐻(Ber(𝑦), 𝑝(𝑦|𝑠 * 𝑥)) did contain the desired rationale. To obtain the results presented below in Tables 5.1 and 5.2, I assembled training batches where each batch consisted of half complete molecules associated with their labels and half masked molecules associated with their original labels. The purpose of this was to allow the predictor to both learn to predict using partial information as well as extract useful signal from the complete molecules. Here is a list of architectures and hyperparameter settings I tested:
Hyperparameters:
∙ Learning Rates: 1e-3, 1e-2
∙ Optimizers: SGD, SGD with momentum, Adam ∙ Hidden layer size: 10, 20, 50, 100
∙ Nonlinearities: tanh, relu
∙ Oversampling positives: 0-10 extra copies of each positive sample (synthetic); 20, 40, 80 extra copies (SARS-CoV-1)
∙ Downsampling negatives: 0, 0.75, 0.875, 0.95 (fraction of negative samples re-moved from SARS-CoV-1)
∙ Weight initialization: Default, Standard Normal, Xavier Normal (for linear lay-ers), Orthogonal (for recurrent layers)
Architectures: ∙ RNN
∙ LSTM (+bidirectional)
∙ GRU (+bidirectional,+multilayer)
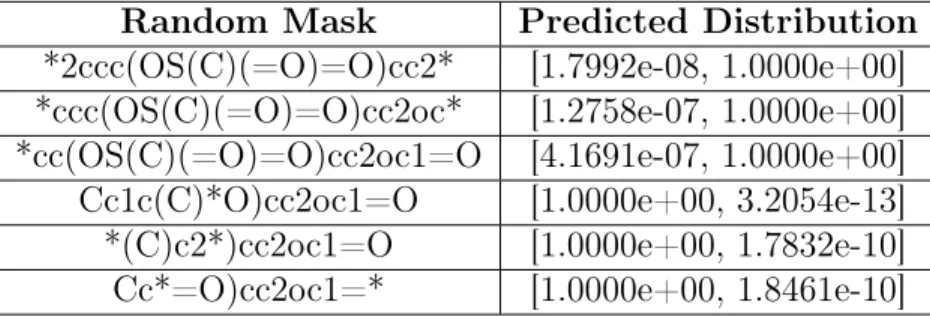
Below is an example of random mask performance, where the original molecule is "Cc1c(C)c2ccc(OS(C)(=O)=O)cc2oc1=O" and the ground-truth rationale is "[#6]S(=O)(=O)O" ("[#6]" represents any carbon):
Random Mask Predicted Distribution
*2ccc(OS(C)(=O)=O)cc2* [1.7992e-08, 1.0000e+00] *ccc(OS(C)(=O)=O)cc2oc* [1.2758e-07, 1.0000e+00] *cc(OS(C)(=O)=O)cc2oc1=O [4.1691e-07, 1.0000e+00]
Cc1c(C)*O)cc2oc1=O [1.0000e+00, 3.2054e-13]
*(C)c2*)cc2oc1=O [1.0000e+00, 1.7832e-10]
Cc*=O)cc2oc1=* [1.0000e+00, 1.8461e-10]
Table 5.1: Random Mask Performance
Each of the six entries in Table 5.1 represents a random mask applied to the original molecule from the synthetic toxic dataset, and the list corresponding to each represents a probability distribution over toxicity, where index 0 represents not toxic and index 1 represents toxic. As can be seen, the first three masked molecules contain the ground-truth rationale (sulphate group), and are predicted to be toxic with a
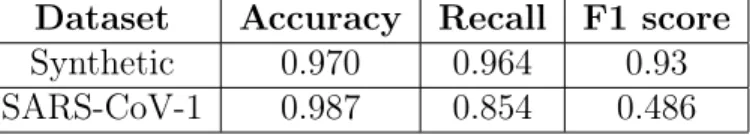
probability close to 1, which is what we would expect from a viable predictor. The last three masked molecules do not contain the ground-truth rationale or contain only a small, non-predictive portion of the ground-truth, and are predicted to be toxic with a probability close to 0, also what we would expect. Below is a table of the best architecture’s test performance on our datasets:
Dataset Accuracy Recall F1 score
Synthetic 0.970 0.964 0.93
SARS-CoV-1 0.987 0.854 0.486
Table 5.2: Best Architecture Performance
We report F1 score in Table 5.2 due to the strong imbalance in both datasets, where the positive class is the minority class. Note the above results are from testing the architectures solely on complete data. We note that the F1 score for the best architecture on the SARS-CoV-1 dataset even when training a classical property predictor was approximately 0.507, and we’d expect the model trained in the masked setting to do no better than this. The reason for this is likely due to both the dearth of positive data in our training set as well as many common substructures between the positive and negative data, making it difficult for the property predictor to find unique substructures amongst the positive data. Strong substructure similarities between the positive and negative data are probably due to a pre-screening process prior to the actual assay, identifying the 290k compounds as potential candidates based on pertinent characteristics.
5.3
Rationale Generation Experiments
Of the three approaches I tried for training a rationale generator and predictor in tandem, I found that I was able to generate reasonable rationales when I performed a full joint training of the generator and predictor. As stated in the Methods, the generator returns 𝑝(𝑠|𝑥), which is factored into ∏︀
𝑖
𝑝(𝑠𝑖|𝑥). Below, I have drawn the
syn-thetic dataset, where the maximum likelihood mask for a molecule is {𝑠max𝑖 : 𝑠max 𝑖 =
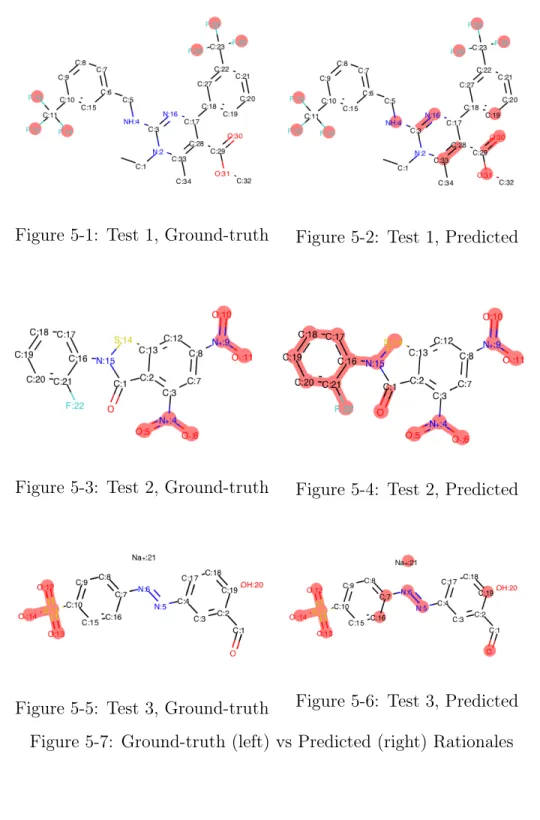
arg max𝑠𝑖𝑝(𝑠𝑖|𝑥), ∀𝑖}:
Figure 5-1: Test 1, Ground-truth Figure 5-2: Test 1, Predicted
Figure 5-3: Test 2, Ground-truth Figure 5-4: Test 2, Predicted
Figure 5-5: Test 3, Ground-truth Figure 5-6: Test 3, Predicted Figure 5-7: Ground-truth (left) vs Predicted (right) Rationales
As we can see from comparing the predicted and ground-truth rationales, the model-generated rationales tend to be a superset of the ground-truth rationale, sat-isfying the constraint that the model-generated rationales summarize all useful infor-mation for property prediction. In addition, other than Test 2, the model-generated rationales are around half or less than half the size of the original molecule, which is desired. However, there is clear room for improvement, which we detail in more depth in the Conclusion. We were unable to generate reasonable rationales for the SARS-CoV-1 dataset. Given the subpar performance metrics of even a classical prop-erty predictor on the SARS-CoV-1 dataset, it would be quite a bit more difficult for a interpretable model to learn useful signal in the presence of masked data. We will likely need a much larger sample of positive data to do this.
Now, we can evaluate the overall system performance compared to a property predictor trained on complete data from the synthetic dataset. Currently, to do property prediction, we would simply use the latter. However, as mentioned in the Introduction, the purpose of our study is to make progress towards replacing the current state of property prediction with a more interpretable framework. To eval-uate overall system performance, we take a complete test molecule 𝑥, generate the maximum likelihood masked version 𝑠max* 𝑥 via the rationale generator, and pass
𝑠max * 𝑥 through the rationale predictor for property prediction. Below is a table
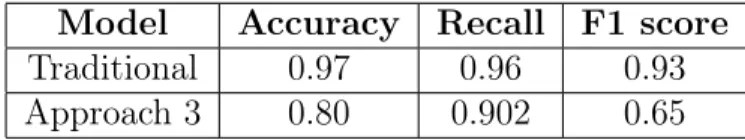
of the results comparing performance metrics of our approach with the traditional approach on the synthetic dataset:
Model Accuracy Recall F1 score
Traditional 0.97 0.96 0.93
Approach 3 0.80 0.902 0.65
Table 5.3: Property Predictor Performance on synthetic dataset
We note that although we do take a hit in the F1 score on the positive class as we’d expect, we are still able to generate quite reasonable results both in terms of rational generation and property prediction.
Chapter 6
Conclusion
6.1
Discussion
Complex neural models suffer from a lack of interpretability, halting their widespread adoption in numerous fields. Simpler models are often more interpretable, but trade off performance for increased interpretability. We propose a method for building interpretable neural models, specifically in the chemical domain. Research out of MIT and other institutions has developed molecular property predictors such as Chemprop [23] with well-documented success. However, interpetability within such models is an issue that has yet to be solved. Our proposed model is a two-step, extractive rationalization approach to property prediction. We found that our approach was able to achieve reasonable success both in rationale generation and property prediction. We also show that we can learn a property predictor to pick up on relevant signal even in the presence of masked data, without too great of a hit in performance. As deep learning and chemistry become increasingly intertwined, it is imperative that we continue to push for interpretability in highly performant neural models.
6.2
Future Work
There are still improvements we can make on the work presented in this thesis. One is to include a dictionary of substructures as part of the vocabulary rather than working
solely at the atom and bond level. This is because substructures and functional groups are often key building blocks for molecular properties such as solubility and toxicity. Of course, for experimental datasets such as SARS-CoV-1 where we are trying to propose rationales, we cannot necessarily guarantee that this will be the case, but it is a good first step towards more accurately modeling the higher order structure in molecules. In addition, we could incorporate an adversarial predictor using complement rationales [24] as presented in the Related Work to increase the quality of rationales produced by the generator. Of course, there is also always the question of whether extractive rationalization is even the best approach to take in this problem as opposed to techniques such as abstractive rationalization, which is a question for future research much further down the line.
Appendix A
Appendix
A.1
Background on Graphs
Although molecules can be effectively represented as SMILES strings, they are most naturally represented as graphs. Graphs can be represented as a tuple (𝑉, 𝐸), where V represents the graph’s set of nodes and E represents the graph’s set of edges. We can think of each atom as a node in the graph and a bond between atoms as an edge between nodes. Researchers in fields ranging from computer vision to statistical inference have developed slightly different, yet fundamentally related, ways to work with data with a graphical structure.
The idea of message passing was first presented as a method for conducting belief propagation (BP) in graphical models, where each node in the graph represents a random variable and edges represent independence structure. The idea was that we could learn marginal distributions of the individual nodes given we had this graphical model structure, which represents a factorization of the joint distribution over all nodes (Hammersley-Clifford). Messages from one node to another can be interpreted as the "influence" that the first has on the second. In the case of tree structures, we can learn these marginal distributions exactly using the sum-product algorithm, which is just a distributed version of the general BP algorithm. Sum-product is termed loopy BP when applied to graphs with cycles, the more relevant application in our context. Even though loopy BP is inexact due to the existence of cycles, is has
been shown to work quite well generally.
Figure A-1: Sum-product algorithm, from [27]
Applying this algorithm to graph structures in other contexts, such as in represen-tation learning, obviously does not have the same clean interprerepresen-tation as generating marginals does. However, they still share a lot of similarities on how to measure the influence that nodes have on each other within certain neighborhoods. Neural networks that implement a form of loopy BP to do representation learning are gen-erally termed message passing neural networks, or MPNNs and can be a thought of as neighborhood aggregation. Chemprop, as described in the Related Work from the main body, is an example of this.
Graph convolutional networks, or GCNs, have recently become popular in the machine learning community as a tool to conduct representation learning and can be considered a subclass of the general MPNN framework described above. The overall idea of a GCN is to try to learn a feature representation for every node in the input graph, where the input graph is of the same form, (𝑉, 𝐸). A GCN can be described as some nonlinear function of the input graph matrix representation and the current represenation of each node: 𝐻𝑙+1 = 𝑓 (𝐻𝑙, 𝐴) [30]. 𝐴 represents the adjacency matrix (or function thereof) of the input graph and 𝐻𝑙 represents the features of each node at
timestep 𝑙. 𝐻0 = 𝑋 is the original feature representation of each node, and 𝐻𝐿, the feature representation after the last step 𝐿, is the learned representation returned to the user. As the cited work points out, the only difference between all GCN methods is how 𝑓 is defined [30].
A.2
Graph-based Methods
Since molecules owe the existence of much of their properties to interactions between neighboring atoms and their structure, the model must have a way of incorporating this information into rationale generation and property prediction. Message passing, as described in the background, is one such technique to do this. Specifically, we implement each message passing layer to use a form of neighborhood aggregation that updates each node feature vector, which corresponds to a single atom’s features, via a function of the feature vectors of the bonds attached to it and its neighboring atoms’ feature vectors. The function used looks like the following:
𝑥𝑡𝑖 = (𝜃𝑖𝑡𝑥𝑡−1𝑖 + Σ𝑗∈𝑁 (𝑖)𝑥𝑡−1𝑗 * 𝜃 𝑡 𝑖,𝑗𝑒𝑖,𝑗)+
Where the 𝜃’s are learned affine functions of the node feature vectors indicated by 𝑥𝑖
and the edge feature vectors indicated by 𝑒𝑖,𝑗. The superscripts 𝑡 and 𝑡 − 1 refer to
their respective layers within each network. Finally, the (𝑥)+ refers to the nonlinear
ReLU activation applied at each layer.
There are three networks in the proposed framework: the rationale generator, the rationale predictor, and the complement rationale predictor. The rationale generator takes the input molecule and returns a mask over each atom in the input, which de-termines what it thinks the relevant portion of the molecule for predicting a property like toxicity is (the rationale). The rationale is then fed into the rationale predictor, which uses the rationale to make a decision as to whether the fed-in structure is toxic or not. The part of the molecule that wasn’t selected by the mask, or the complement rationale, is fed into the complement rationale predictor, which also tries to make a decision as to whether the fed-in structure is toxic or not. Both predictors are trained against the label of the original input molecule. If the generator has selected the best possible rationale, all of the relevant information regarding the prediction of toxicity should be contained within the rationale, and the complement rationale predictor should perform quite poorly compared to the rationale predictor. One can think of the complement rationale predictor as a sort of adversary, pushing the generator to
produce better and better rationales.
The generator and predictor networks differ in a couple of ways. For one, the input to the generator is the embedding representation of the original molecule itself, while the input to each of the predictor networks is a function of these embedding representations. To fully determine this function, the generator applies a sigmoid op-erator to each final atom embedding 𝑥𝑇𝑖 (where 𝑇 represents the final message-passing layer), which determines a mask weight 𝑚𝑖 in the range of zero to one for each atom
and the bonds attached to it. The rationale predictor input is an elementwise product of the mask weights 𝑚𝑖 with the input molecular features 𝑥0𝑖 and 𝑒𝑖,𝑗. This input is
termed the rationale. On the other hand, the complement rationale predictor input is an elementwise product of the mask weights 1 − 𝑚𝑖 with the input molecular features
𝑥0𝑖 and 𝑒𝑖,𝑗, which is termed the complement rationale. Intuitively, the mask weight
for each atom and its respective bonds indicate their usefulness for predicting the desired property. If the rationale indeed summarizes all of the useful information for property prediction, then it makes sense that the complement rationale should have none of the information important for property prediction. The rationale predictor and the complement rationale predictor both have the same internal structure - both have message passing layers and ReLU activations, and a final layer that returns a probability of the property for the original molecule via the sigmoid.
To train the above networks, we first need to construct an appropriate loss. The loss for each predictor network is simple - it is the cross entropy between the predicted probability distribution 𝑞 and the actual probability distribution 𝑝, 𝐻(𝑝, 𝑞), where 𝑝 has all of its mass on the true label. The cross entropy between two distributions can be interpreted as the divergence between two distributions, or the "error" generated by using 𝑞 to approximate 𝑝. It is not technically a distance due to asymmetry. Each predictor is trained to do as well as it possibly can on the input given, as a strong adversary forces the generator to produce better and better rationales. On the generator side, the loss is constructed as follows:
Each 𝜆 is a hyperparameter to be tuned. ˆ𝑠 refers to the average weight assigned to each atom in an input molecule from the generated rationale, and 𝑠 refers to a target selection rate set a priori. The purpose of this portion of the loss is to penalize large weights for all the atoms, because an obvious degenerate solution would be to assign a weight of one to each atom and the rationale would be the entire molecule. 𝐻(𝑝, 𝑞𝑟) and 𝐻(𝑝, 𝑞𝑐) refer to the same losses from the predictors, where 𝑟 stands for
rationale and 𝑐 stands for complement rationale. The reason for taking the difference between these two terms is that we’d like 𝐻(𝑝, 𝑞𝑐) to be much larger than 𝐻(𝑝, 𝑞𝑐),
indicating the rationale has significantly more information regarding the prediction than the complement rationale. During validation and testing, we compute a hard mask instead of a soft mask for the rationale. The hard mask allows us to clearly determine a rationale, since we are selecting atoms to be in the rationale with a weight of one and atoms to be in the complement rationale with a weight of zero. We use a soft mask during training because casting to a hard mask is not differentiable, and conducting ordinary backpropagation would be unstable.
A.3
Preliminary Results using Graphs
So far, I have been working with the mutagenicity dataset, which contains relatively small molecules and a label for whether or not the molecule is toxic. Here is an example of a molecule from the dataset, where the boxed portion is the labeled rationale from the rationale generator:
The above molecule is a toxic one according to the dataset, and the rationale generator was able to pick up the nitro groups, which were found in [10] to be a significant contributor to the toxicity of molecules in general. Although this is just one visual example, qualitatively assessing the produced rationales showed that the generator was able to consistently pick up on this group as well as amines and halides (significant contributors to toxicty). These preliminary results look solid on the surface, but there are still significant concerns. For example, the actual substructures found were contributors to toxicity were not just the listed functional groups alone, but actually the functional groups bonded to an aromatic group or an aliphatic chain. For example, even though the rationale from above was able to correctly determine the nitro groups as the primary cause of toxicity, it was not able to pick up on the aromatic ring they are bonded to, which is a more accurate description of the correct toxicophore (aromatic nitro). In addition, the rationale generator is often not able to pick up on multiple types of functional groups that contribute to toxicity. For example:
toxicity, but not the polycyclic aromatic system (another key contributor to toxicity) which makes up the rest of the molecule. The listed concerns may be a consequence of the target selection rate and the resultant loss function formulation for the rationale generator, which would heavily penalize the selection of the entire molecule (in the visualized case), or large portions of the molecule in general. This can potentially be mitigated via a re-formulation of the loss without the target selection rate. Finally, an issue that may require more in-depth feature design or model design re-considerations was that, in addition to picking up nitro groups for toxicity, the rationale generator also picked up carboxyl groups, which look almost exactly like nitro groups except for a carbon instead of a nitrogen. The carboxyl group is not a contributor to toxicity, and is actually a key ingredient in many of the key biological molecules for cell function. The current hypothesis for this phenomenon is that the model is solely picking up structural information, such as a functional group off of an aromatic ring, as a useful predictor for toxicity rather than learning properties of atoms.
Bibliography
[1] Barto and Sutton. Reinforcement Learning: An Introduction. The MIT Press, second edition, 2018.
[2] Bahdanau et. al. Neural machine translation by jointly learning to align and translate. ICLR, 2015.
[3] Cho et. al. Learning phrase representations using rnn encoder–decoder for sta-tistical machine translation. EMNLP, 2014.
[4] Chung et. al. Empirical evaluation of gated recurrent neural networks on sequence modeling. arXiv, 2014.
[5] Gregor et. al. Draw: A recurrent neural network for image generation. ICML, 2015.
[6] Hochreiter et. al. Long short-term memory. Neural Computation, 1997.
[7] Horwood et. al. Molecular design in synthetically accessible chemical space via deep reinforcement learning. arXiv, 2020.
[8] Jin et. al. Junction tree variational autoencoder for molecular graph generation. ICML, 2018.
[9] Jin et. al. Hierarchical generation of molecular graphs using structural motifs. arXiv, 2020.
[10] Kazius et. al. Derivation and validation of toxicophores for mutagenicity predic-tion. Journal of Medicinal Chemistry, 2005.
[11] Kohavi et. al. Bias plus variance decomposition for zero-one loss functions. ICML, 1996.
[12] LeCun et. al. Deep learning. Nature, 2015.
[13] Lee et. al. Predicting protein–ligand affinity with a random matrix framework. PNAS, 2016.
[14] Lee et. al. Ligand biological activity predicted by cleaning positive and negative chemical correlations. PNAS, 2019.
[15] Lei et. al. Rationalizing neural predictions. EMNLP, 2016.
[16] Li et. al. Visualizing the loss landscape of neural nets. NeurIPS, 2018. [17] Oord et. al. Wavenet: A generative model for raw audio. arXiv, 2016.
[18] Pascanu et. al. On the difficulty of training recurrent neural networks. ICML, 2013.
[19] Ribeiro et. al. “why should i trust you?” explaining the predictions of any clas-sifier. KDD, 2016.
[20] Rumelhart et. al. Sequential thought processes in pdp models. PDP, 1986. [21] Saxe et. al. Exact solutions to the nonlinear dynamics of learning in deep linear
neural networks. ICLR, 2014.
[22] Wu et. al. Google’s neural machine translation system: Bridging the gap between human and machine translation. ACL, 2016.
[23] Yang et. al. Analyzing learned molecular representations for property prediction. Journal of Chemical Information and Modeling, 2019.
[24] Yu et. al. Rethinking cooperative rationalization: Introspective extraction and complement control. EMNLP, 2019.
[25] Victor Garcia. Rnn, talking about gated recurrent unit. DLBT, 2019.
[26] Eugene Golikov. An essay on optimization mystery of deep learning. arXiv, 2019.
[27] Jonathan Hui. Machine learning — graphical model exact inference (variable elimination, belief propagation, junction tree). Medium, 2019.
[28] J-Clinic. Sars-cov-1 dataset. AICures, MIT, 2020.
[29] Wengong Jin. Synthetic toxiciy dataset. Private Communication, 2019. [30] Thomas Kipf. Graph convolutional networks. GitHub, 2016.
[31] Christoph Molnar. Interpretable Machine Learning: A Guide for Making Black Box Models Explainable. GitHub, 2020.
[32] D. Weininger. Smiles, a chemical language and information system. J. Chem. Inf. Model, 1988.
[33] Ronald Williams. Simple statistical gradient-following algorithms for connec-tionist reinforcement learning.
![Figure 3-1: GRU Cell Architecture, from [25]](https://thumb-eu.123doks.com/thumbv2/123doknet/14723280.571029/20.918.255.664.323.641/figure-gru-cell-architecture-from.webp)
![Figure A-1: Sum-product algorithm, from [27]](https://thumb-eu.123doks.com/thumbv2/123doknet/14723280.571029/40.918.213.699.177.329/figure-a-sum-product-algorithm-from.webp)