Analgesic effect in humans of subanaesthetic isoflurane concentrations evaluated by evoked potentials
5
0
0
Texte intégral
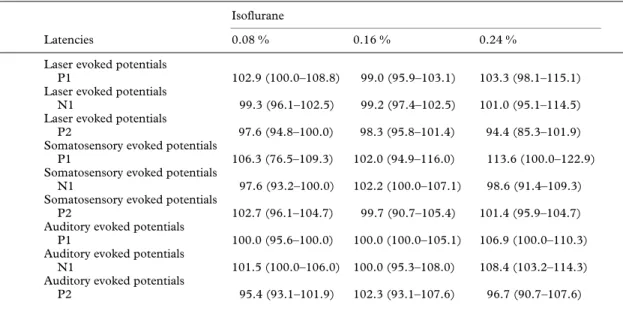
(2) Isoflurane and evoked potentials. 39. recording of the laser evoked potentials (LEP), 16 laser stimuli with an intensity of 1.5 times the initial pain threshold and with a random inter-stimulus interval between 10 and 20 s were applied. After the last stimulation, the volunteer was asked to rate the perceived pain intensity on a visual analogue scale (VAS).. ELECTRICAL STIMULATION. An intracutaneous finger electrode applied to the pulp of the third finger was used [12]. A 25-ms single stimulus (in reality train of five, 1-ms, square-wave impulses, but these are perceived as a single stimulus) was delivered from a Digitimer DS 7 (Digitimer Ltd, Hertfordshire, England) constant current stimulator triggered by a Philips Generator PM 5150 (Philips GmbH, Hamburg, Germany). The current was increased from 0 in steps of 0.2 mA until the volunteer rated the perceived pain intensity of the stimulation on the VAS equally with that of laser stimulation. This intensity was then used for recording of the SEP. Application of the 16 stimuli and rating of perceived pain intensity were performed as for the LEP.. Figure 1 An LEP, which is the average of 16 evoked potentials elicited by short laser stimulations of 200 ms duration.. A tone was delivered from a computer with random intervals of 3–8 s, and simultaneously a timer was started. The volunteer was told to press a button as fast as possible after the tone. The reaction time was defined as the time from the tone until the volunteer pressed the button. The mean value of three consecutive measurements was used.. described tests was then performed. Thereafter, isoflurane was introduced slowly into the breathing system and adjusted to the desired end-tidal concentration. This was chosen randomly from one of the three concentrations, 0.08, 0.16 and 0.24 vol%. We did not use concentrations higher than 0.24 vol% (about 0.2 MAC isoflurane), as volunteers at higher concentrations tend to be too sedated to co-operate [13]. After 15 min of equilibration at a constant endtidal concentration, a test series was performed. This procedure was repeated with the two other isoflurane concentrations. The delivered isoflurane concentration was known only to the anaesthetist performing “anaesthesia”. After testing had been performed at all three isoflurane concentrations, isoflurane was discontinued. Latencies and peak-to-peak amplitudes of the first three major peaks, P1, N1 and P2 of the late LEP, SEP and AEP were measured (fig. 1). Statistical analysis was performed independently for each class of the evoked vertex potentials and the reaction time with the software SigmaStat v1.01 (Jandel Scientific GmbH, Erkrath, Germany). Median values and quartiles were calculated for the three isoflurane concentrations. The numerical values of all measurements were expressed as a percentage of baseline values. The values at the different isoflurane concentrations were compared with baseline using Friedman’s test for repeated measures analysis of variance on ranks, and the Student–Newman–Keuls test for multiple comparison. P : 0.05 was considered statistically significant.. RECORDING OF THE EVOKED POTENTIALS. Results. All evoked potentials were recorded from a needle electrode (Dantec, Denmark), inserted at Cz⬘ (according to the international 10–20 system) against a surface Ag-AgCl electrode on the right mastoid. The signal was filtered (bypass 0.1–30 Hz), amplified, recorded and averaged on a personal computer (PC) with the EPsys software (Aalborg University, Denmark) in the interval from 0.5 s before the stimulus until 2 s after the stimulus. In order to familiarize the volunteer with the procedure, all experiments were explained before trial testing was performed. The mask was then fitted and the volunteer breathed air for 5 min, or until he felt comfortable, and there were no leaks from the mask. A baseline test series of the above. Evoked vertex potentials were recorded in all subjects. There were no statistically significant changes in the latencies of the LEP and SEP compared with baseline (table 1) or with the AEP. The results in the peak-to-peak amplitudes are summarized in table 2. Statistically significant reductions compared with baseline were observed for P1–N1 amplitudes of the SEP at 0.16 and 0.24 vol% and for AEP at 0.08, 0.16 and 0.24 vol% isoflurane. N1–P2 amplitudes were reduced significantly for the LEP and SEP at 0.16 and 0.24 vol% and for AEP at 0.08, 0.16 and 0.24 vol% isoflurane. Furthermore, N1–P2 amplitude of the SEP at 0.08 vol% was reduced significantly less compared with those of the SEP and AEP at 0.16 and 0.24 vol%. There were no. ACOUSTICAL STIMULATION. A binaural click with an intensity of 90 dB was provided by a Medelec ST 10 stimulator (Medelec Ltd, Surrey, England) through acoustically shielded headphones. For recording of the AEP, 16 stimuli with a random inter-stimulus interval between 10 and 20 s were applied as described for the laser and electrically evoked vertex potentials.. REACTION TIME.
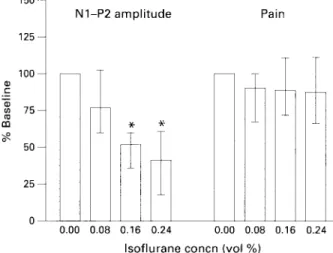
(3) 40. British Journal of Anaesthesia Table 1 Change in latencies (median (25–75 percentiles)) of evoked vertex potentials to laser, electrical and auditory stimulation. Values are percentage of baseline values Isoflurane Latencies Laser evoked potentials P1 Laser evoked potentials N1 Laser evoked potentials P2 Somatosensory evoked potentials P1 Somatosensory evoked potentials N1 Somatosensory evoked potentials P2 Auditory evoked potentials P1 Auditory evoked potentials N1 Auditory evoked potentials P2. 0.08 %. 0.16 %. 0.24 %. 102.9 (100.0–108.8). 99.0 (95.9–103.1). 103.3 (98.1–115.1). 99.3 (96.1–102.5). 99.2 (97.4–102.5). 101.0 (95.1–114.5). 97.6 (94.8–100.0). 98.3 (95.8–101.4). 94.4 (85.3–101.9). 106.3 (76.5–109.3). 102.0 (94.9–116.0). 113.6 (100.0–122.9). 102.2 (100.0–107.1). 98.6 (91.4–109.3). 97.6 (93.2–100.0) 102.7 (96.1–104.7). 99.7 (90.7–105.4). 101.4 (95.9–104.7). 100.0 (95.6–100.0). 100.0 (100.0–105.1). 106.9 (100.0–110.3). 101.5 (100.0–106.0). 100.0 (95.3–108.0). 108.4 (103.2–114.3). 95.4 (93.1–101.9). 102.3 (93.1–107.6). 96.7 (90.7–107.6). Table 2 Change in amplitudes (median (25–75 percentiles)) of evoked vertex potentials to laser, electrical and auditory stimulation. Values are percentage of baseline values. *P : 0.05 compared with baseline; †P : 0.05 compared with baseline and the SEP at 0.08 vol% isoflurane Isoflurane Amplitudes Laser evoked potentials Pl–N1 Laser evoked potentials N1–P2 Laser evoked potentials VAS Somatosensory evoked potentials P1–N1 Somatosensory evoked potentials N1–P2 Somatosensory evoked potentials VAS Auditory evoked potentials P1–N1 Auditory evoked potentials N1–P2. 0.08 %. 0.16 %. 0.24 %. 98.5 (51.6–126.9) 64.7 (54.4–86.6). 51.8 (30.4–107.1). 76.2 (51.7–100.0) 68.9 (23.6–83.8)*. 47.2 (37.5–55.8)*. 97.4 (89.7–100.0) 98.5 (90.0–105.3) 103.7 (92.0–108.7) 49.6 (42.0–86.0). 50.9 (28.9–61.9)*. 18.3 (6.8–42.1)*. 76.5 (59.5–102.7) 51.5 (35.8–59.4)†. 40.9 (17.9–60.7)†. 90.0 (66.7–100.0) 88.6 (71.2–111.1). 87.0 (65.9–111.1). 53.8 (37.7–65.7)* 48.0 (39.7–54.6)*. 45.8 (36.1–70.7)*. 56.1 (40.8–67.5)* 39.0 (37.1–51.6)†. 42.3 (25.0–58.9)†. significant differences between the reductions in the amplitudes of the LEP and SEP compared with the AEP at each of the three isoflurane concentrations (figs 2–4). There was no significant reduction in perceived pain intensity for either laser or electrical stimulation. Compared with baseline, median reaction time was 97.7 % (25–75 percentiles 79.7–127.9 %) at 0.08 vol%, 116.5 % (94.2–128.7 %) at 0.16 vol% and 161.1 % (131.6–238.7 %) at 0.24 vol%. Reaction time was increased significantly at 0.24 vol% compared with baseline, 0.08 and 0.16 vol%.. Discussion Figure 2 Argon laser stimulation. Comparison between the decrease in N1–P2 amplitude (expressed as percentage of baseline values) with increasing isoflurane concentrations of the long latency vertex potential to laser stimuli, and the perceived pain rated on a visual analogue scale. * Significantly different from baseline.. We have shown that subanaesthetic concentrations of isoflurane did not change the latencies of the evoked vertex potentials, but caused a significant reduction in the amplitudes of the LEP and SEP at 0.16 and 0.24 vol% and of the AEP at all three concentrations. There was no change in perceived pain intensity, and isoflurane produced similar.
(4) Isoflurane and evoked potentials. Figure 3 Electrical stimulation. Comparison between the decrease in N1-P2 amplitude (expressed as percentage of baseline values) with increasing isoflurance concentrations of the long latency vertex potential to electrical stimuli, and the perceived pain rated on a visual analogue scale. * Significantly different from baseline.. Figure 4 Auditory stimulation. Decrease in N1–P2 amplitude (expressed as percentage of baseline values) with increasing isoflurane concentrations of the long latency vertex potential to auditory stimuli. * Significantly different from baseline.. reductions in amplitudes of the evoked potentials elicited by both nociceptive and non-nociceptive stimuli. The reaction time was increased significantly at 0.24 vol% isoflurane. We conclude that subanaesthetic concentrations of isoflurane have a sedative but no or only a minimal analgesic effect which the present techniques could not detect. Several studies have shown that potentials, evoked by noxious laser stimuli, correlate with perceived pain intensity [10, 11, 14, 15]. In contrast, there is a lack of correlation between the amplitude of the vertex potential evoked by nociceptive electrical stimulation on the surface of the skin and subjective pain rating [16, 17]. This suggests that transcutaneous electrically evoked vertex potentials are not a reliable measure or correlate for changes within the nociceptive system. In the present study electrical stimulation was applied using the intractaneous technique [12]. This procedure ensured a high current density at the superficial nociceptors. As a consequence, pain thresholds were up to 10 times lower compared with transcutaneous stimulation. The sensation is described as a distinct pricking pain, very similar to. 41 that elicited by laser stimulation. This perception is attributed to the activity in the A␦ nociceptive afferents [18]. Kochs and colleagues [19] used the same technique for eliciting latè SEP. They found that the recorded SEP were sensitive to opioid treatment during inhalation anaesthesia. We did not find any correlation between the decrease in amplitudes of the LEP and SEP, and subjective pain rating. There was a reduction in the peak-to-peak amplitudes for the evoked vertex potentials elicited by nociceptive electrical and laser stimulation at the two higher isoflurane concentrations (see table 2), which could be interpreted as an analgesic effect [16, 20–22]. But the same decrease in the peak-to-peak amplitudes was observed also for the non-nociceptive AEP, and furthermore the perceived pain intensity did not differ significantly from baseline. These results suggest that the reduction in peak-to-peak amplitudes of the LEP and SEP are caused by a non-specific effect of isoflurane on the vertex potentials (sedation ?) rather than by a specific analgesic effect on the nociceptive system. We have shown that when evoked vertex potentials are used to investigate the analgesic effect of a drug, it is important not only to evaluate the effects of nociceptive stimuli, but also to control for a nonanalgesic general effect on the evoked vertex potentials elicited by non-nociceptive stimuli. Furthermore, the electrophysiological responses should (when possible) be compared with subjective pain ratings. If we had measured only the effect of subanaesthetic concentrations of isoflurane on the amplitude of the evoked vertex potentials to painful laser and electrical stimulation, we would have presumed this to result from an analgesic effect, which in reality was not present.. Acknowledgement The study was supported by the Danish Basic Research Foundation, The Desireé and Niels Yde Foundation. The authors thank the Anaesthesia Research Department for technical assistance, especially D. Leibundgut.. References 1. Major V, Rosen M, Mushin WW. Methoxyflurane as an obstetric analgesic: a comparison with trichloroethylene. British Medical Journal 1966; 2: 1554–1561. 2. Abboud TK, Gangolly J, Mosaad P, Crowell D. Isoflurane in obstetrics. Anesthesia and Analgesia 1989; 68: 388–391. 3. McLeod DD, Ramayya GP, Tunstall ME. Self-administered isoflurane in labour. Anaesthesia 1985; 40: 424–426. 4. Siker ES, Wolfson B, Ciccarelli HE, Telan RA. Effect of subanesthetic concentrations of halothane and methoxyflurane on pain threshold in conscious volunteers. Anesthesiology 1967; 28: 337–342. 5. Tomi K, Mashimo T, Tashiro C, Yagi M, Pak M, Nishimura S, Nishimura M, Yoshiya I. Alterations in pain threshold and psychomotor response associated with subanaesthetic concentrations of inhalation anaesthetics in humans. British Journal of Anaesthesia 1993; 70: 684–686. 6. Petersen-Felix S, Arendt-Nielsen L, Bak P, Roth D, Fischer M, Bjerring P, Zbinden AM. Analgesic effect in humans of subanaesthetic isoflurane concentrations evaluated by experimentally induced pain. British Journal of Anaesthesia 1995; 75: 55–60. 7. Jones SF, McQuay HJ, Moore RA, Hand CW. Morphine and ibuprofen compared using the cold pressor test. Pain 1988; 34: 117–122. 8. Arendt-Nielsen L, Bjerring P. Laser-induced pain for.
(5) 42. 9. 10.. 11.. 12. 13.. 14.. British Journal of Anaesthesia evaluation of local analgesia: A comparison of topical application (EMLA) and local injection (lidocaine). Anesthesia and Analgesia 1988; 67: 115–123. Arendt-Nielsen L, Øberg B, Bjerring P. Analgesic efficacy of i.m. alfentanil. British Journal of Anaesthesia 1990; 65: 164–168. Nielsen JC, Bjerring P, Arendt-Nielsen L, Petterson KJ. A double-blind, placebo controlled, cross-over comparison of the analgesic effect of ibuprofen 400 mg and 800 mg on laserinduced pain. British Journal of Clinical Pharmacology 1990; 30: 711–715. Nielsen JC, Bjerring P, Arendt-Nielsen L, Petterson KJ. Analgesic efficacy of immediate and sustained release paracetamol and plasma concentrations of paracetamol. Double blind, placebo-controlled evaluation using painful laser stimulation. European Journal of Clinical Pharmacology 1992; 42: 261–264. Bromm B, Meier W. The intracutaneous stimulus: a new pain model for algesimetric studies. Methods and Findings in Experimental Clinical Pharmacology 1984; 6: 405–410. Newton DEF, Thornton C, Konieczko K, Frith CD, Doré CJ, Webster NR, Luff, NP. Levels of consciousness in volunteers breathing sub-MAC concentrations of isoflurane. British Journal of Anaesthesia 1990; 65: 609–615. Svensson P, Arendt-Nielsen L, Kaaber S, Bjerring P. Vertex potentials evoked by nociceptive laser stimulation of oral mucosa: Relationship to stimulus intensity. Anaesthesia and Pain Control in Dentistry 1993; 2: 27–33.. 15. Arendt-Nielsen L. First pain related evoked potentials to argon laser stimuli: recording and quantification. Journal of Neurology, Neurosurgery and Psychiatry 1990; 53: 398–404. 16. Hill H, Walter MH, Saeger L, Sargur M, Sizemore W, Chapman CR. Dose effects of alfentanil in human analgesia. Clinical Pharmacology and Therapeutics 1986; 40: 178–186. 17. Brennum J, Jensen TS. Relationship between vertex potentials and magnitude of pre-pain and pain sensations evoked by electrical skin stimuli. Electroencephalography and Clinical Neurophysiology 1992; 85: 387–390. 18. Torebjörk HE, Ochoa JL. Specific sensations evoked by activity in single identified sensory units in man. Acta Physiologica Scandinavica 1980; 110: 445–447. 19. Kochs E, Treede R-D, Schulte am Esch J, Bromm B. Modulation of pain-related somatosensory evoked potentials by general anesthesia. Anesthesia and Analgesia 1990; 71: 225–230. 20. Treede R-D, Kief S, Hölzer T, Broom B. Late somatosensory evoked cerebral potentials in response to cutaneous heat stimuli. Electroencephalography and Clinical Neurophysiology 1988; 70: 429–441. 21. Arendt-Nielsen L, Øberg B, Bjerring P. Quantitative assessment of extradural bupivacaine analgesia. British Journal of Anaesthesia 1990; 65: 633–638. 22. Arendt-Nielsen L, Gotliebsen K. Segmental inhibition of laser-evoked brain potentials by ipsi- and contralaterally applied cold pressor pain. European Journal of Applied Physiology 1992; 64: 56–61..
(6)
Figure
Documents relatifs
Our results confirm the hypothesis that wildfires cause a long-term (17 y) decline in soil labile organic and inorganic N concentrations, including N immobilized by soil
- Taking into account the strong interrelation between thermal disorder and surface potentials in ionic crystals, such potentials have been determined for AgCl
The calculated ozone and temperature changes calcu- lated by the model are believed to represent upper limits (as- suming that no major reaction is missing in the chemical
Dans ce texte, recopie la deuxième phrase et la phrase négative. Julie se promène avec ses parents dans
However, in continental Europe, and especially in Russia, where the study of Bulgakov in the last decade has finally ceased to be a taboo, at least on the academic level, the
Martinique Guadeloupe Guyane La Réunion Bretagne Pays de la Loire Normandie Nouvelle-Aquitaine Hauts-de-France Occitanie Centre-Val de Loire Corse Grand
Already in the early 1970’s, artist Daniel Buren published a critical manifesto based on his experience collaborating with curator Harald Szeemann in which he
Calcul de l'Aire, Périmètre, Longueur ou Largeur des Rectangles (Avec de Larges Nombres Entiers) (A)
[r]
