Energy Transfer in Gas-Phase Ions
Maxim Dashtiev, Vladimir Azov, Vladimir Frankevich,
Ludwig Scharfenberg,* and Renato Zenobi
Department of Chemistry and Applied Biosciences, Swiss Federal Institute of Technology, ETH Hönggerberg, CH-8093 Zürich, Switzerland
Fluorescence resonance energy transfer (FRET) is a distance-sensitive method that correlates changes in fluorescence intensity with conformational changes, for example, of biomolecules in the cellular environment. Applied to the gas phase in combination with Fourier transform ion cyclotron resonance mass spectrometry, it opens up possibilities to define structural/ conformational properties of molecular ions, in the absence of solvent, and without the need for purification of the sample. For successfully observing FRET in the gas phase it is important to find suitable fluorophores. In this study several fluorescent dyes were examined, and the correlation between solution-phase and gas-phase fluorescence data were studied. For the first time, FRET in the gas phase is demonstrated unambiguously. (J Am Soc Mass Spectrom 2005, 16, 1481–1487) © 2005 American Society for Mass Spectrometry
T
he study of biomolecular conformation in the gas phase has attracted great attention because it opens possibilities to compare gas-phase and solution-phase structures and to understand the effect of the solvent on a molecule. Because matrix-assisted laser desorption/ionization (MALDI) [1] and electros-pray ionization (ESI) [2] typically generate unsolvated ions without any adducts, their structure also provides an ideal model system for theoretical calculations of conformations. A major question today is whether singly or multiply charged biomolecular ions produced by soft ionization methods retain their native (or at least a “na-tive-like”), active conformation in the gas phase. This is often assumed but needs to be proven rigorously.Mass spectrometry has many attractive features for studying biomolecules in the gas phase, including the capability of the isolation of ions and elimination of unwanted species before detection and a positive iden-tification of the molecule from the exact mass or from tandem mass spectrometry (MS/MS) data. There are mass spectrometric methods available for obtaining conformational information of molecules in the gas phase: blackbody infrared radiative dissociation where ions undergo unimolecular dissociation by exchanging their energy with the surroundings by absorption and emission of infrared photons [3], collision-induced dis-sociation where ions are dissociated as a result of interaction with a target neutral species [4], hydrogen– deuterium exchange where hydrogen atoms of the
protein are exchanged with the deuterium atoms from a solution [5], covalent or noncovalent tagging of biomol-ecules based on the surface accessibility of specific moieties [6, 7], and ion mobility spectrometry where the measured cross section of the molecule is compared with a theoretically calculated cross section [8]. How-ever, generally speaking, these methods yield only indirect information about the gas-phase conformation, which is often derived from either the overall cross section of the molecule, from a fragmentation pattern, or from a dissociation rate.
Recently, the efficient trapping capabilities of mass spectrometry have been coupled with the high sensitiv-ity of fluorescence detection to provide structural and spectroscopic information of molecules in the gas phase. The general idea behind this is to simultaneously obtain completely “orthogonal” information on gas-phase molecular conformation from optical spectros-copy. In principle, optical spectroscopic investigations thereby can be combined with any of the mass spectro-metric methods described previously [9, 10]. Marshall et al. have measured laser-induced fluorescence (LIF) excitation and emission spectra as well as LIF lifetimes of ions trapped in a Fourier transform ion cyclotron resonance (FTICR) cell [11–13]. Scott et al. showed a dual cell setup for obtaining fluorescence lifetimes of trapped ions [14]. Recently, Wright et al. reported the wavelength-resolved LIF of rhodamine 6G ions in a Paul trap [15].
Fluorescence resonance energy transfer (FRET) [16, 17] is a distance-sensitive method that correlates changes in fluorescence intensity with changes in dis-tance and orientation of specific spectroscopically active (donor, acceptor, quencher) moieties. The distance be-tween fluorophores is defined as the distance bebe-tween
Published online July 14, 2005
Address reprint requests to Professor Renato Zenobi, Swiss Federal Insti-tute of Technology, Department of Chemistry, ETH Honggerberg, HCI E 329, CH-8093 Zurich, Switzerland. E-mail: zenobi@org.chem.ethz.ch * Current address: Department of Chemistry, Technical University of Berlin, Strasse des 17. Juni 135, D-10623 Berlin, Germany.
© 2005 American Society for Mass Spectrometry. Published by Elsevier Inc. Received February 28, 2005
1044-0305/05/$30.00 Revised April 25, 2005
the centers of the donor and acceptor chromophores [16];ÅtheirÅrelativeÅorientationÅhasÅbeenÅfoundÅtoÅplayÅa fairly minor role. It is well established that the FRET technique can be used as a “molecular ruler” in the 10-toÅ60-ÅÅrangeÅforÅlabeledÅbiomoleculesÅinÅsolutionÅ[18]. FRET measurements can thus provide fairly direct, quantitative information of molecular conformation. Pioneering work by Parks et al. has indicated how the dissociation of oligonucleotide duplexes labeled by FRET pairs can be followed for gas-phase ions trapped inÅaÅPaulÅtrapÅ[19,Å20].ÅTheÅoligonucleotidesÅwere labeled with fluorophores, boron-dipyrromethene (BODIPY) analogs of tetramethylrhodamine (a donor) and Texas red (TR; a quencher). At room temperature the fluorescence from the donor was decreased by the proximity of TR. By increasing the temperature the authors were able to observe the dynamics of dissocia-tion of the duplex by an increase of the donor fluores-cence. However, only a 10% increase of the donor fluorescence was observed, which also may be inter-preted as being a temperature induced effect (i.e., not because of dissociation). Furthermore, the acceptor flu-orescence, a common diagnostic to identify an FRET process,ÅwasÅnotÅdetectedÅinÅRefs.Å[19,Å20].
Thus, it is desirable to unambiguously show the occurrence of FRET in the gas phase. This was the goal of the present study. Also, because the behavior of fluorophores in the gas phase is largely unknown, it is important to find a suitable FRET pair before actually attempting FRET. This study presents our findings for different dye molecules trapped in ionized form in an FTICR-mass spectrometer (FTICR-MS)/Penning trap.
We found that some dyes that fluoresce in solution give very little fluorescence in the gas phase or give no fluorescence at all. Based on that, we examined several dyes, trying to understand why this discrimination in fluorescence occurs. Also, considerable shifts in absorp-tion and emission wavelengths when going from solu-tion to gas phase were found. A suitable FRET pair was identified; rhodamine 6G covalently bound with sulfor-hodamine B through a rigid linker. The occurrence of FRET in the gas phase is unambiguously shown for this system.
Experimental
Rhodamine 6G, sulforhodamine B, sulforhodamine B sulfonyl chloride (⫽ lissamine rhodamine B), and sul-forhodamine 101 were purchased from Acros Organics (Morris Plains, NJ). The structures of the dyes and their derivativesÅtestedÅareÅshownÅinÅFigureÅ1 .ÅAmideÅderiv-atives 4, 6, and 7 were prepared from rhodamine 6G and the corresponding amines as described previously [21].ÅCompoundÅ5 wasÅpreparedÅbyÅmixingÅsulforho-damine B sulfonyl chloride and n-butylamine in DMF (dimethylformamide), stirring the reaction mixture overnight, evaporation, and flash chromatography us-ing CHCl3/MeOH as eluent. Separation of the o- and
p-isomers was possible; the predominant p-derivative
was used for the gas-phase studies. Dye pairs 8 and 9 were prepared from sulforhodamine B sulfonyl chloride and the corresponding amines 6 and 7 were prepared in a similar fashion. All compounds were characterized by NMR, high-resolution MALDI-TOF, UV/VIS, and fluo-Figure 1. Structures of dyes and their derivatives. Compounds 1, 4, 6, 7, rhodamine 6G, and its
derivatives (absorption/emission maxima for 1 are at 530/556 nm in ethanol). Compounds 2 and 5, sulforhodamine B, and its derivative (556/575 in ethanol); compound 3, sulforhodamine 101 (578/597 in ethanol), compounds 8 and 9, and rhodamine 6G covalently bound with sulforhodamine B, compound 10, BODIPY (529/542 nm in CHCl3).
rescence spectroscopy. Solution measurements were per-formed on a Varian Cary 500 Scan UV/VIS/NIR spectro-photometer (Palo Alto, CA) and a Jobin-Yvon Flurolog-3 spectrofluorometer (Munich, Germany) in absolute meth-anol. Absorption/emission spectra for rhodamine dyes in solution are available from various sources (e.g., Lamb-dachrome,ÅGoettingen,ÅGermany)Å[22]ÅandÅMolecular Probes,ÅEugene,ÅORÅ[23]).
MALDI samples were prepared using a standard “dried droplet” method using 2,5- dihydroxybenzoic acid (Acros Organics) for rhodamine 6G and its deriv-atives and 4-hydroxy-␣-cyanocinnamic acid (Fluka AG, Buchs, Switzerland) for all other compounds.
The full description of the specially adapted FTICR instrumentÅisÅgivenÅelsewhereÅ[24].ÅTheÅsequenceÅof events in a typical experiment starts with a laser pulse (third harmonic of a Nd:YaG laser, ⫽ 355 nm) for ion generation by an internal MALDI source, gated trap-ping of the ions, buffer gas introduction via a leak valve forÅ10Ås,ÅandÅsimultaneousÅquadrupolarÅaxializationÅ[25] of the ions for 10-20 s. The laser for exciting the fluorophores is on during the whole sequence, normally for 20 s. The sequence is concluded by chirp excitation and detection of the ion signal giving the mass spec-trum. In all experiments, He was used as a buffer gas. The fluorescence is collected over the whole experiment in the following manner: the trapped ions are excited by an Ar ion laser (Innova 300, Coherent, Santa Clara, CA) with either 488 nm or 514 nm. The typical Ar-laser power used in these experiments was 120 mW. The emitted fluorescence passes through a wire mesh-cov-ered cutout in one of the cell plates and is then collected by a collimator. The collimator focuses the light onto an optical fiber that is connected to an optical vacuum feedthrough (Caburn Vacuum Science, Ltd., Glynde/ East Sussex, UK). Outside of the vacuum, an additional optical fiber passes the light to another collimator, to a long pass filter (FEL 500; Thorlabs, Karlsfeld, Germany), and finally to the detector (SPCM- ACQ-16; Perkin-Elmer). The signal is recorded by an 800-MHz gated single photon counter/multiscaler (PMS 400; Becker & Hickl GmbH, Berlin, Germany).
Results and Discussion
Optimization of the Pressure in the ICR Cell
FigureÅ2ÅshowsÅtheÅdependenceÅofÅtheÅfluorescence signal intensity of rhodamine 6G ions on the back-ground pressure in the ICR cell. The curve represents the average of five different experiments. The same shape of the curve was obtained for other dyes studied. An increase of the fluorescence by two orders of magnitude was found as the background pressure increases. There may be several reasons for this obser-vation. Most importantly, quadrupolar axialization works more efficiently at higher pressure, thus squeez-ing an ion cloud to a tighter packet, resultsqueez-ing in a better spatial overlap with the laser beam. Shrinking the size
of the ion cloud is possible up to a limit, when Coulomb repulsion will become important. The “saturation be-havior”ÅofÅtheÅcurveÅinÅFigureÅ2ÅisÅprobablyÅsimply because of better and better spatial overlap of the laser beam with the ion cloud. Once the diameter of the ion cloud becomes smaller than the diameter of the excita-tion laser beam, the curve should become essentially flat.
A second reason for the increase in fluorescence signal with pressure may be related to the fact that more collisions lead to a higher rate of energy transfer to the surrounding molecules, thus preventing photo-bleaching/photodissociation. In fact, fragmentation wasÅobservedÅatÅlowerÅoperatingÅpressuresÅ[24],ÅandÅat the elevated pressure used here, it was largely absent. Third, it is also possible that if a molecule in the singlet state underwent conversion into a nonfluorescent (“dark”) triplet state, collisions can bring the molecule back to the ground state, making it available for fluo-rescence excitation again. We found that on increasing the pressure it is possible to increase the Ar-laser power to excite molecules to a maximum extent. In the exper-imentÅshownÅinÅFigureÅ2,ÅeveryÅpointÅofÅtheÅcurveÅwas taken at the optimum laser power (i.e., the photon yield was maximized). The optimum laser power for excita-tion is found to be in the range of 120-150 mW, depending on the pressure used. Because a turbopump maintains the pressure in the cell region, the pressure should not exceed 10⫺4mbar. All further experiments were performed at this pressure. The pumpdown time to the pressure of 10⫺7 mbar was 15 s. Mass spectra were taken at the pressure ofⱕ10⫺7mbar.
BODIPY Dye
As a subject of investigation we first chose compound 10. It belongs to the family of BODIPY dyes and was of interest to us because its derivative can be used for labelingÅaÅdynamicÅmolecularÅcavitandÅ(“gripper”)Å[26, 27].ÅStudiesÅofÅtheÅsinglyÅandÅdoublyÅdyeÅlabeled cavitands in the gas phase by fluorescence spectroscopy can provide valuable insight into the conformational dynamics of these flexible structures in a nonsolvated Figure 2. Dependence of fluorescence signal intensity of rhoda-mine 6G (1) ions on the pressure in the ICR cell. The curve represents the average of five different experiments.
state and can be compared with the results obtained for theÅsolutionÅbyÅdynamicÅNMRÅspectroscopyÅ[28 ].ÅFur-thermore,ÅParksÅandÅcoworkersÅ[19,Å20]ÅpreviouslyÅused BODIPY labeled biomolecules for FRET measurements in the gas phase, which provided an additional choice. Before starting to measure fluorescence in the gas phase, the dye 10 was characterized in solution. The absorption and emission maxima in CHCl3 were 529 and 542 nm, respectively, and the measured quantum yield was 0.7. To predict a possible shift in the emission spectrum in the nonpolar gas-phase environment, ex-periments in dimethylchloride, toluene, and hexane were performed. Neither a shift nor a significant fluo-rescence decrease was found. Thus, one would not expect any decrease in fluorescence intensity in the gas phase. Under MALDI conditions, compound 10 was very unstable, giving fragments of the molecular ion without fluorine. Only on the edge of the sample was it possible to produce molecular ions. Surprisingly, even intact trapped molecular ions did not show any fluo-rescence in the gas phase. Possibly, 488 nm is a poor wavelength to excite this dye in the gas phase (Parks and coworkers used 532 nm). Another possible expla-nation for this unexpected inactivity of the fluorophore in the gas phase is that in MALDI, the BODIPY moiety is protonated at a location different from the amino group or the positive charge is delocalized over the entire BODIPY structure (Parks and coworkers used ESI for ion generation).
Rhodamine Dyes
Another class of well-characterized dyes that we inves-tigated is the dye of the rhodamine family. There are also practical reasons for this choice such as their low cost, possibility of easy chemical modification, and high quantum yield in solution. Because of their ionic nature, they can be easily ionized by MALDI. The spectral bands for different rhodamine derivatives lie within a range of 480 – 600 nm, which make them suitable for excitation by the Ar laser as well as the Nd:YaG laser (532 nm, second harmonic).
The dependence of the fluorescence signal for rho-damine dyes on the number of ions at a pressure of 10⫺4 mbar was found to be linear. This is consistent with our previousÅresultsÅobtainedÅatÅ10⫺7ÅmbarÅ[24 ].ÅTheÅnum-ber of ions in the ICR cell was maximized and main-tained for all fluorescence experiments.
FigureÅ3ÅshowsÅtheÅmassÅspectrumÅofÅrhodamineÅ6G and the corresponding fluorescence signal. The peak (m/z⫽Å443)ÅinÅtheÅspectrumÅofÅFigureÅ3aÅcorrespondsÅto the molecular cation moiety of rhodamine 6G. The absence of isotope signals is an artifact of quadrupolar axialization; this also refers to all other mass spectra shown. The rapid increase in fluorescence intensity in
FigureÅ3bÅisÅcausedÅbyÅtheÅpressureÅincreaseÅinÅtheÅcell region. Then, 10 s later, the pressure is brought back to its initial value of about 10⫺7 mbar. The background levelÅinÅFigureÅ3bÅcorrespondsÅtoÅtheÅsignalÅcollectedÅat
the pressure of 10⫺7 mbar. The signal represents the total photon count that reaches the detector. It was observed that the excitation of rhodamine 6G ions with a 488-nm wavelength resulted in stronger fluorescence than with 514 nm, while in solution 514 nm is more favorable. A blue shift of 30 nm on desolvation was previously observed by Blades and coworkers for rho-damineÅ6G,ÅconsistentÅwithÅourÅfindingsÅ[29].ÅBecause rhodamine 6G nicely absorbs at 488 nm in the gas phase, it is a suitable donor molecule for attempting gas-phase FRET with the laser lines we have available.
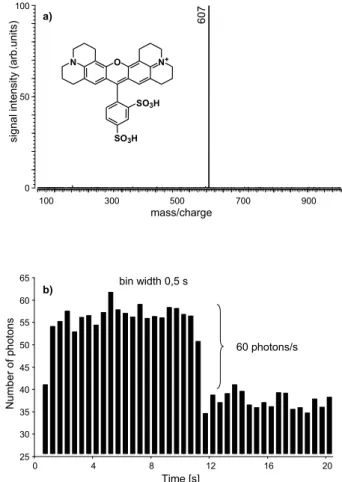
FigureÅ4ÅshowsÅtheÅmassÅspectrumÅandÅtheÅ correspond-ing fluorescence signal of sulforhodamine B ions. The peakÅ(m/z⫽Å559)ÅinÅtheÅspectrumÅofÅFigureÅ4aÅcorresponds to the protonated molecular ion. The fluorescence was measured using both 488 and 514 nm as excitation wave-lengths. All experimental conditions such as laser power, pressure in the ICR cell, and duration of the experiment were kept the same as in the previous experiment. As in the foregoing case, we found a shift in the optical spectra, which is thought to be around 40 nm to shorter wave-lengths. Far fewer photons were obtained for excitation with 488 nm compared with 514 nm. This suggests the use of sulforhodamine B or its derivatives as an acceptor fluorophore.
Figure 3. (a) Mass spectrum of rhodamine 6G (1) and (b) average fluorescence signal after excitation at 488 nm. Asterisks in (a) indicate known RF (radiofrequency) interferences.
FigureÅ5ÅshowsÅtheÅmassÅspectrumÅofÅsulforhodamine 101 and the corresponding fluorescence signal at 514 nm. Fewer photons were observed in this experiment although the solution quantum yield of 0.91 is almost the same as for rhodamine 6G. This can be interpreted by a lower absorbance of sulforhodamine 101 ions at 514 nm. Almost no photons were observed when exciting with 488 nm.
To understand the effect of derivatization of rhoda-mine 6G on the fluorescence behavior, compounds 4, 6,and 7 as well as sulforhodamine B derivative 5 were investigated. The spectral data in solution as well as measurements of fluorescence signals in the gas phase
showed the same fluorescence intensity as for unmod-ified rhodamine 6G and sulforhodamine B. Thus, we do not expect a significant decrease in fluorescence quan-tum yield on derivatization of rhodamine 6G.
FRET Measurements
FigureÅ6ÅshowsÅtheÅsolution-phaseÅabsorption/emission spectra of compound 9 in MeOH using 488-nm excita-tion.ÅItÅcanÅbeÅdeducedÅfromÅFigureÅ6ÅthatÅfluorescence resonance energy transfer should occur with almost 100% efficiency in solution: the prerequisite for such a high efficiency is a good overlap between the donor’s emission and the acceptor’s absorption spectra, which is the case for compound 9. The quantum yield measured in solution was later compared with the quantum yield of rhodamine 6G (0.96) and sulforhodamine B (0.91) and it was found to be lower by factor of 3.
The mass spectrum and the corresponding fluores-cenceÅsignalÅareÅshownÅinÅFigureÅ7.ÅTheÅlowerÅoverall photon yield is because of the lower quantum yield of compound 9. To be sure that this fluorescence is coming from the sulforhodamine B (acceptor) moiety ions and not from a tail in the rhodamine 6G (donor) emission, the following control experiment was per-formed. As shown before, the main part of fluores-cence of rhodamine 6G ions is within a range of Figure 4. (a) Mass spectrum of sulforhodamine B (2) and average
fluorescence signal after excitation at (b) 514 nm and (c) 488 nm.
Figure 5. (a) Mass spectrum of sulforhodamine 101 (3) and (b) average fluorescence signal after excitation at 514 nm.
500-530 nm. Selecting the same window by two filters weÅconfirmedÅthisÅfactÅ(FigureÅ8a).ÅTheÅlowerÅoverall photon counts compared with the fluorescence signal shownÅinÅFigureÅ3bÅisÅbecauseÅofÅabsorptionsÅbyÅthe second filter, which was introduced, and to the somewhat narrow emission window selected by
fil-ters, which does not cover the entire emission band.
FigureÅ8bÅrepresentsÅtheÅfluorescenceÅsignalÅintensity of compound 9 using the same wavelength window. No fluorescence at all was observed, indicating that no significant losses occur because of radiative pro-cesses. Based on the these facts and taking into account that the fluorescence of pure sulforhodamine B ions excited with 488 nm was low, we can safely conclude that efficient fluorescence resonance energy transfer occurred between the rhodamine 6G and sulforhodamine B moieties of 9 in the gas phase.
We did not get any fluorescence signal from com-pound 8 in the gas phase. Solution spectra also showed greatly suppressed fluorescence. Possible ex-planations include formation of a more complex fluorophore with vastly different fluorescence prop-erties or (spectroscopic) self-quenching of the fluoro-phores because of a much better spatial proximity, allowed by the flexible linker. In contrast, the more rigid spacer in 9 is expected to prevent close contact between the dye moieties. For completeness, we note that biomolecules, at least if they are somewhat stabilized by a folding motive, should not exhibit a very large degree of conformational flexibility and should be amendable to FRET investigations in the gas phase as well.
Figure 7. Mass spectrum of compound 9 and average fluores-cence signal after excitation at 488 nm.
Figure 6. Absorption/emission spectra of compound 9 in MeOH solution. The insert shows the absorption and emission spectra of the isolated fluorophores (solid line, sulforhodamine B; dashed line, rhodamine 6G).
Figure 8. (a) Rhodamine 6G fluorescence signal collected from the (500 ѧ 530 nm) window and (b) fluorescence signal of compound 9 collected from the same window.
Conclusions
We examined and described several compounds and established a correlation between solution-phase and gas-phase fluorescence. A considerable shift of the absorption and emission spectra for rhodamine 6G and sulforhodamine B was found. For the first time, efficient fluorescence resonance energy transfer in the gas phase between two fluorophores was unambiguously shown. A dramatic decrease of fluorescence between a co-valently bound FRET pair and a control (without accep-tor) was demonstrated.
References
1. Karas, M.; Bachmann, D.; Bahr, U.; Hillenkamp, F. Matrix-Assisted Ultraviolet Laser Desorption of Non-Volatile Com-pounds. Int. J. Mass Spectrom. Ion Process. 1987, 78, 53– 68. 2. Fenn, J. B; Mann, M.; Meng, C. K.; Wong, S. F.; Whitehouse,
C. M. Electrospray Ionization for Mass Spectrometry of Large Biomolecules. Science 1989, 246, 64 –71.
3. Dunbar, R. C. BIRD (Blackbody Infrared Radiative Dissocia-tion): Evolution, Principles, and Applications. Mass Spectrom.
Rev. 2004, 23, 127–158.
4. Burlingame, A. L.; McCloskey, J. A. Biological Mass
Spectrom-etry; Elsevier: Amsterdam, 1990; p 179.
5. Engen, J. R.; Smith, D. L. Investigating Protein Structure and Dynamics by Hydrogen Exchange MS. Anal. Chem. 2001, 73, 256A–265A.
6. Friess, S. D.; Zenobi, R. Protein Structure Information From Mass Spectrometry? Selective Titration of Arginine Residues by Sulfonates. J. Am. Soc. Mass Spectrom. 2001, 12, 810 – 818. 7. Sharp, J. S.; Becker, J. M.; Hettich, R. L. Analysis of Protein
Solvent Accessible Surfaces by Photochemical Oxidation and Mass Spectrometry. Anal. Chem. 2004, 76, 672– 683.
8. Shelimov, K. B.; Clemmer, D. E.; Hudgins, R. R.; Jarrold, M. F. Protein Structure In Vacuo: Gas-Phase Conformations of BPTI and Cytochrome c. J. Am. Chem. Soc. 1997, 119, 2240 –2248. 9. Oomens, J.; Polfer, N.; Moore, D. T.; van der Meer, L.;
Marshall, A. G.; Eyler, J. R.; Meijer, G.; von Helden, G. Charge-State Resolved Mid-Infrared Spectroscopy of a Gas-Phase Protein. Phys. Chem. Chem. Phys. 2005, 7, 1345–1348. 10. Oh, H.; Lin, C.; Hwang, H. Y.; Zhai, H.; Breuker, K.;
Zabrouskov, V.; Carpenter, B. K.; McLafferty, F. W. Infrared Photodissociation Spectroscopy of Electrosprayed Ions in a Fourier Transform Mass Spectrometer. J. Am. Chem. Soc. 2005,
127, 4076 – 4083.
11. Wang, Y.; Hendrickson, C. L.; Marshall, A. G. Direct Optical Spectroscopy of Gas-Phase Molecular Ions Trapped and Mass Selected by Ion Cyclotron Resonance: Laser-Induced Fluores-cence Excitation Spectrum of Hexafluorobenzene (C6F6⫹).
Chem. Phys. Lett. 2001, 334, 69 –75.
12. Cage, B.; McFarland, M. A.; Hendrickson, C. L.; Dalal, N. S.; Marshall, A. G. Resolution of Individual Component Fluores-cence Lifetimes From a Mixture of Trapped Ions by
Laser-Induced Fluorescence/Ion Cyclotron Resonance. J. Phys.
Chem. A. 2002, 106, 10033–10036.
13. Friedrich, J.; Fu, J.; Hendrickson, C. L.; Wang, Y.; Marshall, A. G. Time Resolved Laser Induced Fluorescence of Electros-prayed Ions Confined in a Linear Quadrupole Trap. Rev. Sci.
Instrum. 2004, 75, 4511– 4515.
14. Scott, J. R.; Tremblay, P. L.; Durham, B.; Ham, J. E. Design of a Fluorescence Lifetime Detection System for Ions Trapped in a Fourier Transform Mass Spectrometer. Proceedings of the 49th
Annual ASMS Conference on Mass Spectrometry and Allied Topics;
Chicago, IL, June 2001.
15. Wright, K. Ph.D dissertation, University of British Columbia, 2003.
16. Stryer, L. Fluorescence resonance energy transfer as a spectro-scopic ruler. Ann. Rev. Biochem. 1978, 47, 819 – 846.
17. Valeur, B. Molecular Fluorescence; Wiley-VCH Verlag GmbH: Weinheim, Germany, 2001; p 247.
18. Wu, P. G.; Brand, L. Resonance Energy Transfer: Methods and Applications. Anal. Biochem. 1994, 218, 1–13.
19. Danell, A. S.; Parks, J. H. FRET. Measurements of Trapped Oligonucleotide Duplexes. Int. J. Mass Spectrom. 2003, 229, 35– 45.
20. Danell, A. S.; Parks, J. H. Fraying and Electron Autodetach-ment Dynamics of Trapped Gas Phase Oligonucleotides.
J. Am. Soc. Mass Spectrom. 2003, 14, 1330 –1339.
21. Adamczyk, M.; Grote J. Synthesis of Probes With Broad pH Range Fluorescence. Bioorg. Med. Chem. Lett. 2003, 13, 2327– 2330.
22. Brackmann, U. Lambdachrome Laser Dyes; Lambda Physik GmbH: Goettingen, Germany, 1986.
23. www.probes.com
24. Frankevich, V.; Guan, X.; Dashtiev, M.; Zenobi, R. Laser Induced Fluorescence of Trapped Gas-Phase Molecular Ions Generated by Internal Source MALDI in an FTICR Mass Spectrometer. Eur. J. Mass Spectrom. (EFTMS-7 special issue), Available at http://www.impub.co.uk/abs/W374.html. 25. Guan, S.; Kim, H. S.; Wahl, M. C.; Wood, T. D.; Xiang, X.;
Marshall, A. G. Shrink-Wrapping an Ion Cloud for High Performance Fourier Transform Ion Cyclotron Resonance Mass Spectrometry. Chem. Rev. 1994, 94, 2161–2182.
26. Azov, V. A.; Diederich, F.; Lill, Y.; Hecht, B. Synthesis and Conformational Switching of Partially and Differentially Bridged Resorcin Arenes Bearing Fluorescent Dye Labels. Preliminary Communication. Helv. Chim. Acta. 2003, 86, 2149 – 2155.
27. Azov, V. A.; Skinner, P. J.; Yamakoshi, Y.; Seiler, P.; Gramlich, P.; Diederich, F. Functionalized and Partially or Differentially Bridged Resorcin Arene Cavitands: Synthesis and Solid-State Structures. Helv. Chim. Acta. 2003, 86, 3648 –3670.
28. Azov, V. A.; Jaun, B.; Diederich, F. NMR Investigations into the Vase-Kite Conformational Switching of Resorcin Arene Cavitands. Helv. Chim. Acta. 2004, 87, 449 – 462.
29. Wright, K. C.; Blades, M. W. Fluorescence Emission Spectros-copy of Trapped Molecular Ions. Presented at the 51st Annual ASMS Conference on Mass Spectrometry and Allied Topics, Montreal, Canada, June, 2003.