• Aucun résultat trouvé

TRACEABILITY OF RAW MATERIALS IN SILOS IN AN ANODE PLANT Dipankar Bhattacharyay1, Duygu Kocaefe

N/A
N/A
Protected

Academic year: 2021

Partager "TRACEABILITY OF RAW MATERIALS IN SILOS IN AN ANODE PLANT Dipankar Bhattacharyay1, Duygu Kocaefe"

Copied!
6
0
0

Texte intégral

(1)

TRACEABILITY OF RAW MATERIALS IN SILOS IN AN ANODE PLANT Dipankar Bhattacharyay

1

, Duygu Kocaefe

1

, Yasar Kocaefe

1

, BrigitteMorais

2

, Jacques Lafrance

2

1

UQAC/Aluminerie Alouette Research Chair on Carbon, University of Québec at Chicoutimi, 555 Boulevard de l'Université, Chicoutimi, Québec, Canada G7H 2B1

2

Aluminerie Alouette Inc., 400, Chemin de la Pointe-Noire, Sept-Îles, Québec, Canada G4R 5M9 Keywords: Carbon anodes, silos, traceability, raw materials, coke, pitch

Abstract

Carbon anodes, regularly consumed in primary aluminum production, are made of coke, pitch, and recycled materials. Coke is a byproduct of refineries, and its properties depend on the source of crude oil. Similarly, pitch properties depend on the coal tar source and the manufacturing process. Different coke and pitch mixtures are commonly used in anode manufacturing to meet various regulations and/or due to economics and availability. This makes it hard to maintain the anode quality. Coke and pitch are placed in silos and used when required for production. It is hard for the industries to track the source of raw materials used in their daily recipes. This article presents an approach to trace back the details of raw materials used with a custom-made software, which takes into account the type (mass flow or funnel flow) of silos.

Such tracking can help identify the causes of problems and maintain/improve anode quality.

Introduction

Carbon anode is one of the key components required for the production of primary aluminum. It is made of calcined petroleum coke, coal tar pitch, and recycled materials such as butts and rejected anodes [1]. The raw materials are usually the by-products of different industries. Coke used in anodes is a by-product of oil refineries. It has limited interest to the petroleum refineries as it constitutes only about 2% of their overall production [2]. Also depending on the starting raw materials, the quality of the coke [1]

or pitch can vary.

In an anode plant, coke and pitch are purchased from different suppliers. Also, the quality of coke from the same supplier can vary depending on the petroleum crude and calcinations conditions used [1]. They are then stored in silos and used when required. Thus, different consignments of coke/pitch may rest in a silo at a certain point in time.

Measured quantities of raw materials are taken out of the silos, and anodes are made using these raw materials in a manufacturing process that involves a series of stages: sizing, mixing, forming, cooling, and baking [3].

Due to variations in the quality of raw materials, the quality of anodes changes from time to time [3]. In the plant, the parameters related to the production are usually recorded and maintained for future analysis [3]. The granulometry and the coke/pitch composition are recorded, but the consignment numbers corresponding to the raw materials are not usually kept. The properties of the raw materials for each consignment are usually documented in the records which can provide an insight into the quality of an anode provided that the consignment numbers corresponding to the raw materials used are known. However, in

the plants, as the consignment numbers corresponding to the raw materials used are not usually tracked, it is difficult to analyze the quality of an anode as a function of the raw material properties.

In this article, a method is described and presented which can be used to track the consignment numbers corresponding to the raw materials used.

Methodology Types of silos

About 60% of solid state industrial products, at some stage of production, appear as powders or grains. They are stored in containers, mostly in silos [4].

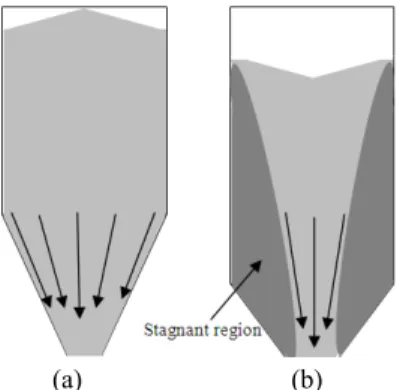
A hopper is the conical or converging section of a powder storage container, and the bin is the parallel sided section, usually cylindrical or rectangular, and the word silo is often used to cover the entire container. There are two main silo types; namely, mass flow and funnel flow, which describe the discharges of particles from a silo [5-7]. In a mass flow type, the flow pattern is often described as first-in-first-out (FIFO) whereas for the funnel flow type, the flow pattern is last-in-first-out (LIFO).

In the case of mass flow type, all the material is in motion during the discharge [8]. The flow is uniform and the feed density is independent of the head of solids in the bin. There are no stagnant regions in the silo. Usually small and free flowing particles or those are prone to caking behave according to mass flow type. In the case of mass flow, the hopper walls are usually steep and low in friction [8].

In the case of funnel flow type, some of the material moves while the rest remains stationary. The stagnant zone can reach the top level of filling [8]. Funnel flow discharge usually takes place if the bulk solid is coarse, free-flowing, and not prone to cake. In this type of silo, flow segregation may occur. In the case of funnel flow, either the hopper wall is too flat or has high friction [8].

When the particles are coarse, free-flowing, do not degrade with time and segregation is not important, funnel flow type silo is the most economical option. On the other hand if the particles are free-flowing but not coarse mass flow type of silo is desirable.

Before the 1960s storage bins were designed usually by guessing.

The approach changed by the research of A. W. Jenike in the 1960s. He developed the criteria that can affect material flow in storage vessels and also developed the theory and methods to implement the theories. His primary works were published in

"Gravity Flow of Bulk Solids", Bulletin 108, University of Utah

Engineering Experiment Station, October 1961, and Bulletin 123,

November 1964. He developed the translational shear tester,

(2)

known as Jenike Shear Tester, to determine the internal friction angle, wall friction angle, bulk density, flow function and rate, and to define the flow pattern in mass and funnel silos [9]. Carr [10] developed a classification system to help in the design and selection of type of silo. He identified a set of test indices such as, angle of repose, angle of fall, angle of difference, loose bulk density, packed bulk density, compressibility, cohesion, uniformity, angle of spatula, and dispersibility which control the type of flow of material in silos.

For same material the cone angle of the silo can dictate the type of flow. Mass flow can be ensured by providing a steep enough cone angle (greater than 45

o

with the horizontal) and ensuring that the discharge opening is wide enough [11]. The flow patterns in silos and accumulations can be calculated based on three approaches namely, granular dynamics algorithm, kinetic theories and cellular automata approaches. But all those methods can only qualitatively describe experimental results [12]

Algorithm

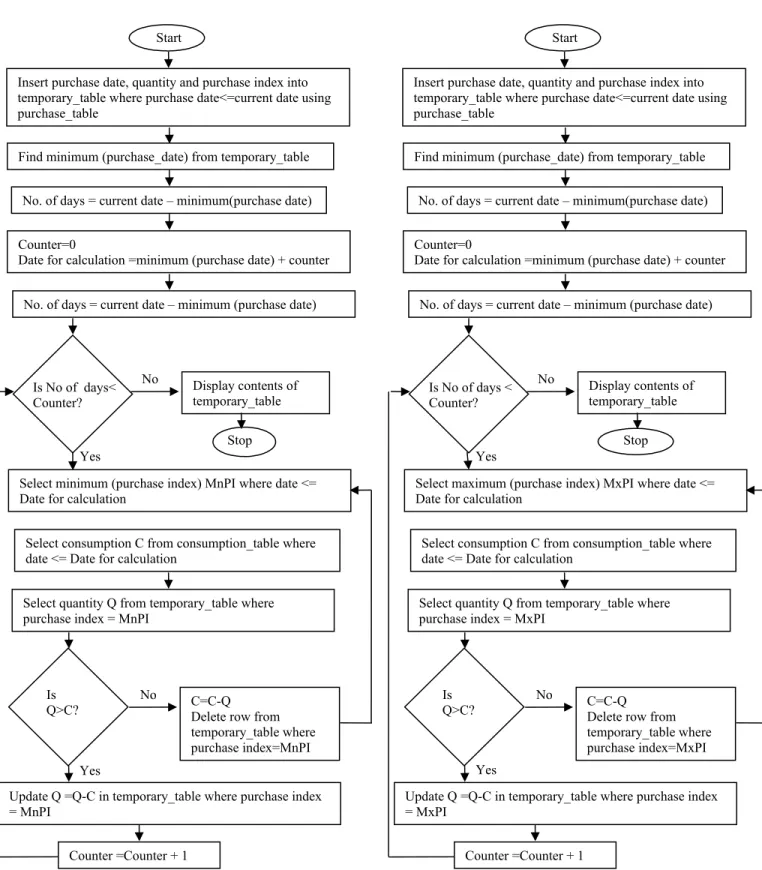
The mass flow and funnel flow silos follow algorithms for queue and stack, respectively. In both cases, it has been assumed that no two consignments mix with each other while transferring the materials into the silos. However, standard algorithms for queues and stacks cannot be directly applied for the silos because part of the materials corresponding to different consignments is consumed during use.

The software consists of two parts: the user interface and a database. The user interface is used to accept data from the user and to show the results to the user. The software processes the data, stores in the database, and then retrieves necessary data from the databased based on the requirement of the user. The database consists of three tables based on specific functionalities. In a plant, the raw materials are purchased and consumed to make anodes. The purchase records for different silos are maintained in the purchase_table. On the other hand, the information on the daily consumption of raw materials from different silos is stored in the consumption_table. Another table named temporary_table has been included to process the data required by the user. For each query by the user, the data in the temporary_table is refreshed. That is why the table is so named.

The purchase_table records the purchase date, details of purchase, and a unique purchase index. The purchase index can exclusively identify any consignment number corresponding to the purchase of raw material. The consumption_table records the amount of raw material consumed on a daily basis. The temporary_table resembles the purchase_table, but is constantly modified during the calculation of raw material status in a silo and is temporary in nature. The algorithms for mass flow and funnel flow types of silos are given in Figures 2 and 3, respectively.

Results and discussion

The algorithm was implemented using Visual Basic 6.0 as the front end and Microsoft Access as the back end. A software was developed and validated with a set of test data. Figure 4 shows the user interface of the software developed. This software can predict the availability of raw material in any silo at any given date for

both types of silos. An example is given below to show the utility of the software.

(a) (b)

Figure 1. Two types of silos: (a) Mass flow (b) Funnel flow Tables 1 and 2 show the lists of purchases made and consumptions occurred in the month of November 2012, respectively. The data used in the tables are imaginary and intended just to show how the algorithm works. Table 1 shows that the total purchase before November 16 was 620 tonnes whereas the total consumption for the same period was 545 tonnes. Thus, the balance of raw material in the silo on the night of November 15 was (620-545) or 75 tonnes. On November 16, 60 tonnes of material was consumed, thus the balance after November 16 should be (75-60) or 15 tonnes. Without the traceability software, only the total quantity is known. On the other hand, the software allows the determination of the quantity of different types of materials in the same silo. The purchase index shows the order of purchase. The higher the index is, the more recent the purchase is.

Table 1. List of purchases

Supplier

Purchase date

Quantity

tonne Purchase Index

X1 01-Nov-12 100 1

X2 03-Nov-12 150 2

X3 06-Nov-12 200 3

X4 07-Nov-12 120 4

X5 12-Nov-12 50 5

Table 2. List of consumptions Consumption date Quantity, tonne

02-Nov-12 30

03-Nov-12 35

04-Nov-12 60

05-Nov-12 40

08-Nov-12 80

13-Nov-12 300

16-Nov-12 60

(3)

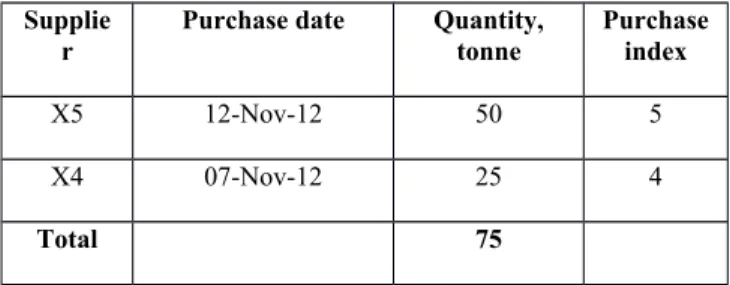
Table 3 lists the details of material present for mass flow type silo at the end of November 15. This table shows that in the mass flow type silo, at the end of November 15, 25 tonnes of raw material of purchase index 4 stays at the bottom, and 50 tonnes of raw material of purchase index 5 stays on top. The dates corresponding to the two purchase indices show that the raw material corresponding to purchase index 4 was purchased before the one with purchase index 5. As for the mass flow type silo, the material that enters first leaves the silo first (FIFO); thus on November 16, material corresponding to purchase index 4 will be consumed first. When all the material of purchase index 4 is consumed, material corresponding to purchase index 5 will be consumed. On November 16, 60 tonnes of raw material were consumed. Thus 25 tonnes of purchase index 4 material was consumed first followed by 35 tonnes of purchase index 5 material. The consignments corresponding to the raw material (60 tonnes) used for the mass flow type silo is shown in Table 4 on November 16. After the consumption, 15 tonnes of purchase index 5 material will remain in the silo.

Table 3. List of available raw material at the end of November 15 for the mass flow type silo

Supplie

r Purchase date Quantity,

tonne Purchase index

X5 12-Nov-12 50 5

X4 07-Nov-12 25 4

Total 75

Table 4. Composition of raw material used on November 16, 2012 for the mass flow type silo

Supplie

r Purchase date Quantity,

tonne Purchase index

X4 07-Nov-12 25 4

X5 12-Nov-12 35 5

Total 60

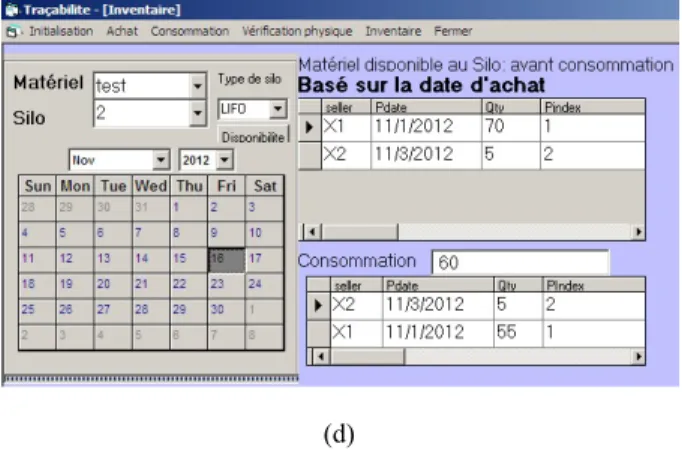
Similarly, Table 5 lists the details of material present for the funnel flow type silo on the night of November 15. Table 5 shows that at the end of November 15, 70 tonnes of raw material of purchase index 1 and 5 tonnes of material of purchase index 2 stay in the funnel flow type silo. In a funnel flow type silo, the material that enters last leaves the silo first (LIFO); thus, on November 16, material corresponding to purchase index 2 will be consumed followed by the material of purchase index 1. On November 16, 60 tonnes of raw material were consumed. Thus, 5 tonnes of purchase index 2 material was consumed followed by 55 tonnes of purchase index 1 material. The consignments corresponding to the raw material (60 tonnes) used for the funnel flow type silo is shown in Table 6 on November16. Thus, the material remaining in the silo will be 15 tonnes of purchase index 1.

It may be noted that, in both silos, the raw material remaining after the consumption on 16 November was 15 tonnes. However,

in the case of mass flow type silo, the material remained had purchase index 5 whereas for funnel flow type silo, it had purchase index 1. Here lies the advantage of the software on traceability from the industrial viewpoint. For example, for any type of silo used, if there is any problem in anode quality due to raw material on November 17, it will be easy for the plant to identify the property of the raw material that caused the problem since the type of raw material used in anode production can be determined from the predictions of this software. This will help plant personnel take preventive measures to maintain anode quality and reduce loss due to rejections.

Table 5. List of available raw materials at the end of November 15 for the funnel flow type silo

Supplier Purchase date Quantity,

tonne Purchase index

X1 01-Nov-12 70 1

X2 03-Nov-12 5 2

Total 75

Table 6. Composition of raw material used on November 16, 2012 for the funnel flow type silo

Supplie

r Purchase date Quantity,

tonne Purchase index

X2 03-Nov-12 5 2

X1 01-Nov-12 55 1

Total 60

Tables 4 and 6 clearly show that the composition of raw materials used on November 16, 2012 for the two types of silos are completely different. This also helps correlate the properties of the raw materials with the baked anode properties.

It is difficult to validate the data using the silos in the anode plant.

Thus during the maintenance and cleaning of the silos in the anode plant of Alouette inc. the types of flow of the silos were determined using a consignment of high sulfur coke and it was observed that some of the silos were of mass flow type and the others were of funnel flow type.

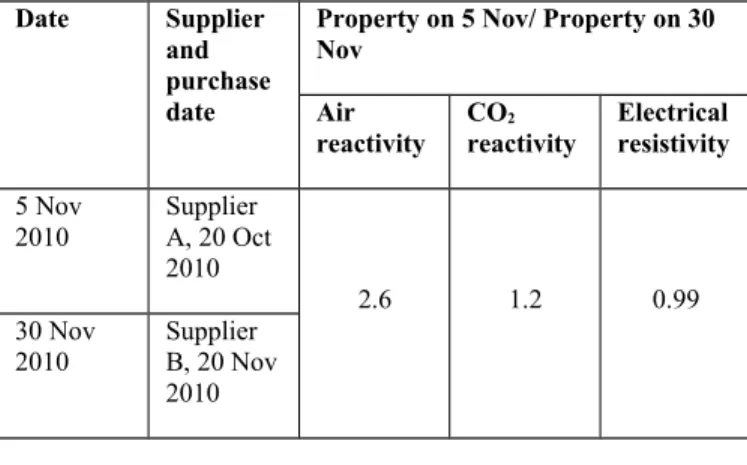
The following example shows an industrial application of the

traceability software. In the month of November 2010 the baked

anodes produced on 5 and 30 November under similar conditions

differed a lot in terms of reactivity though the electrical

resistivities were nearly the same. It was found using the software

that the suppliers were completely different on those two days and

the cokes were known to be quite different in terms of physical

and chemical properties. The coke of supplier A has lower

porosity compared to that for the supplier B. Also pitch wets less

the coke supplied by supplier A. Table 7 shows the difference in

the properties of anodes on the two dates. For the same quantity of

pitch (The ratio of pitch for the two days was 0.99) less pitch

(4)

could enter into the pores of the coke of supplier A and more pitch stayed in the space between the particles. This pitch after cokification became more exposed to the air or CO

2

during the reactivity studies. Thus traceability software can justify the cause of high reactivity of the anode produced on 5 Nov 2010 compared to that produced on 30 Nov 2010. As electrical resistivity is a function of quantity of pitch, extent of coke-pitch mixing and baking conditions, it did not differ much for the anodes produced on the two dates.

Table 7. Comparison of variation in property with variation in raw material

Date Supplier and purchase date

Property on 5 Nov/ Property on 30 Nov

Air reactivity

CO

2

reactivity

Electrical resistivity 5 Nov

2010

Supplier A, 20 Oct 2010

2.6 1.2 0.99

30 Nov

2010 Supplier

B, 20 Nov 2010

Conclusions

This article presents an approach to trace back the details of raw materials used with a custom-made software. The software takes into account the type (mass flow or funnel flow) of silos. Such tracking can help identify the causes of problems and maintain/improve anode quality. An example demonstrating the utility of the software is presented and discussed.

Acknowledgements

The technical and financial support of Aluminerie Alouette Inc. as well as the financial support of the National Science and Engineering Research Council of Canada (NSERC), Développement économique Sept-Îles, the University of Québec at Chicoutimi(UQAC), and the Foundation of the University of Québec at Chicoutimi(FUQAC)are greatly appreciated.

References

[1] D. Kocaefe, A.Sarkar, S. Das, S. Amrani, D. Bhattacharyay, D. Sarkar, Y. Kocaefe, B. Morais, M. Gagnon, Review of Different Techniques to Study the Interactions between Coke and Pitch in Anode Manufacturing, TMS Light Metals, Texus, USA,

John Wiley & Sons, March, 2013,

DOI: 10.1002/9781118663189.ch176

[2] J.Chmelar, Size reduction and specification of granular petrol coke with respect to chemical and physical properties.

Dissertation, Norwegian University of Science and Technology,2006.

[3] D.Bhattacharyay, D. Kocaefe, Y. Kocaefe, B.Morrais, M.Gagnon, Application of the Artificial neural network (ANN) in predicting anode properties, TMS Light Metals, Texus, USA,

John Wiley & Sons, March, 2013,

DOI: 10.1002/9781118663189.ch201

[4] K.Grudzien, E. Maire, J.Adrien, D. Sankowski, Analysis of Funnel Flow in Rectangular Silo based on ECT Data, Automatyka, 2010, 681-694.

[5] Z. Chanaicci, T. Dyakowski, M. Niedostatkiewicz, D.

Sankowski, Application of electrical capacitance tomography for bulk solids flow analysis in silos. Particle and Particle Systems Characterization, 23(3-4),2006,306-312.

[6] K. Grudzien, A. Romanowski, R.A. Williams, Application of a Bayesian approach to the tomographic analysis of hopper flow.Particle and Particle Systems Characterization, 22(4),2005,246-253.

[7] M. Niedostatkiewicz, J. Tejejman, Z. Chaniecki, K. Grudzien, Determination of Bulk Solid concentration changes during granular flow in a model silo with ECT sensors, Chemical Engineering Science, 64(1), 2009, 20-30.

[8] D. Schulze, Powders and Bulk Solids: Behavior, Characterization, Storage and Flow, Springer, New york, 2007, pp.290.

[9] J. P. L. Neto, J.W. B. do Nascimento, R. C. Silva; C. A. da Costa, Powder flow criteria for design of vertical silo walls, Eng.Agríc.,33(3), 2013,http://dx.doi.org/10.1590/S0100-

69162013000300003

[10] R.L. Carr, Evaluating the Flow Properties of Solids, Chem, Eng.,1965, 163-168

[11] M. Rhodes, Storage and Flow of Powders – Hopper Design, in Introduction to Particle Technology, Second Edition, John Wiley & Sons, Ltd, Chichester, UK. ,2008

doi: 10.1002/9780470727102.ch10, pp 99-112

[12] J. Tejchman, Confined Granular Flow in Silos: Experimental

and Numerical Investigations, Springer, New York, 2013

(5)

Figure 2. Algorithm for the mass flow type silo Figure 3. Algorithm for the funnel flow type silo Insert purchase date, quantity and purchase index into

temporary_table where purchase date<=current date using purchase_table

Find minimum (purchase_date) from temporary_table

No. of days = current date – minimum(purchase date)

Counter=0

Date for calculation =minimum (purchase date) + counter

No. of days = current date – minimum (purchase date)

Select minimum (purchase index) MnPI where date <=

Date for calculation

Select consumption C from consumption_table where date <= Date for calculation

Select quantity Q from temporary_table where purchase index = MnPI

Is Q>C?

Update Q =Q-C in temporary_table where purchase index

= MnPI

Is No of days<

Counter?

Yes

No Display contents of temporary_table

Stop

No C=C-Q

Delete row from temporary_table where purchase index=MnPI

Counter =Counter + 1 Start

Yes Yes

Insert purchase date, quantity and purchase index into temporary_table where purchase date<=current date using purchase_table

Find minimum (purchase_date) from temporary_table

No. of days = current date – minimum(purchase date)

Counter=0

Date for calculation =minimum (purchase date) + counter

No. of days = current date – minimum (purchase date)

Select maximum (purchase index) MxPI where date <=

Date for calculation

Select consumption C from consumption_table where date <= Date for calculation

Select quantity Q from temporary_table where purchase index = MxPI

Is Q>C?

Update Q =Q-C in temporary_table where purchase index

= MxPI

Is No of days <

Counter?

Yes

No Display contents of temporary_table

Stop

No C=C-Q

Delete row from temporary_table where purchase index=MxPI

Counter =Counter + 1

Start

(6)

(a)

(b)

(c)

(d)

Figure 4. The interface of the software for the traceability study

(a) Purchase details, (b) Consumption details, (c) Inventory for

funnel-flow type silo, and (d) Inventory for mass-flow type silo.

Figure

Figure 1. Two types of silos: (a) Mass flow (b) Funnel flow     Tables   1   and   2   show   the   lists   of   purchases   made   and consumptions   occurred   in   the   month   of   November   2012, respectively
Table 3. List of available raw material at the end of November 15 for the mass flow type silo
Table 7. Comparison of variation in property with variation in raw material
Figure 2. Algorithm for the mass flow type silo Figure 3. Algorithm for the funnel flow type siloInsert purchase date, quantity and purchase index into
+2

Références

Documents relatifs

The conclusion drawn is that, provided farmers receive ample technical supervision, support for budded planting material production on farms, by using a collective budwood garden,

[15] Selon ces résultats obtenus, des anodes de laboratoire ont été fabriquées et caractérisées dans cette étude afin de déterminer l’effet de l’ajout d’un brai modifié

La principale difficulté est alors que, si l’étude des mobiles se prête bien à l’étude des distances à un point marqué dans une carte aléatoire, elle semble à première vue

The cross-CoI collaboration on the re-design of the “Limits” c-book was organized in the following five phases: (1) a part of the French CoI, acting as the primary designers,

L’archive ouverte pluridisciplinaire HAL, est destinée au dépôt et à la diffusion de documents scientifiques de niveau recherche, publiés ou non, émanant des

In microsatellite analysis, moderate genetic diversity values were found for Madagascar, together with low mean number of alleles ranging from 2.47 to 3.88 compared to South

A multi-layered custom feed-forward artificial neural network model with back propagation was developed to predict the values of τ as the dependent parameter using

Two lithic assemblages - coming from the base of the Proto-Aurignacian layer (Unit G) and from the top of the semi sterile Unit H - located in the east sector (1959 excavation) of the