HAL Id: hal-00866424
https://hal.archives-ouvertes.fr/hal-00866424
Preprint submitted on 30 Sep 2013
HAL is a multi-disciplinary open access archive for the deposit and dissemination of sci-entific research documents, whether they are pub-lished or not. The documents may come from teaching and research institutions in France or abroad, or from public or private research centers.
L’archive ouverte pluridisciplinaire HAL, est destinée au dépôt et à la diffusion de documents scientifiques de niveau recherche, publiés ou non, émanant des établissements d’enseignement et de recherche français ou étrangers, des laboratoires publics ou privés.
Comparing and combining energy saving policies : Will
proposed residential sector policies meet French official
targets ?
Louis-Gaëtan Giraudet, Céline Guivarch, Philippe Quirion
To cite this version:
Louis-Gaëtan Giraudet, Céline Guivarch, Philippe Quirion. Comparing and combining energy saving policies : Will proposed residential sector policies meet French official targets ?. 2011. �hal-00866424�
C.I.R.E.D.
Centre International de Recherches sur l'Environnement et le Développement
UMR
8568
CNRS
/
EHESS
/
ENPC
/
ENGREF
/
CIRAD /
M
ETEOF
RANCE45 bis, avenue de la Belle Gabrielle
F-94736 Nogent sur Marne CEDEX
Tel : (33) 1 43 94 73 73 / Fax : (33) 1 43 94 73 70
www.centre-cired.fr
DOCUMENTS DE TRAVAIL / WORKING PAPERS
No 34-2011
Comparing and combining energy saving
policies : will proposed residential sector
policies meet French official targets?
Louis-Gaëtan Giraudet
Céline Guivarch
Philippe Quirion
July 2011
Comparing and combining energy saving policies : will proposed residential sector policies meet French official targets?
Abstract
This paper assesses the impact of French policies for residential space-heating energy consumption, both enacted (tax credits for the purchase of energy efficient durables, soft loans for retrofitting actions, stringent building codes) and anticipated (carbon tax, retrofitting obligation). It uses a hybrid energy-economy model incorporating specific features of energy conservation, notably the rebound effect and some “barriers” to energy efficiency such as split incentives and imperfect information. Forward-looking simulations show that (i) stand-alone policies improve the energy efficiency of the building stock but, with the exception of carbon tax, generate a rebound effect; (ii) interactions among instruments are roughly additive; (iii) a combination of all policies fails to meet Government conservation targets.
Keywords : Energy conservation, Tax, Subsidy, Regulation, Policy interaction, Residential heating.
-
Comparaison et combinaison des politiques d’économies d’énergie : les politiques proposées dans le secteur résidentiel permettent-elles d’atteindre les objectifs français d’économies
d’énergie ?
Résumé
Cette étude évalue l’impact des politiques existantes (crédits d'impôt pour l'achat de biens énergétiquement efficaces, éco-prêt à taux zéro pour la rénovation énergétique, réglementation thermique) et supplémentaires (taxe carbone, obligation de rénovation énergétique) sur la consommation résidentielle d'énergie pour le chauffage en France. Elle utilise un modèle hybride énergie-économie intégrant des déterminants spécifiques de la consommation d’énergie, comme l’effet rebond et certaines barrières à l’efficacité énergétique telles que l’information imparfaite ou le « dilemme propriétaire-locataire ». Les simulations prospectives montrent que (i) pris séparément, tous les instruments améliorent l’efficacité énergétique du parc de logements, mais, à l’exception de la taxe carbone, induisent un effet rebond ; (ii) les interactions entre instruments sont globalement additives ; (iii) la combinaison de toutes ces politiques ne permet pas d’atteindre les objectifs officiels d’économies d’énergie.
Mots-clés : maîtrise de l’énergie, taxe, subvention, réglementation, interaction des politiques,
chauffage des bâtiments.
5
Comparing and combining energy
saving policies
Will proposed residential sector policies meet French
official targets?
Louis-Gaëtan Giraudeta,b,*, Céline Guivarcha,b, Philippe Quirionc,b
As of February 21, 2001
Forthcoming in The Energy Journal, Special Issue EMF25
Abstract
This paper assesses the impact of French policies for residential space-heating energy consumption, both enacted (tax credits for the purchase of energy efficient durables, soft loans for retrofitting actions, stringent building codes) and anticipated (carbon tax, retrofitting obligation). It uses a hybrid energy-economy model incorporating specific features of energy conservation, notably the rebound effect and some “barriers” to energy efficiency such as split incentives and imperfect information. Forward-looking simulations show that (i) stand-alone policies improve the energy efficiency of the building stock but, with the exception of carbon tax, generate a rebound effect; (ii) interactions among instruments are roughly additive; (iii) a combination of all policies fails to meet Government conservation targets.
Keywords
Energy conservation, Tax, Subsidy, Regulation, Policy interaction, Residential heating
a
Ecole des Ponts ParisTech
b
Centre international de recherche sur l’environnement et le développement (CIRED)
c
Centre national de la recherche scientifique (CNRS)
* Corresponding author : CIRED, 45 bis avenue de la Belle Gabrielle, F-94736 Nogent sur Marne Cedex. Tel : +331.43.94.73.62. E-mail : giraudet@centre-cired.fr
6
1. Introduction
Analysis of residential buildings suggests both increasing energy demand and a large techno-economic potential for energy savings and carbon dioxide emissions cuts (Levine et al., 2007), but private energy consumption and investment decisions do not necessarily maximize net social benefits. Two reasons are generally noted: first, energy consumption generates negative externalities, including global warming, and second, the energy efficiency gap or paradox (Jaffe and Stavins, 1994; Sanstad and Howarth, 1994) which is caused by “barriers”, such as imperfect information, split incentives or bounded rationality, leads to an under-provision of energy efficient durables, despite their long-term profitability (Sorrell et al., 2004; Gillingham et al., 2009).
This provides justification for public intervention, but policy instruments must be implemented appropriately. First, according to Levine et al. (2007, p.390), “these barriers are especially strong and diverse in the residential and commercial sectors; therefore, overcoming them is only possible through a diverse portfolio of policy instruments (high agreement, medium evidence)”. This is the application of the “Tinbergen rule” to energy conservation1. Indeed, it is known that standard instruments, such as taxes, subsidies or regulations, are not equally well suited ceteris paribus to different policy goals (Goulder and Parry, 2008; Gillingham et al., 2009). Second, energy efficiency improvements (be they autonomous or caused by energy efficiency policies) are usually followed by
energy sufficiency relaxation, i.e. increased utilization of energy consuming capital (Alcott, 2008). The
resulting discrepancy between effective energy savings and the savings theoretically achievable under a constant utilization assumption is referred to as the direct rebound effect (Sorrell et al., 2009). Third, the joint implementation of multiple instruments can lead to interactions that augment or diminish overall policy outcomes (Bennear and Stavins, 2007; OECD, 2007). As a result, there is neither one outstanding single instrument, nor a ready recipe for combining instruments. In the case of policies for energy conservation, a broad ex ante evaluation is required with a careful examination of stand-alone and multiple policies, and the specific determinants of energy efficiency and sufficiency.
Although poorly investigated by the economic literature, policy combination has been routinely used in practice (Bennear and Stavins, 2007). France provides an interesting example in the field of energy conservation. The Grenelle de l’environnement, a collective consultation held in 2007, set sectoral targets to combat climate change, including a 38% reduction in energy consumption in existing buildings between 2008 and 20202. Since then, pre-existing tax credits for the purchase of energy efficient durables have been strengthened, zero rate loans for retrofitting have been provided to the household sector, and building codes for new constructions have been revised to set more stringent requirements in 2012 and 2020. In addition, a carbon tax was passed by Parliament in December 2009, but was then cancelled by the Conseil constitutionnel, the High Court that checks whether new
1 Formally, the Tinbergen rule states that for each and every policy target there must be at least one policy tool
(Tinbergen, 1952; Knudson, 2009).
2
Loi n° 2009-967 du 3 août 2009 de programmation relative à la mise en œuvre du Grenelle de
l'environnement, Article 5. Although the energy unit is not specified yet, it is likely to refer to the specific
7
laws conform to the Constitution. The tax proposal exempted industrial installations covered by the European Union Emission Trading System (E.U. ETS) which, according to the Conseil constitutionnel, violated the principle of equality before tax, since ETS allowances are freely allocated. The Government has decided not to submit any new proposal, but a carbon or carbon-energy tax is still proposed by some stakeholders. Lastly, growing attention is being paid to a retrofitting obligation. To date, very few forward-looking studies have evaluated the impact of these proposals.
This paper investigates whether French residential targets are achievable with the proposed policy mix, and evaluates alternative means for achieving them. This case study also provides insights into such general questions as: How do policy instruments rank in terms of energy savings? What is their
impact on the specific determinants of energy conservation? To what extent does policy combination bring additive savings? The simulation model Res-IRF is used for this purpose. It is designed to handle
technological and behavioral specificities in the household sector, consistent with the IMACLIM general equilibrium framework3. It focuses on energy consumption for space heating whichcovers 66% of energy demand in the French household sector.
The remainder of this paper is organized as follows. Section 2 provides an overview of Res-IRF. Section 3 details the practical implementation of policy instruments and their representation in Res-IRF. Section 4 compares the outcomes of stand-alone policies. Section 5 assesses different combinations of proposed and hypothetical measures, stressing policy interaction. Section 6 concludes.
2. Overview of the Res-IRF model
Res-IRF builds on a discrete-continuous representation of energy consumption, linking choice of discrete energy efficiency option to continuous adjustments of energy sufficiency (Dubin and McFadden, 1984). According to identity (1), the energy demand for space heating Efin (in
kilowatt-hour per year, kWh/y) can be seen as a product of the building stock S (in square meters, m²), the specific consumption under conventional utilization assumptions Econv/S (in kWh/m²/y) which is an
inverse proxy for the energy efficiency of the stock, and the ratio between conventional and final consumption Efin/Econv , representing a dimensionless “service factor” or utilization rate of the
heating infrastructure. fin conv fin conv
E
E
E
S
S
E
(1)3 Res-IRF stands for the residential module of IMACLIM-R France. IMACLIM is a general equilibrium framework
developed at CIRED. IMACLIM-R is a hybrid model linking recursively IMACLIM general equilibrium to technological simulation modules. The national version of IMACLIM-R represents France as a small open economy. Exhaustive descriptions of IMACLIM-R and Res-IRF can be found in Sassi et al. (2010) and Giraudet et
8
2.1
Technological representation of the building stock
Res-IRF describes the dynamics of the French residential building stock through the construction of new dwellings and the retrofitting of existing ones. The dwelling stock S is disaggregated by energy carrier (electricity, gas, fuel oil) and by efficiency class, as labeled by the French energy performance certificate (MEEDDAT, 2008). No explicit technologies are represented, but implicit packages of measures on the building envelope (insulation, glazing) and the heating system that together achieve discrete levels of energy efficiency Econv/S. The performance of existing stock, prior to the calibration
year 2007 (hereafter the “existing building stock”), ranges from class G, the least efficient (over 450 kWh/m²/y of primary energy for heating, cooling and hot water) to class A, the most efficient (below 50 kWh/m²/y of primary energy). Each year, demand for new construction arises from demolition, population growth, and a demand for increased floor surface per capita. The performance of buildings constructed from 2008 onwards (hereafter the “new building stock”) is split into three categories: the ‘BC05’ or Building Code 2005 level (from 250 to 120 kWh/m²/y of primary energy, depending on the local climate), ‘LE’ or Low Energy buildings (50 kWh/m²/y) and ‘ZE’ or Zero Energy buildings, for which primary energy consumption is lower than the renewable energy they can produce.
2.2
Drivers of energy conservation
In existing dwellings, energy efficiency improvements result from investment that upgrades existing dwellings to higher energy classes (e.g. from G to F,...,A; from F to E,...,A; etc.), as well as from fuel substitution. As in some other models (e.g. CIMS, NEMS), such transitions are determined by logit functions, which allocate to each option a share inversely proportional to its life cycle cost, weighting investment cost against lifetime-discounted energy operating expenditures. In addition, Res-IRF endogenizes the retrofitting rate and enriches this framework with market and behavioral failures4 that have been empirically established. Heterogeneous discount rates are used to catch the ‘landlord-tenant dilemma’ (IEA, 2007), which splits incentives between four types of investors: occupying or non-occupying homeowners of individual or collective dwellings. Imperfect information is emphasized through the calibration of “intangible costs” that fill the gap between observed technology choices and choices that would be made under perfect information (Jaccard and Dennis, 2006). The gap is narrowed in the long-run by a decreasing function of intangible costs with cumulative knowledge, representing information acceleration or the “neighbor effect” (Mau et al., 2008; Axsen et al., 2009). The annual number of retrofits is a logistic function of the average net present value of all retrofitting options (including intangible costs), calibrated at the reference year so as to (i) reproduce the observed retrofitting rate and (ii) minimize the weight of negative net present values. In new constructions, one single type of investor more simply chooses one option among nine combinations of potential energy carriers and energy efficiency levels.
As pictured in figure 1, the final energy demand is adjusted by a logistic curve linking the service factor Efin/Econv to the annual fuel bill at current energy prices, given by the new efficiency of the
4
Market failures such as liquidity constraints, split incentives or imperfect information are assumed to blur cost-minimizing investment decisions, whereas behavioural failures such as bounded rationality move investment decisions away from cost-minimization (Gillingham et al., 2009).
9
building stock Econv/S resulting from more numerous and/or efficient retrofits. This relationship is
established empirically by Cayre et al. (2011) following empirical specification in Haas et al. (1998). It states that the higher (lower) the energy expenditure, the more (less) restrictive the utilization, i.e. sufficiency strengthening (relaxation).
Figure 1: Sufficiency curve. Adapted from Cayre et al. (2011) with indicative location of efficiency classes at 2008 average energy price
Overall, energy efficiency improvements (i.e. increased quantity and/or quality - the ambition - of retrofits) result from changes in the relative profitability of various retrofitting options, induced by energy price increase and sustained by retrofitting cost decrease. The latter follows the self-reinforcing process of information acceleration on the demand side, and learning-by-doing on the supply side (Wing, 2006; Gillingham et al., 2008). This evolution is countervailed by the natural exhaustion of the potential for profitable retrofitting actions. From a broader perspective, sufficiency relaxation provides further negative feedback to energy efficiency improvements. Lastly, the recursive hybridization of Res-IRF to IMACLIM-R France ensures macroeconomic consistency (Crassous et al., 2006; Hourcade et al., 2006). At each time step, the IMACLIM general equilibrium provides households’ disposable income and energy prices. These inputs modify energy investment and consumption decisions in Res-IRF, which in turn provides IMACLIM with a new demand for energy and investment in the following period. The domestic energy prices used throughout this paper (figure 2) are determined by an exogenous world oil price scenario that matches the Annual Energy Outlook 2008 scenario used in the other EMF25 simulations in this issue.
10
Figure 2: Energy price scenario
3. Implementation of the proposed policy mix in Res-IRF
Albeit a matter of French concern for about thirty years (Martin et al., 1998; Leray and de La Roncière, 2002), energy conservation has attracted renewed attention with the emergence of climate change issues. The 2005 Energy Law5 sets a national target of reducing total greenhouse gas emissions (GHG) to a quarter of their 1990 level by 2050. New policies, such as tax credits, have been implemented in the household sector. More recently, the Grenelle de l’environnement has set the ambitious target of reducing energy consumption in buildings by 38% in 2020 compared to 2008, and has defined additional policy tools. The present section reviews proposed policies and the way in which they are represented in the model.
3.1
Tax credits on energy efficient durables
The purchase of energy efficient durables, such as double glazing, insulation, efficient boilers or heat-pumps, is eligible for income tax credits, with rates ranging from 15 to 50% of investment cost. This scheme was started in 2005 and grew until, in 2008, it benefited 1.6 million households to the tune of €2.8 billion and an equivalent subsidy rate of 32% (INSEE, 2010). Eligible technologies and subsidy rates were modified in 2009 and the base extended to cover installation expenditures. As such, the scheme has been extended to 2012 and could possibly run until 2020.
5
11
Since limited tax credits existed in the calibration year of the model (2007), they are included in the reference scenario. Additional credits from increased rates and the extended base are modeled from 2009 until 2020, through a uniform rebate of 30% of investment cost for all transitions to higher energy classes, capped at €8,000 per dwelling. Tax credits are ultimately paid as a lump-sum to households.
3.2
Zero rate loans for retrofitting actions
Zero percent interest rates apply for retrofit packages over a base capped at €30,000 per dwelling, for a maximum period of ten years. This can be additional to tax credits but requires a combination of measures on both building envelope and heating system. Launched in 2009, the scheme has benefited 80,000 households in the first year, for average investments of €16,500 per dwelling (SGFGAS, 2010). It is supposed to benefit 800,000 households in 2012 and to last until 2020 (MEEDDM, 2010).
Zero rate loans are implemented in the model as rebates equal to the interest on a conventional ten-year loan at 4%. For example, a €15,000 retrofit would benefit from a €3,490 rebate, provided that the beneficiary paid €1,500 for each of ten annuities, instead of €1,849 under a conventional loan. The base for calculation is total investment costs, net of tax credits and capped at €30,000 per dwelling. It applies to all energy class transitions, assuming that the combination requirement is met when a dwelling is upgraded by at least one energy class.
3.3
Building code regulation for new buildings
Building code regulations have been applied to new residential buildings in France since 1975 and regular tightening has had a traceable impact on the efficiency of the stock (Martin et al., 1998). One of the broadest agreements of the Grenelle de l’environnement has been to set future requirements at ambitious levels. Ruled so far by Building Code 2005, new constructions will have to conform to Low Energy level in 2012 (50 kWh/m²/y of primary energy for heating, cooling, hot water and ventilation) and to Zero Energy level in 2020. Albeit still negligible, the construction of Low Energy buildings is growing very rapidly (MEEDDM, 2010) in anticipation of the 2012 regulation. Successive regulations are implemented in Res-IRF as a restriction of energy efficiency options in logit choices6.
3.4
Retrofitting obligation
The principle of an obligation to retrofit existing dwellings has been proposed by the non-profit organization négaWatt (Salomon et al., 2005) and was discussed during the Grenelle de
l’environnement (Pelletier, 2008, p.86). The implementation of this measure in Res-IRF assumes that
for every change in dwelling occupancy, homeowners whose dwelling is below a certain energy performance threshold, must upgrade it. The retrofitting rate of dwellings that are below the performance threshold is forced to match occupancy change cycles, estimated to affect 3.5% of owner-occupied dwellings and 18% of rented dwellings annually, i. e. on average 7% of the total stock (CGDD, 2009). Retrofitting choices for these dwellings are restricted to options above the
6
This work has been conducted prior to the signature of a decree stating that the regulation will come into force in residential dwellings on January 1, 2013 (décret n° 2010‐1269 du 26 octobre 2010 relatif aux
caractéristiques thermiques et à la performance énergétique des constructions). In addition, the decree allows
12
threshold. In addition to mandatory retrofits, business as usual endogenous retrofits are still taken into account, net from the retrofits that usually follow changes in occupancy7.
The performance threshold is set at class C (below 150 kWh/m²/y of primary energy). A reasonable assumption is that the obligation will be phased in to avoid bottlenecks on the supply side and high control costs. Accordingly, the obligation is placed on class G dwellings in 2016, on class F dwellings in 2020, on class E dwellings in 2024 and finally on class D dwellings in 2028.
3.5
Carbon tax
Two successive Government reports have investigated the French social value of carbon (Boiteux and Baumstark, 2001; Quinet et al., 2008). Through modeling exercises, the Quinet report has established a CO2 price trajectory that would meet the E.U. GHG commitment. The CO2 tax implemented in
Res-IRF follows this recommendation. It is set at €32 per ton of CO2 in 2010, increases annually by 5.8%
until 2030 and by 4% afterwards, thus reaching €217/tCO2 in 2050. Its revenues are rebated as a
lump-sum to households, as in the proposal accepted by Parliament. While ex tax energy prices are myopically expected, the tax is perfectly expected. CO2 emissions from electricity production are not
taxed but electricity consumption is taxed based on the assumption of 180 gCO2/kWh, as was the case in the 2000 French carbon-energy tax proposal8.
Figure 3: Summary of policy parameters
7
Such overlaps represent around 27% of annual retrofits, according to data from OPEN (2009).
8
13
Note that these five instruments can be ordered in three classes: subsidies that lower upfront cost (tax credits and soft loans), taxes that increase energy-related operating costs and regulations that restrict efficiency choices (building code and retrofitting obligation).
4. Stand-alone policy comparison
The primary purpose of this paper is to assess the extent to which enacted and proposed policies contribute to the achievement of national abatement targets, namely, a 38% reduction in energy consumption in existing buildings between 2008 and 2020, and a 75% reduction of total CO2
emissions in 2050 compared to 1990. Admittedly, these targets apply to more sectors and uses than those addressed by the model. Yet aggregate targets are unlikely to be reached if they are not met on the residential space heating perimeter, as this is recognized as having the largest potential for energy conservation for the lowest cost (Baudry and Osso, 2007). Given the specificity of the French electricity generation mix, as developed in annex 2, only direct emissions from the consumption of natural gas and fuel oil for space heating are considered9. In addition, the same table provides the
absolute electricity consumption for every scenario, so that the reader can compute indirect emissions, assuming a given CO2 intensity of power generation
The following assessment emphasizes policy effectiveness, i.e. the quantification of energy savings achieved by policies with respect to targets. Drivers of effectiveness are broken down into energy efficiency improvements and sufficiency effects. Efficiency improvements are further split into the number and quality of retrofits. Sufficiency is examined through service factor trajectories and the rebound effect is assessed as an absolute rebound effect for each scenario, including the reference, and as a policy-induced rebound effect10. The dynamic efficiency of policy instruments is also assessed by their impact on investment costs through learning-by-doing. All simulations assume constant climate, and numerical results are disclosed in tables 1 and 2.
4.1
Overview of the reference case
Before detailing policy results, it is worth briefly analyzing the reference case. Table 1 and figure 4 show that the reference scenario generates few final energy savings in 2020 and 2050 compared to 2008. Table 2 reveals a significant fuel switch, mainly from fuel oil to electricity, leading to a net increase in primary energy. The low CO2 emission cuts in 2050 compared to 1990 can be explained by
a 17% increase in CO2 emissions between 1990 and 2008 (CITEPA, 2010).
9
More generally, direct CO2 emissions and primary energy consumption are deduced from final energy, which
is the main output of Res-IRF using conventional assumptions regarding the French energy supply system (see annex 1, table A2).
10 The rebound effect is approximated by the growth rate of the service factor compared to a reference
situation: Δ(Efin/Econv)/(Efin/Econv) ≈ (ΔEfin/Efin)/( ΔEconv/Econv). This can be seen as the elasticity of energy demand
to an efficiency term, which is the genuine way of defining the rebound effect (Sorrell et al., 2009). The
absolute rebound effect compares each scenario at the time considered to the 2008 situation: the policy-induced rebound effect compares policy scenarios to the reference scenario.
14
Evolution of primary energy, including rebound, compared to 2008 Evolution of final energy, over the total stock, compared to 2008
Specific consumption in existing buildings
Specific consumption in new buildings
Specific consumption in the total stock
Total consumption in the total stock
Specific consumption, including rebound Total consumption, including rebound Total consumption, excluding rebound 2020 2050 2020 2050 2020 2050 2020 2050 2020 2050 2020 2050 2020 2050 Benchmark objective -38%
Ref Reference scenario -8.1% -19.5% -0.6% -1.7% -11.3% -23.0% 1.2% 5.2% -15.6% -34.2% -3.6% -10.0% -11.4% -33.4%
Single policies
C Tax credits -9.2% -20.7% -0.6% -1.7% -12.3% -23.8% 0.2% 4.2% -16.6% -34.8% -4.8% -10.9% -13.8% -34.9%
L Zero rate loans -9.0% -20.4% -0.6% -1.7% -12.0% -23.6% 0.4% 4.4% -16.4% -34.7% -4.5% -10.7% -13.2% -34.6%
R Building code regulation -8.1% -19.5% -44.6% -78.7% -16.9% -44.0% -5.0% -23.4% -19.7% -49.7% -8.3% -31.2% -14.0% -44.6%
T Carbon tax -14.5% -35.2% -4.4% -15.9% -17.1% -36.7% -5.3% -13.5% -22.9% -50.1% -11.9% -31.8% -13.6% -38.0% O Retrofitting obligation -10.7% -29.1% -0.6% -1.7% -13.5% -29.1% -1.2% -3.0% -17.6% -39.5% -5.9% -17.3% -14.6% -48.7% Proposed packages E Combination of C,L,R -10.3% -22.1% -44.6% -78.7% -18.7% -45.6% -7.1% -25.6% -21.6% -50.9% -10.5% -32.9% -18.6% -47.5% S1 CLR enriched with T -16.9% -37.3% -46.4% -81.0% -24.4% -55.8% -13.7% -39.5% -28.9% -62.7% -18.8% -49.1% -21.8% -51.5% S2 CLR enriched with O -12.7% -31.0% -44.6% -78.7% -20.6% -51.2% -9.4% -33.3% -23.3% -55.8% -12.5% -39.5% -21.5% -61.2%
S3 CLR enriched with T and O -19.3% -43.8% -46.4% -81.0% -26.3% -59.8% -15.9% -45.0% -30.6% -67.0% -20.7% -54.8% -24.4% -63.8%
Ambitious packages
A S3 with aggressive T -36.9% -67.0% -56.4% -89.0% -42.2% -76.4% -34.0% -67.8% -51.2% -82.3% -44.3% -75.8% -37.5% -72.3%
A+ A with extended C and L -36.9% -68.1% -56.4% -89.0% -42.2% -77.1% -34.0% -68.8% -51.2% -83.2% -44.3% -77.1% -37.5% -75.1%
A++ A+ with aggressive O -36.9% -69.3% -56.4% -89.0% -42.2% -77.9% -34.0% -69.8% -51.2% -84.4% -44.3% -78.7% -37.5% -79.0%
15
Evolution of fuel share in final energy consumption (in percentage points)
Direct CO2 emissions compared to 1990 Electricity consumption in TWh (in 2008: 58.0 TWh) Rebound effect Electricity (share 2008: 23%) Natural gas (share 2008: 53%) Fuel oil (share 2008: 24%) Absolute Policy-induced 2020 2050 2020 2050 2020 2050 2020 2050 2020 2050 2020 2050 2020 2050 Benchmark objective -75%
Ref Reference scenario 4.4 14.6 0.5 0.7 -4.8 -15.3 5.0% -18.6% 66.5 85.6 8.8% 35.1% - -
Single policies
C Tax credits 4.5 14.5 0.7 0.8 -5.2 -15.4 3.5% -19.3% 66.1 84.6 10.5% 37.0% 1.6% 1.4%
L Zero rate loans 4.4 14.5 0.6 0.8 -5.1 -15.4 3.9% -19.1% 66.2 84.8 10.1% 36.5% 1.2% 1.1%
R Building code regulation 3.1 9.8 0.7 2.6 -3.8 -12.4 1.9% -32.4% 60.4 57.0 6.5% 24.2% -2.1% -8.0%
T Carbon tax 6.4 23.1 -0.6 -8.2 -5.8 -14.9 -6.9% -46.1% 65.5 79.7 2.0% 10.0% -6.3% -18.6% O Retrofitting obligation 4.3 14.8 0.9 2.8 -5.2 -17.6 2.5% -26.2% 64.8 79.1 10.2% 61.3% 1.3% 19.4% Proposed packages E Combination of C,L,R 3.2 9.4 1.2 2.9 -4.4 -12.3 -0.9% -33.7% 59.3 54.9 10.0% 27.8% 1.1% -5.4% S1 CLR enriched with T 5.4 16.2 0.6 -4.3 -6.0 -11.9 -13.1% -54.3% 58.3 50.5 3.8% 5.0% -4.6% -22.3% S2 CLR enriched with O 3.1 8.9 1.6 5.6 -4.7 -14.5 -3.0% -40.4% 50.1 41.2 11.5% 56.0% 2.4% 15.5%
S3 CLR enriched with T and O 5.3 18.7 1.0 -4.2 -6.2 -14.5 -15.1% -61.5% 56.6 47.7 4.9% 24.8% -3.6% -7.6%
Ambitious packages
A S3 with aggressive T 15.9 28.5 -5.9 -13.6 -9.9 -15.0 -49.3% -82.7% 54.8 31.6 -10.9% -12.8% -18.1% -35.4%
A+ A with extended C and L 15.9 31.3 -5.9 -15.3 -9.9 -16.0 -49.3% -84.5% 54.8 31.5 -10.9% -8.0% -18.1% -31.9%
A++ A+ with aggressive O 15.9 35.9 -5.9 -19.1 -9.9 -16.8 -49.3% -87.0% 54.8 31.8 -10.8% 1.4% -18.1% -24.9%
16
The slight decrease in final energy consumption and CO2 emissions results from the combination of a
decrease in specific consumption and emissions, and an increase in the building stock. In 2050, the total housing floor space is expected to be 37% larger than in 2008. Note that 62% of this stock is made up of buildings already in existence in 2007 so that retrofitting issues are crucially important. Despite an increase in stock, consumption and emissions would decrease significantly, assuming the service factor remains the same, i.e. without sufficiency relaxation. It turns out that the service factor increases in the reference scenario (figure 5). At the end of the time frame, what is referred to as the “absolute rebound effect” reaches 35% (table 2), which is at the high-end of rebound effect estimates collected for space heating by Sorrell et al. (2009). Note that the energy price scenario used is quite stable (cf. figure 2) and does not strengthen sufficiency.
4.2
Policy ranking
With respect to the implementation of stand-alone policies, figure 4 and tables 1 and 2 allow the instruments to be ranked according to their effectiveness in achieving the targets. Tax credits and soft loans generate the weakest energy savings, notably because they have the shortest duration. Compared to the reference, they increase the number of retrofits whilst they are in place (figure 6). They also improve the quality of retrofits, as indicated by the decrease of “inefficient” classes (G to D) and the increase of more “efficient” classes (C to A) (figure 7). The resulting energy efficiency improvements generate a small policy-induced rebound effect (table 2) by a service factor higher than in the reference case, as illustrated on figure 5.
The retrofitting obligation ranks next. Each tightening of the obligation to a higher efficiency class is followed by a tremendous increase in retrofitting rate11, automatically followed by an equally tremendous exhaustion of the potential for profitable retrofits. This explains the switchback time profile of the retrofitting rate shown in figure 6, as well as the massive decrease in investment costs in response to learning-by-doing depicted in figure 8. However, such an increase in retrofitting may also face supply side bottlenecks resulting in higher investment costs in the short-term. Such processes are not included in the model but, nevertheless, the building stock structure is dramatically impacted by restricting efficiency choices to the best options (figure 7). This tool appears especially effective in addressing the landlord-tenant dilemma, as illustrated by the large disappearance of classes G, F and E. Because of high discount rates, rented dwellings are poorly retrofitted in reference, as well as in subsidy cases, but the obligation forces the retrofitting of all type of dwellings. It actually applies more often to rented dwellings where occupancy changes are more frequent. However, those higher energy efficiency improvements are partly cancelled out by the largest rebound effect of all policies (table2) because the obligation threshold lies in the steepest part of the service factor curve (cf. figure 1).
The two highest ranking policies, namely building codes and the carbon tax, last the longest and affect sufficiency strengthening in the same direction. However, a closer look at energy conservation
11
Each year a new efficiency class becomes subject to the obligation, it is as if the retrofitting rate surged from the reference value of 1% to 7%, which corresponds to the average rate of occupancy change.
17
Figure 4: Stand-alone policy impact on final energy consumption for space heating
18
Figure 6: Stand-alone policy impact on the retrofitting rate
19
Figure 8: Stand-alone policy impact on retrofitting costs through learning-by-doing
20
drivers shows different mechanisms. The carbon tax slightly increases the retrofitting rate over the whole time frame, but has a smaller effect than subsidies (figure 6). Consequently, it entails a lower decrease in investment costs through learning-by-doing, as long as both types of instrument coexist (figure 8). It improves, however, the ambition of the retrofits, so that its final impact on the efficiency of existing dwellings is comparable to that of subsidies (figure 7). Its effect on the structure of new building stock is tenuous compared to the reference case (figure 9) because of a low weight of energy operating expenditures against construction costs. Lastly, the carbon tax generates a massive switch from fossil fuels to electricity (table 2) which, in France, has a low average CO2
intensity (see annex 2). In response to those modest energy efficiency improvements, the potential fuel bill alleviation (i.e. shift to the left of the service factor curve, cf. figure 1) is more than compensated by the energy price increase (i.e. to the right), thus lessening sufficiency relaxation and lowering the rebound effect compared to the reference scenario.
Building codes have the opposite effect. They turn out to be the only means to significantly increase the efficiency of new building stock. This is followed by a counter-intuitive sufficiency strengthening (figure 5) due to a composition effect between new and existing building stocks. To explain this, let f be the total service factor, fe (fn) the service factor specific to the existing (new) building stock and she
(shn) the share of existing (new) buildings in total conventional energy demand. The total service
factor can be written as the weighted average of specific factors (see annex 1 for expansion):
e e n n
f
sh f
sh f
(2)Figure 10 depicts the evolution of fn and shn in the reference and building code cases. Building codes
do relax the service factor specific to new buildings in the wake of efficiency improvements. However, they also reduce the share of new buildings in total energy demand compared to the reference scenario, energy consumption in very efficient constructions being close to zero. As a result, the net effect of the relative increase in fn and the relative decrease in shnwith building codes
compared to the reference case is negative, thus lowering the total service factor.
In conclusion, some general insights can be drawn. (i) Financial incentives, such as taxes and subsidies that change relative life-cycle costs, are less effective than regulations in improving energy efficiency12. (ii) Taxes tend to be dynamically less efficient than subsidies regarding learning-by-doing. (iii) Policies that raise energy efficiency without directly affecting energy prices, such as subsidies and regulations, induce rebound effect. Conversely, the carbon tax has a virtuous effect on both energy efficiency and sufficiency. This is in line with results from more stylized models (e.g. Giraudet and Quirion, 2008).
12
Of course, this conclusion holds only for the tax rates, subsidy levels and retrofitting policies simulated here and not in general.
21
Figure 10: Sufficiency effects in new dwellings (see equation 2)
5. Policy combination analysis
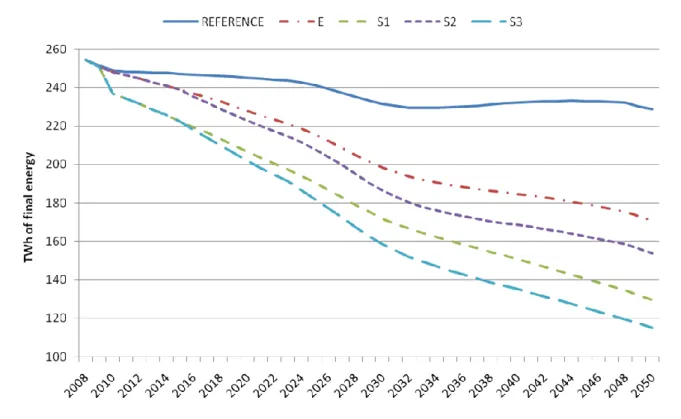
In practice, two of the instruments modeled are already in place, one has been partly enacted and two are under discussion. To account for different levels of implementation likelihood, four policy combinations are run. The first package is restricted to “existing” policies whose implementation is effective or certain, namely tax credits, soft loans and building codes (scenario ‘E’). Subsequent hypothetical scenarios add supplementary measures, such as the carbon tax (‘S1’), the retrofitting obligation (‘S2’), and both (‘S3’). Combination outcomes are portrayed in figure 11.
5.1
Most likely policy package
The basic ‘E’ package saves 10.3% of specific primary energy consumption in existing dwellings in 2020 compared to 2008, and 33.7% of direct CO2 emissions in 2050 compared to 1990; this is far
from the saving targets of 38% and 75% respectively. The specific primary energy savings accruing from the package (net from reference savings, thus 2.2 percentage points) exceed by 0.2 pp the sum of the separate savings from the two subsidies (idem, thus 1.1 pp and 0.9 pp) in existing dwellings in 2020. This indicates that combined savings are slightly larger than the sum of separate savings, i.e. interactions between tax credits and soft loans are slightly over-additive or, as defined by Boonekamp (2006), reinforcing.
Saving drivers are broken down to further analyze this outcome. Figure 13 shows that the retrofitting rate increase compared to the reference is roughly the sum of separate increases induced by tax
22
credits and soft loans in figure 6. A closer look shows that the final increase is slightly over-additive. This is due to the non-linear valuation of net present value of retrofitting projects (thanks to a logistic curve, as introduced in section 2). The addition of two subsidies lowers life-cycle costs, thus increasing the net present value of the average retrofitting project. As a result, the retrofitting rate rises more than proportionally. Together with a qualitative shift towards best energy classes, the building stock turns out to be very efficient in 2050 with combined policies. As a consequence, package ‘E’ induces a larger rebound effect than the sum of separate policies. This is hardly visible by comparing the ‘E’ service factor curve on figure 12 to the curves for separate policies on figure 5, but it is confirmed by numerical examination.
5.2
Other hypothetical policy packages
Adding a carbon tax and a retrofitting obligation to this basic package provides further energy savings (figure 11), but even the all-inclusive package ‘S3’ meets neither the 2020 nor the 2050 target. The comparison of ‘S3’ final energy savings in 2050 (net from ‘E’ savings) to the sum of ‘S1’ (idem) and ‘S2’ savings (idem), shows a mitigating interaction between the carbon tax and the retrofitting obligation (figure 16). This interaction is of larger magnitude than in the one previously analyzed, and underpins different mechanisms.
As can be seen in figures 13 and 14, the impacts of scenarios ‘S3’ and ‘S2’ are very similar on the retrofitting rate and the structure of the existing stock in 2050. This suggests that between the carbon tax and the retrofitting obligation, the latter is the main driver of energy efficiency improvements. The carbon tax slightly moves energy efficiency choices towards the best options, as attested by the more numerous dwellings labeled A, B and C in scenario ‘S3’ than in ‘S2’. Note that these energy performance classes stand in a domain where the service factor reaches a high plateau or, put another way, where the rebound effect saturates (cf. figure 1). As a result, figure 12 suggests that the net effect of policy combination on the service factor is strengthening and driven by the carbon tax, provided that the ‘S3’ curve is always closer to ‘S1’ than to ‘S2’. However, this reinforcing effect of the carbon tax on sufficiency does not compensate for the fact that efficiency gains accruing from scenario ‘S3’ are seemingly lower than the sum of the gains from scenarios ‘S1’ and ‘S2’. For instance, it is clear that the disappearance of the inefficient class E in ‘S3’ is not as large as the additive effect of ‘S1’ and ‘S2’ would suggest (figure 14).
5.3
Ambitious scenarios to meet national targets
According to the preceding positive assessment, policy packages, as they are officially defined, fall short of meeting national targets, despite some reinforcing interactions. This provides grounds for a normative investigation of more aggressive measures.
First, an effective tax is sought through iterative doubling of the initial tax rate within the ‘S3’ package. As attested by figure 17, rate increase has a marginally decreasing effect which can be explained by the saturation of the energy service factor at the high-end of the energy classes, thus preventing tax from further strengthening sufficiency. Eventually, a tax whose 2010 rate is six times higher than the initial one reduces energy consumption by 38% in 2020 compared to 2008. This is captured by the ‘A’ scenario, which builds on ‘S3’ and sets the tax at the initial rate of €200/tCO2
23
Figure 11: Combined policy impact on final energy consumption for heating
24
Figure 13: Combined policy impact on the retrofitting rate
25
Figure 15: Combined policy impact on the efficiency of new dwellings in 2050
26
Figure 17: Gains in specific primary energy in existing dwellings in 2020 compared to 2008
27
Figure 19: Impact of ambitious packages on the efficiency of new dwellings in 2050
28
Two additional “ambitious” scenarios are run to bring heating consumption closer to the 2050 target. Scenario ‘A+’ builds on ‘A’ and extends subsidies to 2050, while in addition, scenario ‘A++’ sets the retrofitting obligation threshold at class B (applied incrementally from class G dwellings in 2016 to class C dwellings in 2032). Results in figure 18 show that each policy strengthening further moves retrofitting choices towards classes B and A at the expense of other classes. Similar conclusions hold for the new building stock, as attested by figure 19. In turn, each policy strengthening increases the energy service factor over the 2030-2050 period (figure 20). Such packages allow CO2 emissions to be
reduced to a quarter of their 1990 levels by 2050 (table 2).
6. Conclusion
This paper assesses the effectiveness of various policy options that target energy consumption in the French residential sector. In particular, it analyses whether various policy packages are able to meet the ambitious targets set by the French public authorities for CO2 emissions and energy consumption.
It uses a hybrid energy-economy model that incorporates specific features of energy conservation, especially the rebound effect and some “barriers” to energy efficiency such as split incentives and imperfect information. Barriers are progressively overcome through information acceleration and learning-by-doing, leading to adoption externalities, but those endogenous dynamics are countervailed by the natural exhaustion of the potential for energy saving and the rebound effect. The policy packages that are assessed combine subsidies (tax credits and zero rate loans), regulations (building codes and retrofitting obligations) and carbon taxes. Overall, the model unambiguously establishes that they fall short of reducing energy consumption by 38% in 2020 compared to 2008, and they fail to reduce CO2 emissions due to space heating in residential buildings to a quarter of
their 1990 level by 2050. Such a pessimistic result calls for methodological discussion of unaccounted effects and scenario definition.
One possibility for reducing CO2 emissions is a switch from fossil fuels to wood. The inclusion of this
option would require complex linkage with a model of the French forest to represent the limited supply of wood. Another reason for the pessimistic result lies in scenario definition. Price scenarios adopted for electricity, natural gas and fuel oil are quite stable and obviously lead to poor energy savings in the reference case. Finally, policy scenarios concentrate on instruments that fit stylized representations of subsidies, regulations and taxes, but omit complementary measures, such as information campaigns, energy performance contracts, new contracts where retrofitting costs are shared between owners and occupants of rented dwellings, and the obligation put on energy companies to promote energy savings with flexibility options, i.e. the trading of so-called “white certificates”. The switch to wood, higher (before tax) energy prices and these complimentary policy options might make it possible to meet French national targets, but it is likely that less ambitious packages would fail. This means that a rapid strengthening of climate policy is required. In particular, the importance of the rebound effect suggests that policies specifically targeting sufficiency should accompany the more common energy efficiency policies. This could be achieved by giving households feedback about their energy savings, proven to be very effective, especially when a comparison with other households is provided (Abrahamse et al., 2005; Ayres et al., 2009).
29
Theoretical insights can also be drawn from this case study. The most salient result regarding stand-alone policies is the virtuous effect of a carbon tax on both energy efficiency and sufficiency. On policy combination, the analysis of policy interactions exhibits reinforcing effects of tax credits and soft loans, and mitigating effects of carbon taxes and retrofitting obligations. Yet such effects are tenuous and depend upon the specific architecture of the model and the numerical settings of policy parameters. Hence, a more systematic mapping of policy interaction with varying parameters would be needed to provide robust insights. Still, these illustrative examples suggest that fine policy
coordination is needed (Bennear and Stavins, 2007). In particular, policy-makers should pay attention
to setting policies efficiently, i.e. in domains where a marginal variation of the main policy parameter induces a more than proportional saving variation (Knudson, 2009). This potentially influences the mitigating or reinforcing nature of any interactions.
Lastly, a comprehensive policy evaluation requires a quantification of the monetary costs and benefits of energy conservation. Further room for improvement would be the assessment of the distributive impact of the various policy options across income groups. This could be achieved in the future from forthcoming developments of the Res-IRF model on both the demand and supply side.
Acknowledgements
We are indebted to Benoît Allibe for data support. We thank Hill Huntington and the participants to the Energy Modeling Forum 25, which fostered the course of this study. We also thank anonymous referees, as well as Ruben Bibas, Dominique Finon and participants to the 10th European Conference of the International Association for Energy Economics, held in Vienna, September 2009, and to the International Energy Workshop, held in Stockholm, June 2010, for useful comments on earlier versions of this work. This work has been partly funded by the French General Commission for Sustainable Development (Commissariat général au développement durable). We are grateful to Jean-Jacques Becker, Lucile Penot-Antoniou and Olivier Teissier for providing policy guidelines and useful comments.
30
Annex 1: Technical complements
Expansion of Equation (2)
Let f be the total service factor, Efin the final energy consumption and Econv the energy consumed
under normalized utilization assumption. Indexes n and e refer to the new and existing building stocks, respectively. The general expression of the service factor fin
conv E f E can be developed as n e fin fin n e conv conv
E
E
f
E
E
, or n n e e conv conv n e conv conv E f E f f E E . Now, let sh ibe the share of stock i in the total
conventional consumption: i i conv conv E sh
E . The total service factor can thus be written as:
e e n n
f sh f sh f
Table A1: Main assumptions of the Res-IRF model
Discount rates 7% for new constructions. 7% and 10% (35% and 40%) for (non) occupying homeowners of individual and collective existing dwellings, respectively
Initial retrofitting rate 1% of the 2007 building stock is assumed to make at least one energy class transition (based on OPEN, 2009)
Information acceleration rate Intangible cost decrease by 25% for every doubling of the cumulative retrofits, following a logistic curve.
Learning-by-doing rate Investment cost decrease by 10% for every doubling of the cumulative retrofits in existing buildings and by 15% for every doubling of
cumulative constructions in new buildings, following a power curve Theoretical lifetime of energy
efficiency investments
35 years for measures targeting the envelope, 20 years for measures targeting the heating system
Table A2: Conventional assumptions of the French energy supply system
Conversion factor of electricity into primary energy
2.58 kWh of primary energy for each kWh of final electricity (MEEDDAT, 2008)
Direct emissions from final energy consumption 271 gCO2/kWh for fuel oil (ADEME, 2008) 206 gCO2/kWh for natural gas (ADEME, 2008)
31
Annex 2: Electricity generation in France
In France, almost 90% of the electricity produced is generated by technologies avoiding direct CO2
emissions, i.e. nuclear power (75% in 2009), hydroelectricity and other renewable energies (13%). The rest (11%) is provided by fossil fuels, mostly coal. This specific situation in the European landscape of electricity generation gives rise to important debate about how to evaluate the carbon content of French electricity. So far, two methodologies have been put forward. The historical
average carbon content allocates a share of domestic emissions from the electricity generation
process to each end-use according to its seasonal time-of-use, whereas the marginal content evaluates changes in the generation mix induced by marginal variation of electricity demand. Indeed, most of the time, some fossil fuel thermal plants are in operation and since they incur the highest variable cost, they are switched on or off in priority when electricity demand fluctuates. Applied to space heating, which contributes a lot to winter peak demand, the first method yields 180 grams of CO2 emitted per kilowatt-hour of final electricity consumed (ADEME and EDF, 2005) while the second
yields 500-600 gCO2/ kWh (ADEME and RTE, 2007).
The assumption of average carbon content has some advantages that could justify its use in Res-IRF. First, it reproduces fairly well the CO2 emissions at the initial year. Second, it is well suited to the
representation of electricity generation that prevails in IMACLIM-R France, assuming a total disconnection from the unrepresented European energy system. However, it turns out to be inappropriate as soon as changes in electricity consumption are considered. The marginal carbon content assumption is seemingly more appropriate for that task, but it can only be applied to marginal variations in electricity demand, thus preventing investigation of long-term changes in the generation mix. Moreover, it does not allow the calibration of CO2 emissions at the initial year.
For these reasons, the simulations undertaken in this paper do not display indirect CO2 emissions
arising from the generation of electricity consumed for space heating. This issue will be addressed in the future by linking Res-IRF to an explicit module of electricity generation within the IMACLIM-R France framework. In the absence of such sophisticated modeling, the only effect that can be anticipated from the general reduction in electricity consumption for space heating in the short-term is that French fossil-fired electricity imports will decrease, and so will CO2 emissions in their country
32
References
Abrahamse, W., L. Steg, C. Vlek, T. Rothengatter (2005). “A review of intervention studies aimed at household energy conservation.” Journal of Environmental Psychology, 25(3):273–291
ADEME *Agence de l’environnement et de la maîtrise de l’énergie+, EDF (2005). Note de cadrage sur le contenu CO2 du kWh par usage en France
ADEME *Agence de l’environnement et de la maîtrise de l’énergie+, RTE *Réseau de transport d’électricité+ (2007). Le contenu en CO2 du kWh électrique : Avantages comparés du contenu marginal et du contenu par usages sur la base de l’historique. Note détaillée
ADEME *Agence de l’environnement et de la maîtrise de l’énergie+ (2008). Les chiffres clé du
bâtiment
Alcott, B. (2008). “The sufficiency strategy: Would rich-world frugality lower environmental impact?”
Ecological Economics, 64(4): 770-786
Cayre, E., B. Allibe, M.-H. Laurent, D. Osso (2011). “There are people in the house!: How misleading for energy policies are the results of purely technical analysis of residential energy consumption.”
Proceedings of the ECEEE Summer Study, Paper 7-277, forthcoming
Axsen, J., D. C. Mountain, M. Jaccard (2009). “Combining stated and revealed choice research to simulate the neighbor effect: The case of hybrid-electric vehicles.” Resource and Energy Economics, 31(3): 221-238
Ayres, I., S. Raseman, A. Shih (2009). “Evidence from Two Large Field Experiments that Peer Comparison Feedback Can Reduce Residential Energy Usage.” NBER Working Paper, No. 15386 Baudry, P., D. Osso (2007). “Uncertainties in the evaluation of energy savings potential.” Proceedings
of the ECEEE summer study, 583-588
Bennear, L.S., R.N. Stavins (2007). “Second-best theory and the use of multiple policy instruments.”
Environmental and Resource Economics, 37(1):111-129
Boiteux, M., L. Baumstark (2001). Transports : choix des investissements et coûts des nuisances. Rapport pour le Commissariat général au plan, La Documentation française, 2001
Boonekamp, P.G.M. (2006). “Actual interaction effects between policy measures for energy efficiency – A qualitative matrix method and quantitative simulation results for households.” Energy, 31(14):2848-2873
CGDD [Commissariat général au développement durable] (2009). « La mobilité résidentielle progresse dans le parc locatif privé et diminue dans le parc social. » Observation et Statistiques, n°27
33
CITEPA *Centre Interprofessionnel Technique d’Etudes de la Pollution Atmosphérique] (2010).
Rapport national d’inventaire pour la France au titre de la convention cadre des Nations Unies sur les changements climatiques et du Protocole de Kyoto
Crassous, R., J.-C. Hourcade, O. Sassi (2006). “Endogenous Structural Change and Climate Targets Modeling Experiments with Imaclim-R.” The Energy Journal, Special Issue: Endogenous Technological Change and the Economics of Atmospheric Stabilisation, 259-276
Dubin, J.A., D.L. McFadden (1984). “An Econometric Analysis of Residential Electric Appliance Holdings and Consumption.” Econometrica, 52(2):345-362
Gillingham, K., Newell, W.A. Pizer (2008). “Modeling endogenous technological change for climate policy analysis.“ Energy Economics, 30(6): 2734-2753
Gillingham, K., R. Newell, K. Palmer (2009). “Energy Efficiency economics and policy.” Annual Review
of Resource Economics, 1:597–619
Giraudet L.-G., P. Quirion (2008). “Efficiency and distributional impacts of tradable white certificates compared to taxes, subsidies and regulations.” Revue d’économie politique, 119(6): 885-914
Giraudet, L.-G., C. Guivarch, P. Quirion (2011). “Exploring the potential for energy conservation in French households through hybrid modeling.” CIRED working paper DT/WP No 2011-26.
Goulder L. H., I.W.H. Parry (2008). “Instrument choice in environmental policy.” Review of
Environmental Economics and Policy, 2(2):152-174
Haas, R., H. Auer, P. Biermayr (1998). “The impact of consumer behavior on residential energy demand for space heating.” Energy and Buildings, 27(2):109-205
Hourcade, J.-C., M. Jaccard, C. Bataille, F. Ghersi (2006). “Hybrid Modeling: new answers to old challenges.” The Energy Journal, Special issue 2: Hybrid Modeling of Energy Environment Policies, 1-12
IEA [International Energy Agency] (2007). Mind the gap: Quantifying principal-agent problems in
energy efficiency. Paris
INSEE [Institut national de la statistique et des études économiques] (2010). « Le recours au crédit d’impôt en faveur du développement durable : Une résidence principale sur sept rénovées entre 2005 et 2008. » INSEE PREMIERE, n°1089
Jaccard, M., M. Dennis (2006) “Estimating home energy decision parameters for a hybrid energy-economy policy model”, Environmental Modeling and Assessment, 11(2):91-100
Jaffe, A.B., R.N. Stavins (1994). “The energy-efficiency gap: What does it mean?” Energy Policy, 22(10):804-810
Knudson, W.A. (2009). “The Environment, Energy, and the Tinbergen Rule.” Bulletin of Science,
34
Leray, T., B. de la Roncière (2002). 30 ans de maîtrise de l’énergie. Association technique énergie environnement, Arcueil
Levine, M., D. Ürge-Vorsatz, K. Blok, L. Geng, D. Harvey, S. Lang, G. Levermore, A. Mongameli Mehlwana, S. Mirasgedis, A. Novikova, J. Rilling, H. Yoshino (2007). Residential and commercial
buildings. In Climate Change 2007: Mitigation. Contribution of Working Group III to the Fourth
Assessment Report of the Intergovernmental Panel on Climate Change [B. Metz, O.R. Davidson, P.R. Bosch, R. Dave, L.A. Meyer (eds)], Cambridge University Press, Cambridge, United Kingdom and New York, NY, USA.
Martin, Y., Y. Carsalade, J.-P. Leteurtrois, F. Moisan (1998). La maîtrise de l’énergie : rapport
d’évaluation. La Documentation française, Paris
Mau P., J. Eyzaguirre, M. Jaccard, C. Collins-Dodd, K. Tiedemann (2008). “The ‘neighbor effect’: Simulating dynamics in consumer preferences for new vehicle technologies.” Ecological Economics, 68(1-2): 504-516
MEEDDAT *Ministère de l’écologie, de l’énergie, du développement durable et de l’aménagement du territoire] (2008). Le diagnostic de performance énergétique
MEEDDM *Ministère de l’écologie, de l’énergie, du développement durable et de la mer+ (2010). La
fiscalité environnementale prend son essor
OECD [Organisation for Economic Co-operation and Development] (2007). Instrument Mixes for
Environmental Policy. Paris
OPEN *Observatoire permanent de l’amélioration énergétique du logement+ (2009). Rapport final Pelletier, P. (2008). Rapport au Ministre d’Etat, ministre de l’Ecologie, du Développement et de
l’Aménagement durables, Comité opérationnel « rénovation des bâtiments existant »
Quinet, A., L. Baumstark, J. Célestin-Urbain, H. Pouliquen, D. Auverlot, C. Raynard (2008). La valeur
tutélaire du carbone. Rapport de la commission présidée par Alain Quinet, Conseil d’Analyse
Stratégique, La Documentation française, Paris
Salomon, T., C. Couturier, M. Jedliczka, T. Letz and B. Lebot (2005) A negawatt scenario for 2005–
2050. ECEEE 2005 Summer Study proceedings,
http://www.eceee.org/conference_proceedings/eceee/2005c/Panel_1/1113salomon/
Sanstad, A.H., R.B.Howarth (1994). “’Normal’ markets, market imperfections and energy efficiency.”
Energy Policy, 22(10):811-818
Sassi, O., R. Crassous, J.-C. Hourcade, V. Gitz, H. Waisman, C. Guivarch (2010). “IMACLIM-R: a modelling framework to simulate sustainable development pathways.” International Journal of
Global Environmental Issues, 10(1-2):5-24
SGFGAS [Société de gestion du fonds de garantie de l’accession sociale à la propriété+ (2010). Bilan statistique des éco-prêts à taux zéro émis en 2009
35
Sorrell S., E. O’Malley, J. Schleich, S. Scott (2004). The economics of energy efficiency: barriers to
cost-effective investment. Edward Elgar Ed.
Sorrell, S., J. Dimitropoulos, M. Sommerville (2009). “Empirical estimates of the direct rebound effect: A review.” Energy Policy, 37(4):1356-1371
Tinbergen, J. (1952). On the theory of economic policy. Amsterdam: North Holland.
Wing, I.S. (2006). “Representing induced technological change in models for climate policy analysis.”
Energy Economics, 28(5-6):539-562