HAL Id: hal-02959759
https://hal.inrae.fr/hal-02959759
Submitted on 7 Oct 2020
HAL is a multi-disciplinary open access
archive for the deposit and dissemination of
sci-entific research documents, whether they are
pub-lished or not. The documents may come from
teaching and research institutions in France or
abroad, or from public or private research centers.
L’archive ouverte pluridisciplinaire HAL, est
destinée au dépôt et à la diffusion de documents
scientifiques de niveau recherche, publiés ou non,
émanant des établissements d’enseignement et de
recherche français ou étrangers, des laboratoires
publics ou privés.
Distributed under a Creative Commons Attribution - NonCommercial| 4.0 International
License
diversity and fragmentation on insect diversity along
elevational gradients
Niry Dianzinga, Marie-Ludders Moutoussamy, Joëlle Sadeyen, Lala
Ravaomanarivo, Enric Frago
To cite this version:
Niry Dianzinga, Marie-Ludders Moutoussamy, Joëlle Sadeyen, Lala Ravaomanarivo, Enric Frago.
The interacting effect of habitat amount, habitat diversity and fragmentation on insect diversity along
elevational gradients. Journal of Biogeography, Wiley, In press, �10.1111/jbi.13959�. �hal-02959759�
Journal of Biogeography. 2020;00:1–15. wileyonlinelibrary.com/journal/jbi © 2020 John Wiley & Sons Ltd
|
1Received: 13 September 2019
|
Revised: 7 July 2020|
Accepted: 15 July 2020 DOI: 10.1111/jbi.13959R E S E A R C H P A P E R
The interacting effect of habitat amount, habitat diversity and
fragmentation on insect diversity along elevational gradients
Niry T. Dianzinga
1,2| Marie-Ludders Moutoussamy
1| Joëlle Sadeyen
2|
Lala H. R. Ravaomanarivo
3| Enric Frago
1,4,51CIRAD-UMR PVBMT, Saint-Pierre, La Réunion, France
2Université de la Réunion-UMR PVBMT, Saint-Denis, La Réunion, France 3Département d’Entomologie, Faculté des Sciences, Université d’Antananarivo, Antananarivo, Madagascar
4CIRAD, CBGP, Montpellier, France 5CBGP, CIRAD, INRA, IRD, Montpellier SupAgro, University Montpellier, Montpellier, France
Correspondence
Enric Frago, CIRAD/UMR CBGP, 755 avenue du campus Agropolis - CS30016 34988 Montferrier sur lez cedex, France Email: enric.frago@cirad.fr
Funding information
Centre de Coopération Internationale en Recherche Agronomique pour le Développement; European 490 Union (EAFRD and ERDF programs); Regional Council of Reunion; Departmental Council of the Region Reunion; Agence Nationale de la Recherche
Handling Editor: Ole Vetaas
Abstract
Aim: Elevational gradients are a useful approach to evaluate how environmental
fac-tors affect animal diversity. Decades of studies on the elevation-diversity gradient have revealed that this gradient varies greatly with taxa and geographic regions. One potential explanation for this may be the dependence of the relationship on land-scape features. We explore the impact of fragmentation, habitat diversity and habitat amount on insect diversity (alpha and beta) and abundance along elevational gradi-ents. We hypothesize that insect diversity and abundance will relate negatively with elevation, but positively with these landscape features. We also hypothesize that landscape features will interact in a way that the positive effect of a given variable on insect diversity may be offset by the others.
Location: Reunion Island (Indian Ocean). Taxon: The insect order thrips (Thysanoptera).
Methods: Insects were sampled along replicated elevational gradients, and at each
sampling plot landscape features and abiotic variables were estimated within buffers surrounding the site. Insect alpha diversity was estimated using abundance-based rarefaction methods, whereas beta diversity was estimated calculating the "Local contributions to beta diversity" metric. The effect of elevation, rainfall, landscape features and their interactions was assessed on insect alpha and beta diversity and abundance during two consecutive seasons using linear mixed effects models.
Results: We found that thrips alpha and beta diversity was negatively related with
elevation, but the relationship varied between seasons and rainfall regimes. Among the different landscape features considered, we found that habitat amount had the strongest effect on diversity. The effect of habitat amount on diversity, however, was offset in areas of low habitat (or land cover) diversity.
Main conclusions: Generalizing the factors that underlie the elevation diversity
gradi-ent has become a cornerstone in ecological theory because it can help to understand the impact of human activities on diversity. Here we show that taking landscape information into account may help to fulfil this objective because landscape effects co-vary with elevation with often intricate consequences for diversity.
1 | INTRODUCTION
It is nowadays widely accepted that human activities are triggering unprecedented biodiversity losses in most terrestrial ecosystems. Human activities usually have a negative impact on biodiversity by directly degrading and transforming natural habitats, but also indirectly through changes in global climatic conditions (Barnosky et al., 2011; Cardinale et al., 2012; Hooper et al., 2012; Urban, 2015). By comparing diversity across space and assessing its changes in re-lationship with climate, relief and landscape configuration ecologists seek to understand and predict large-scale impacts of human activi-ties on biodiversity. To achieve this, elevational gradients are useful because assemblages of species found at very different conditions can be studied within small geographic distances (Hodkinson, 2005; Sundqvist, Sanders, & Wardle, 2013; Tylianakis & Morris, 2017). Several environmental factors vary with elevation leading to lower plant species richness and structural complexity at higher elevations (Kreft & Jetz, 2007). This elevation-diversity gradient is observed in insects because they are affected by environmental factors too, but also because they tightly depend on plants. This gradient, how-ever, often varies with climatic regions and insect taxa (Chamberlain, Brambilla, Caprio, Pedrini, & Rolando, 2016; McCain, 2009; Sundqvist et al., 2013). Most studies have explored how species rich-ness and evenrich-ness (i.e. alpha diversity) change with elevation, and there is an increasing interest in how species composition (i.e. beta diversity) changes along with these gradients. While alpha diversity expresses net diversity differences among species assemblages, through the lens of beta diversity, differences in the composition of insect assemblages can be assessed, and areas where unique species are found may be pinpointed (Mori, Isbell, & Seidl, 2018; Socolar, Gilroy, Kunin, & Edwards, 2016).
The elevational-diversity gradient was already noticed by Alexander von Humboldt in the 18th century, and since then it has been intensively studied with mixed and often contradictory results. Generalizing the factors underlying this gradient across taxa and geographic regions has become a cornerstone in ecological theory, particularly because it can help to assess and to forecast the im-pact of human activities on diversity (Hodkinson, 2005; Sundqvist et al., 2013; Tylianakis & Morris, 2017). The elevational-diversity gradient varies greatly with taxonomic groups and climatic regions because the impact of elevation on diversity depends on complex interactions among environmental variables and habitat and land-scape characteristics (Chamberlain et al., 2016; McCain, 2009; Sundqvist et al., 2013). This variation also depends on human activi-ties, which are usually greater at lower elevations where human pop-ulations concentrate (Luck, 2007). Landscape features have known impacts on insect diversity and are thus important to understand the elevation-diversity gradient. The most important landscape features
with known impacts on animal diversity are habitat diversity, habitat amount and fragmentation. As revealed in a meta-analysis by Stein, Gerstner, and Kreft (2014), diverse or heterogeneous habitats often contain a larger number of species because they provide a larger range of abiotic conditions, available niches and refuges. These con-ditions ultimately allow species coexistence, reduce extinctions and promote speciation. Habitat diversity has been strongly reduced by human activities particularly due to the homogenizing effect of extensive cropping, forestry and livestock production (Kremen & Merenlender, 2018). Despite the results found in the meta-analy-sis, evidence of negative or neutral effects of habitat diversity on species diversity also exist (Bertrand, Burel, & Baudry, 2016; Marini, Prosser, Klimek, & Marrs, 2008). The effect of habitat amount on diversity, on the other hand, is clearly positive. When the amount of habitat that species can exploit is reduced, species struggle to per-sist because resources are of less quality and less abundant, and be-cause critical resources may be lacking (Samways, McGeoch, & New, 2010). Habitat loss is one of the landscape features most strongly influenced by human activities, and is considered as one of the main drivers of current biodiversity loss (Cardinale et al., 2012; Mantyka-pringle, Martin, & Rhodes, 2012). Fragmentation too affects species diversity, although whether the effect is positive or negative remains a controversial topic. Human activities are important drivers of frag-mentation. Fragmented landscapes are often composed of small patches of natural habitat surrounded by urban, agricultural or tim-ber-producing lands. Most authors consider that fragmentation has a negative effect on species diversity (Fletcher et al., 2018) because it increases the division and isolation of natural habitats thus expos-ing them to disturbexpos-ing human land uses (Haddad et al., 2015). Fahrig (2017, 2019), however, suggests that since habitat fragmentation often comes together with habitat loss, when the amount of habitat available for organisms to exploit is taken into account (an estimate known as fragmentation per se [sensu Haila and Hanski (1984)]), the negative effect of fragmentation is lost. This idea was proposed as the habitat amount hypothesis (Fahrig, 2013) [but see criticism by Fletcher et al. (2018) and Hanski (2015)], where she suggests that habitat amount and fragmentation can be measured independently so that their relative contribution to diversity can be estimated. A meta-analysis that encompasses 35 studies from different locations around the globe has recently provided support for this hypothesis (Watling et al., 2020).
Human impacts on natural habitats vary in intensity with ele-vation, but their effect on different landscape features is often in-tricate. For instance, while most human populations concentrate at lower elevations (Luck, 2007), food, timber and livestock production usually concentrates at particular elevational ranges, with concomi-tant effects on habitat diversity and fragmentation. Even if diversity usually decreases with elevation, speciation and endemism may be
K E Y W O R D S
alpha diversity, beta diversity, elevational gradient, environmental gradient, multi-scale analysis, barcoding, seasonality, insect, thrips, Thysanoptera
larger at high elevations where habitats are more isolated and, in temperate areas, more fragmented due to glacial advances and re-treats (Steinbauer et al., 2016; Vetaas & Grytnes, 2002). In addition, landscape features are usually interconnected. The positive effect of fragmentation on species diversity, for instance, may be linked to habitat diversity because fragmented landscapes are usually more heterogeneous and structurally more complex (Fahrig, 2017). A re-cent theoretical model showed that habitat amount modulated frag-mentation effects on diversity so that fragfrag-mentation effects were positive when the amount of habitat was large, but negative when habitat amount was reduced (Rybicki, Abrego, & Ovaskainen, 2020). In another example, Corcos et al. (2018) found that the diversity of four different insect guilds was affected both by elevation and habitat diversity, but the effect of one variable never modulated the effect of the other. Despite all these recent reports, few stud-ies have so far measured the relative contribution of different land-scape attributes to diversity (Fahrig, 2019; Hanski, 2015), and how they interact with elevation. This knowledge is important to evalu-ate whether diversity changes along elevation are mostly driven by abiotic conditions or the local landscape. Exploring interacting ef-fects among landscape attributes is particularly important to better understand whether the impact of habitat loss may be exacerbated or buffered by changes in habitat diversity or fragmentation. This knowledge may ultimately help better transferring biogeography theory into conservation and management practice.
In this study we explore the relative contribution of elevation, environmental variables and landscape features to Thysanoptera (i.e. thrips) diversity. Thrips are slender insects, of approximately 1 to 3 mm long with about 6.000 extant species described world-wide (Stork, 2018). Thrips larvae can be herbivorous, predatory or
fungivorous, and many species disperse to flowers as adults to feed on pollen or to mate (Mound, 2005). This study was performed in Reunion, a small volcanic island located in the south-western Indian Ocean. Local-landscape characteristics were obtained by estimat-ing habitat diversity, habitat amount and fragmentation usestimat-ing high-ly-resolved vector layers and establishing buffers around sampling points. Habitat diversity was assessed as land cover diversity (Stein et al., 2014), fragmentation as the length of the perimeter of the dif-ferent polygons found within the buffer, and habitat amount as the proportion of potentially suitable habitat within the buffer (Watling et al., 2020). Since insects were sampled from flowers and during two consecutive seasons, the role of the plant, season and rainfall were also taken into consideration. The following hypotheses are tested (Figure 1): (a) We hypothesize that alpha diversity (i.e. species richness and evenness), insect abundance and beta diversity will de-crease with elevation. (b) We hypothesize that habitat amount and habitat diversity will relate positively with insect diversity and abun-dance. Since the proportion of suitable habitat is taken into account in our study, our estimate of fragmentation can be considered as fragmentation per se, and we thus hypothesize that this feature too will relate positively with insect diversity and abundance. (c) We also explore interactions among the different landscape features, and in particular whether the relationship between habitat amount and variables related to insect diversity and abundance is modulated by either habitat diversity or fragmentation. We hypothesize that the positive effect of habitat amount on insect diversity may be offset in low diversity habitats Fragmentation, on the other hand, may have an either positive or negative effect on the relationship between habitat amount and species diversity. The interaction between habi-tat diversity and fragmenhabi-tation may provide a better understanding
F I G U R E 1 Conceptual diagram of the experimental design and variables tested in this study. Arrows point from predictor to response
variables, whereas double-headed arrows indicate interactions between landscape variables. Positive and negative symbols represent our a priori hypotheses on the effect of elevation,landscape features, and their interactions on insect diversity and abundance. Larger positive symbols represent expected stronger effects on diversity and abundance, whereas question marks are shown when no directional hypothesis is proposed. A map of Reunion island with 500m contour lines and the location of transects is also shown.
of whether fragmentation effects operate via changes in habitat diversity.
2 | MATERIALS AND METHODS
2.1 | Study system
In this study, adult insects belonging to the order Thysanoptera (i.e. thrips) were sampled from flowers along replicated elevational gradients that run across different habitat types. Thrips are small insects with about 6.000 extant species (Stork, 2018), and were sampled from flowers because even if larvae can be herbivorous, predatory or fungivorous, many species feed on pollen or disperse to flowers for mating (Mound, 2005). This study was performed in Reunion, which is located at 55°39′ E, 21°00′ S in the south-west of the Indian Ocean between Madagascar and Mauritius with 2,512 km2 of surface. The island has a maximum diameter of 70 km.
Its rugged terrain reaches 3,070 m.a.s.l. and 2,631 m.a.s.l. in the Piton des Neiges and Piton de la Fournaise, respectively. The island has a tropical climate with two seasons: summer and winter. The for-mer occurs from November to April and it is rainy and hot, while the latter occurs from June to September and it is less hot and dryer. Climatic conditions are strongly dependent on the topography and trade winds (i.e. regular ocean winds blowing from East to West). Mean annual rainfall is higher in the eastern part (windward coast) with 1,500 mm to > 8,000 mm, whereas in the western part (lee-ward coast) annual rainfall varies between <500 mm to <1,500 mm. Mean annual temperatures are of 24°C near the coastline, and they can descend to <12°C at 2,000 m.a.s.l. This island is considered a global hot-spot of diversity (IUCN, 2008) and is typified by a high level of endemism, with 46% of its 1.712 species of vascular plants endemic and with eight endemic genera. Among arthropods, it is es-timated that 40% of beetles and 25% of spiders are also endemic (IUCN, 2008). Urbanization and agricultural activities are mostly concentrated below 1,000 m, while the largest proportion of natu-ral habitats (c. 30%) is mostly concentrated above 1,200 m in areas that are less inhabited and often protected under the umbrella of the National Park (Strasberg et al., 2005). As in most tropical islands (Harter et al., 2015; Russell & Kueffer, 2019), the main threats to this biodiversity are global changes, urbanization, agriculture and alien plant invasions, the latter three being particularly important at low elevations (Strasberg et al., 2005).
2.2 | Sampling design and insect collection
Thrips were collected along seven replicated elevational transects (Figure 1). Transects were selected to capture landscape diversity and the different vegetation zones, and to ensure that landscape features varied with elevation but not collinearly. Reunion is a small island, and to avoid higher elevation points to converge, sampling took place below a mid elevation point of 1,600 m. Three transects
reached up to 1,400 m, and four to 1,600 m. Sampling sites were established every 200 m of elevation, these elevational ranges being approximate as sites were selected based on visual detection of abundant plants at the flowering stage. At each site, insects were sampled from all flowering plants in a circular area of 30 m of diame-ter using the beating sheet technique with a rectangular 40 × 30 cm white plastic tray and a mouth aspirator. To standardize sampling effort per plant, each was sampled for 10 min. Usually a single site per season, elevational range and transect was selected, but some-times up to three sites per elevational range were established when few plants in bloom were found. Thrips were sampled in 2017 in summer (January to February, 64 sites) and winter (May to July, 56 sites) (Appendix S1) on sunny, dry and non-windy days from 9 a.m. to 3 p.m. Since most plants only bloom in one of the two seasons, sampling sites were not the same in winter and summer and the two seasons were therefore analysed independently. Sampling was car-ried out by N.T.D., M.-L.M. and E.F. To avoid any sampling bias, at each site sampling of the different plant species was randomly as-signed to one of the three researchers. At each site, latitudinal and longitudinal coordinates were recorded, and elevation was obtained with the R function elevation from the package rgbif version 1.0.2.
In this study the unit of analysis was the assemblage of insects obtained from a given plant. Site was not the unit of analysis because the number of plants (and hence sampling effort) varied between sites. Plant flowers were thus microhabitats from where adults were obtained because even if adults of most species disperse to flowers to feed on pollen, or to mate, their larvae feed on other plant spe-cies, fungi, or on other arthropods (Mound, 2005). Taking the habitat amount hypothesis as an example (Fahrig, 2013), diversity patterns should be studied by exploring "the number of species in a plot of fixed size" and how they vary with "total habitat area in the ‘local landscape’ surrounding the plot”. In our study, flowers represent the plots of fixed size, whereas the information extracted from buffers (see below) represents the local landscape.
2.3 | Morphological and molecular insect
identification
A short description of the methods used to identify insects is provided here, but more details can be found at Appendix S2. Insects were first identified morphologically by N.T.D and a subset of specimens bar-coded to ensure identifications and to detect potential cryptic spe-cies. Based on their abundance and the potential presence of cryptic species [as in Frankliniella schultzei (Tyagi et al., 2017)], a total of 223 specimens representing four known endemic species [Thrips
bour-bonensis, T. candidus, T. quilicii and T. reunionensis n. sp (Goldarazena,
Dianzinga, Frago, Michel, & Reynaud, 2020)] and six species with a global distribution (T. parvispinus, T. florum, Megalurothrips sjostedti,
F. schultzei, Hercinothrips pattersoni and H. gowdeyi) were barcoded.
196 sequences were obtained and new ones imported from NCBI-GenBank (https://www.ncbi.nlm.nih.gov/genba nk/) to build a phy-logenetic tree using the maximum likelihood method. All specimens,
sequenced voucher specimens and their DNA are currently stored at the entomological collections of CIRAD-UMR PVBMT (CIRAD, Saint-Pierre, La Réunion) and at Centre for Biology and Management of Populations (CBGP-INRA, Montpellier/Montferrier-sur-Lez, France).
2.4 | Estimation of landscape features and
environmental variables
Habitat diversity, habitat amount and fragmentation were obtained from five nested circular buffers surrounding sampling sites using a highly-resolved vector layer of Reunion Island land cover map (http:// aware.cirad.fr/layer s/geono de%3Acla ssif_gabir_2016_2017). Vector-layer information was extracted using QGIS Desktop version 2.18.2 and then exported to R. The vector layer used contained nine habitat types: sugar cane, vegetable crops, forest, forest planta-tion, grassland, bare rock, savannah, orchards and urban habitats. Habitat diversity was estimated with the Shannon index as the pro-portional contribution of the nine habitat types within the buffer [i.e. land cover diversity, Stein et al. (2014)] using the function
diver-sity from the package vegan]. Fragmentation was estimated as the
length of the perimeter of the different polygons found within the buffer divided by the total surface of the buffer. Habitat amount was estimated as the proportion of the total surface of the buffer that was considered as habitat, a method recently proposed by Watling et al. (2020). Even if the information provided by land cover data can be complemented with additional site data (Betts et al., 2014) like plant diversity, land cover maps are ideal to capture the habitats potentially used by functionally-diverse animal groups. This is par-ticularly true in this study given the different ecosystems studied, the abrupt landscape of the island, and the variable feeding habits of the insects studied (as explained above). Landscape features consid-ered as non-habitats were urban areas, bare rock or the ocean (this latter case was common in sites located near the coast). Urban zones were not considered as thrips habitats because although some thrips species can be found in ornamental trees, the biomass of vegetation in these areas is usually low. If habitat amount is estimated consider-ing urban zones as habitat, some minor differences are found, but the main results remain similar (results not shown). Environmental variables were obtained for each sampling site and season using the raster layers of average monthly data from 2007 to 2017 in Reunion Island (Météo-France, https://donne espub liques.meteo france.fr/). The data obtained was mean, maximum and minimum annual tem-perature, and accumulated annual rainfall, which was extracted from raster layers using the function raster from the package raster ver-sion 2.7–15.
2.5 | Statistical analyses and multi-scale analysis
We performed all statistical analysis with R software version 3.4.2 using several packages (see R package details in Appendix S3). Alpha
diversity was estimated using abundance-based rarefaction methods to estimate Hill numbers (or effective number of species) and to take into account potential undetected species of thrips (Chao et al., 2014; Chao & Jost, 2012; Colwell et al., 2012; Jost, 2006). Species richness and the Simpson index (i.e. evenness) were estimated as Hill num-bers of order q = 0 and q = 2, respectively, using the iNEXT function from the package iNEXT. The package adespatial was used to assess the ecological uniqueness of each insect assemblage based on their contributions to global beta diversity, by calculating the ‘local contri-butions to beta diversity’ (LCBD) index (Legendre and De Cáceres, 2013). To test the effect of elevation, landscape features, and en-vironmental variables on diversity and abundance estimates, linear mixed effects models were built with a Gaussian error distribution using the function lmer from the package lme4. As explained above, in our study the unit of replication was the thrips obtained in a given plant. We assumed a linear relationship among variables as non-lin-ear relationships were not observed (Appendix S4). An independent model was built for each of the following response variables: spe-cies richness (i.e. number of spespe-cies), the Simpson index (or spespe-cies evenness), beta diversity (the LCBD index), and insect total abun-dance. Given the large variation in environmental conditions during winter and summer, and that different sites were established during these two seasons, independent models were also built for the two different seasons studied. In each model plant identity, elevation, precipitation, fragmentation, habitat diversity, habitat amount, and pairwise interactions between landscape features were included as explanatory variables (Figure 1). As environmental variables, precipi-tation, minimum, mean and maximum temperatures were obtained, but only precipitation was retained in the models as the other vari-ables were highly correlated with elevation (Pearson correlation
R ≥ 0.95, p < 0.001, Appendix S5). Our study does not particularly
focus on plant effects on thrips diversity and abundance, but this variable was included in all models as co-variable to account for this source of variability. Plants that were sampled less than five times during the whole study were considered as a single category (see details on sampled plants in Appendix S6). To account for the spatial autocorrelation between study sites, and for the non-independence of plants sampled in the same site, site nested within transect was included as a random effect. To further correct for any potential spatial autocorrelation a grid of cells of 0.09 × 0.09 decimal degrees was defined over the map. These cells were given a random identity, which was then included as a second random factor to ensure that the potential resemblance between nearby sites is accounted for. To improve model fit and interpretation, all continuous explanatory variables were standardized to mean and standard deviation equal to zero and one, respectively (Harrison et al., 2018). In the models for insect abundance, richness and Simpson diversity, the response variable was log transformed (expressed as log[response + 0.5]) to satisfy model assumptions. In addition, the lmerControl function with the optmizer nloptwrap from the package nloptr was used to im-prove model performance (Bates, Mächler, Bolker, & Walker, 2015). Model fit was assessed by visual inspection of the residuals. In the models for insect richness and evenness, model residuals revealed
slight evidence of non-homogeneity, which was considered as having negligible effects on our model estimates as recently suggested by Schielzeth et al. (2020). The absence of data points with high influ-ence was checked by calculating Cook's distances with the function
CookD from the predictmeans package. Our models did not have any
significant spatial autocorrelation among data points as revealed by the function Moran-I from the ape package. p-values were obtained with a Chi-square test, using the function ANOVA from the pack-age car. Significant results were plotted using the function visreg from the visreg package, which allows plotting partial residuals plots from mixed effects models. The non-linear multidimensional scal-ing (NMDS) was used to visualize how thrips diversity is influenced by elevation, rainfall and landscape features, and also to visualize how specific insect species associate with specific plants or with particular environmental or landscape features. This analysis was performed by transforming data with the Hellinger transformation (Legendre and Anderson, 1999; Legendre and Gallagher, 2001) and using the capscale function from the package vegan version 2.5-1 . Since we had little information on dispersal capabilities of the stud-ied insects, and thus of the scale at which they may be affected by landscape features (i.e. the scale effect), a multi-scale analysis was also performed. As suggested by Fahrig (2013), Jackson and Fahrig (2015) and Watling et al. (2020) this analysis was done by estimat-ing the effect of landscape features usestimat-ing five nested circular buff-ers with five different radii from the centre of each sampling site: 100, 300, 600, 1,000 and 3,000 m. These distances to the centre of the sampling site may represent short and long-distance dispersal of thrips. It is expected that the variance explained by the different landscape features in statistical models is highest for the scale that best fits the home ranges or life dispersal of the species studied. In this analysis, the variance explained by the models was obtained with the function r.squaredGLMM from the package MuMIn, and signifi-cance of a given landscape feature in the different models was tested by comparing simplified and complex models (see more details in the Appendix S12). For the models using the same response and predic-tor variables p-values were corrected for multiple testing using the false discovery rate method. This method is less stringent than other methods like Bonferroni, and is appropriate when a large number of comparisons are performed (Benjamini & Hochberg, 1995).
3 | RESULTS
3.1 | Morphological and molecular identification of
thrips
In this study, 4,280 specimens were collected and 4,261 identi-fied to species level from flowers of 106 different plants: 86 exotic and 20 indigenous belonging to 44 families (Appendix S6). Insects were classified into 40 species, and we were unable to identify to species level 64 individuals (1.5%), which belonged to 19 different morphospecies. Seventeen of these morphospecies were identi-fied to genus level (Appendix S7). The three known endemic species
were well-represented with 1964 Thrips bourbonensis,150 T. quilicii and 114 T. candidus. A total of 329 specimens belonged to a spe-cies newly discovered in this study. This spespe-cies has been named
T. reunionensis n. sp (Goldarazena et al., 2020), and is very similar
morphologically and at the molecular level to T. bourbonensis. Some widespread (and probably exotic) species were also very abundant, including Frankliniella schultzei with 518 individuals, Haplothrips
gowdeyi with 381 individuals, Megalurothrips sjostedti with 199
indi-viduals, and Hercinothrips pattersoni with 198 individuals. Association between plants and particular thrips species can be visualized in the non-linear multidimensional scaling analysis (NMDS, Appendix S8). For example, the newly discovered T. reunionensis (Goldarazena et al., 2020) was associated with the endemic plant Dombeya
ficul-nea, the endemic T. bourbonensis was mostly found at higher
eleva-tions, and the exotic and widespread F. schultzei was mostly found on the exotic plants Lantana camara, Solanum mauritianum and Ipomea
indica. Maximum-likelihood trees (Appendix S9) mostly confirmed
our morphological identifications. The endemic species T.
bourbon-ensis, T. candidus, T. quilicii and T. reunionensis formed different clades,
which were supported by 88, 100, 100 and 100 Ml bootstrap, re-spectively. However, two different evolutionary lineages were found for F. schultzei. Based on previous studies these two lineages were considered as different species and classified based on their col-our (Tyagi et al., 2017). These lineages are known as F. schultzei Ia1, which is close to F. schultzei from India, and F. schultzei IIa1, which is close to F. cf. schultzei/sulphurea from Australia.
3.2 | Landscape changes along elevation and
multi-scale analysis
Transects run from 0 to 1,600 m.a.s.l., and along this gradient im-portant landscape changes were reported (Appendix S10 and S11). The mean proportion of natural forest increased steadily with el-evation from mean values of 25% at low elel-evations to more than 75% above 1,200 m.a.s.l. The proportion of urban areas followed the opposite pattern as low elevation sites were surrounded by landscapes containing between 40% and 50% of urban landscape, but this proportion decreased gradually to less than 10% at higher elevations. Although the mean proportion of sugar cane and of meadows never represented more than 25% of the area surrounding study sites, these two habitat types were important between 500 to 1,200 m.a.s.l. Savannas are common in the west of the island, and represented an average of around 25% at 200 m.a.s.l. The mean proportion of area occupied by orchards was more important at low elevations, but they never represented more than 10% of the area. Other habitat types including forest plantations, vegetable crops or bare rock never occupied more than 5% of the area surrounding study sites (Appendix S10).
The different landscape features measured also changed with elevation without any remarkable difference when estimated using 300 and 1,000 m buffers (Appendix S11). Fragmentation changed with elevation but following a hump pattern that peaked
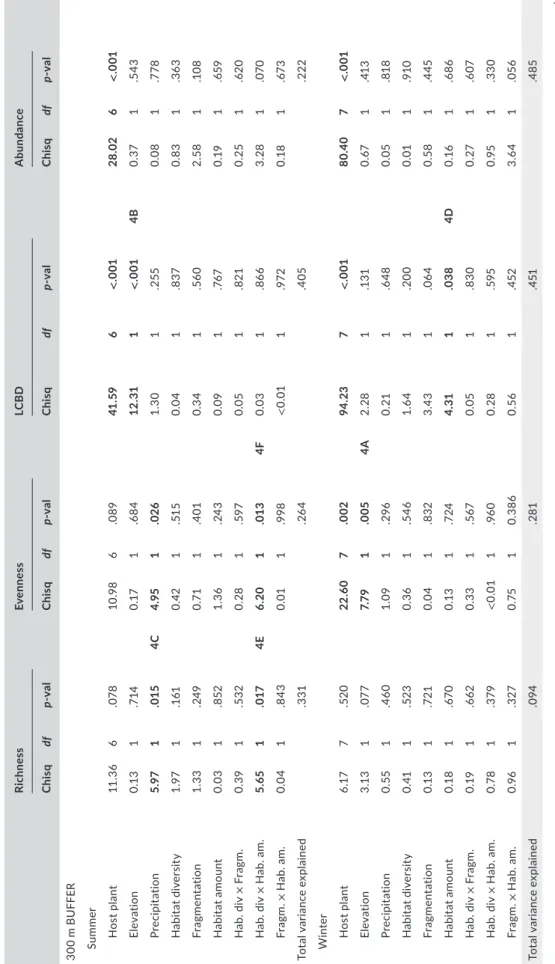
T A B LE 1 Ef fe ct o f e le va tio n, p la nt o f c ol le ct io n, a cc um ul at ed r ai nf al l, h ab ita t d iv er si ty , f ra gm en ta tio n, h ab ita t a m ou nt a nd p ai rw is e i nt er ac tio ns b et w ee n h ab ita t f ea tu re s o n t hr ip s a lp ha di ve rs ity ( sp ec ie s r ic hn es s a nd e ve nn es s) , b et a d iv er si ty ( lo ca l c on tr ib ut io n t o b et a d iv er si ty , L C B D ) a nd a bu nd an ce w he n e xt ra ct in g l an ds ca pe d at a f ro m b uf fe rs o f 3 00 m a nd 1 00 0m o f ra di us . A d iff er en t l in ea r m ixe d e ff ec ts m od el w as b ui lt f or e ac h b uf fe r, a nd d iv er si ty a nd a bu nd an ce e st im at es i n b ot h s um m er a nd w in te r. S ig ni fic an t P -v al ue s a re p re se nt ed i n b ol df ac e t yp e. Si gn ifi ca nt e ff ec ts a re g ra ph ic al ly r ep re se nt ed i n F ig ur e 4 a s i nd ic at ed n ea r s ig ni fic an t P -v al ue s. T he t ot al a m ou nt o f v ar ia nc e e xp la in ed b y e ac h m od el i s a ls o s ho w n. R es ul ts u si ng b uf fe rs o f 10 0m , 6 00 m a nd 30 00 m o f r ad iu s a re s ho w n i n A pp en di x S 13 . Rich ne ss Ev enn es s LC B D A bun da nc e C hi sq df p-v al C hi sq df p-v al C hi sq df p-v al C hi sq df p-v al 30 0 m B U FF ER Su m mer H os t p la nt 11 .3 6 6 .07 8 10 .9 8 6 .0 89 41 .5 9 6 < .0 01 28 .02 6 < .0 01 El ev at io n 0.1 3 1 .7 14 0. 17 1 .6 84 12 .31 1 < .0 01 4B 0. 37 1 .5 43 Pr ec ipi ta tio n 5. 97 1 .01 5 4C 4. 95 1 .0 26 1. 30 1 .2 55 0.0 8 1 .7 78 H ab ita t d iv er si ty 1.9 7 1 .1 61 0. 42 1 .51 5 0.0 4 1 .8 37 0. 83 1 .3 63 Fr ag men ta tio n 1. 33 1 .24 9 0. 71 1 .4 01 0. 34 1 .56 0 2. 58 1 .1 08 Ha bi ta t a m ou nt 0.0 3 1 .8 52 1. 36 1 .24 3 0.0 9 1 .76 7 0. 19 1 .6 59 H ab . d iv × F ragm . 0. 39 1 .5 32 0. 28 1 .59 7 0.0 5 1 .8 21 0. 25 1 .62 0 H ab . d iv × H ab . a m . 5. 65 1 .0 17 4E 6. 20 1 .0 13 4F 0.0 3 1 .86 6 3. 28 1 .07 0 Fr agm . × H ab . a m . 0.0 4 1 .8 43 0.0 1 1 .9 98 < 0.0 1 1 .9 72 0.1 8 1 .67 3 To ta l v ar ia nc e e xp la in ed .3 31 .26 4 .4 05 .222 W inte r H os t p la nt 6. 17 7 .52 0 22 .6 0 7 .0 02 94 .2 3 7 < .0 01 80 .4 0 7 < .0 01 El ev at io n 3.1 3 1 .07 7 7. 79 1 .0 05 4A 2. 28 1 .1 31 0. 67 1 .41 3 Pr ec ipi ta tio n 0. 55 1 .4 60 1. 09 1 .2 96 0. 21 1 .6 48 0.0 5 1 .818 H ab ita t d iv er si ty 0. 41 1 .52 3 0. 36 1 .5 46 1. 64 1 .20 0 0.0 1 1 .9 10 Fr ag men ta tio n 0.1 3 1 .7 21 0.0 4 1 .8 32 3.4 3 1 .0 64 0. 58 1 .4 45 Ha bi ta t a m ou nt 0.1 8 1 .67 0 0.1 3 1 .7 24 4. 31 1 .0 38 4D 0.1 6 1 .6 86 H ab . d iv × F ragm . 0. 19 1 .6 62 0. 33 1 .5 67 0.0 5 1 .83 0 0. 27 1 .6 07 H ab . d iv × H ab . a m . 0.7 8 1 .3 79 < 0.0 1 1 .9 60 0. 28 1 .59 5 0.9 5 1 .33 0 Fr agm . × H ab . a m . 0.9 6 1 .3 27 0. 75 1 0. 386 0. 56 1 .4 52 3.6 4 1 .0 56 To ta l v ar ia nc e e xp la in ed .0 94 .2 81 .4 51 .4 85 (Co nti nue s)
Rich ne ss Ev enn es s LC B D A bun da nc e C hi sq df p-v al C hi sq df p-v al C hi sq df p-v al C hi sq df p-v al 1, 00 0 m B U FF ER Su m mer H os t p la nt 12 .56 6 .0 51 11 .9 6 6 .063 41. 43 6 < .0 01 29 .5 8 6 < .0 01 El ev at io n 0.0 1 1 .9 20 0.1 3 1 .71 6 11 .7 3 1 .0 01 4I 0. 47 1 .4 94 Pr ec ipi ta tio n 8.3 0 1 .0 04 4J 5. 40 1 .02 0 1.9 9 1 .1 58 0. 32 1 .5 69 H ab ita t d iv er si ty 0. 54 1 .4 64 0.0 3 1 .8 57 0. 63 1 .42 8 0.9 9 1 .3 19 Fr ag men ta tio n 0.0 7 1 .7 95 < 0.0 1 1 .9 84 0.0 2 1 .8 83 0.1 5 1 .69 5 Ha bi ta t a m ou nt 0. 33 1 .56 6 0. 30 1 .5 85 0. 61 1 .4 35 0.0 3 1 .87 2 H ab . d iv × F ragm . 0.4 6 1 .49 9 0. 83 1 .3 61 0. 52 1 .4 69 0. 11 1 .74 5 H ab . d iv × H ab . a m . 3. 84 1 .05 0 2. 32 1 .1 28 0. 52 1 .47 1 0.0 9 1 .76 4 Fr agm . × H ab . a m . 2. 05 1 .1 52 1. 53 1 .2 16 0. 89 1 .3 46 0.1 5 1 .69 4 To ta l v ar ia nc e e xp la in ed .3 21 .26 2 .41 5 .1 84 W inte r H os t p la nt 6.1 8 7 .51 9 22 .7 8 7 .0 02 86 .65 7 < .0 01 76 .9 2 7 < .0 01 El ev at io n 4. 06 1 .0 44 4G 6.4 3 1 .0 11 4H 0. 11 1 .7 38 0.0 2 1 .8 86 Pr ec ipi ta tio n 1. 09 1 .2 96 1.1 6 1 .2 81 0.0 8 1 .7 72 0. 61 1 .4 33 H ab ita t d iv er si ty 0.0 2 1 .8 91 0.7 9 1 .3 73 1. 06 1 .3 02 1. 54 1 .2 15 Fr ag men ta tio n 1. 04 1 .3 07 1. 34 1 .24 6 2. 81 1 .0 93 4. 13 1 .0 42 4K Ha bi ta t a m ou nt 1. 17 1 .27 9 0.0 1 1 .942 7. 18 1 .0 07 4L 0. 60 1 .4 38 H ab . d iv × F ragm . 0.0 2 1 .87 8 0.1 8 1 .67 3 0.0 1 1 .9 19 0.1 3 1 .7 19 H ab . d iv × H ab . a m . 0.0 9 1 .76 6 0.0 3 1 .86 6 0.0 7 1 .7 94 1.1 6 1 .2 81 Fr agm . × H ab . a m . 0.7 7 1 .3 81 0.1 3 1 .7 17 0.1 2 1 .7 33 1.1 5 1 .2 83 To ta l v ar ia nc e e xp la in ed .0 97 .2 86 .4 42 .50 3 B ol d v al ue s a re t ho se t ha t a re l ow er t ha n 0 .0 5. T A B LE 1 (Co nti nue d)
between 500 and 1,000 m.a.s.l., although fragmentation values were larger at elevations below 500 than above 1,000 m.a.s.l. The amount of habitat increased steeply from 0 to 400 m.a.s.l and then a plateau was reached, whereas habitat diversity decreased grad-ually with elevation. These two opposing effects probably reflect the dominance of natural forests at higher elevations, leading to a larger proportion of habitat available, but to a lower habitat diver-sity (or evenness).
In the multi-scale analysis, the deviance explained by the dif-ferent landscape features varied greatly among landscape features and diversity metrics, and none of the buffer sizes used explained model variation greater than the others (Appendix S12). Based on this result, it was not possible to identify the buffer at which spatial effects were strongest and models were therefore built using land-scape data from two different buffer sizes that may explain short and long-scale effects, 300 and 1,000 m, respectively (Table 1, but see Appendix S13 for analyses using the other three buffer sizes).
4 | Plant effects on insect diversity and
abundance
The plant from which insects were collected was the variable with the strongest effect on insect evenness, beta diversity and abun-dance (Table 1, Figure 2). The plants H. ambavilla and L. camara had particularly large values of thrips evenness, D. ficulnea, H. ambavilla and Ipomoea sp. had the most different thrips assemblages (i.e. larg-est values of LCBD), whereas D. ficulnea, Ipomoea sp. and S.
mauri-tianum were the plants from where the largest insect abundances
were obtained. Species richness was only marginally affected by the plant in summer when using landscape data in the buffer of 1,000 m (Table 1). L. camara was the plant that contained the richest insect assemblage.
5 | Effect of elevation and rainfall on
insect diversity and abundance
Of the different environmental variables considered, only rainfall was retained in the models because temperature was strongly cor-related (R < 95%) with elevation (Appendix S5). In agreement with our hypotheses, elevation had a negative effect on insect alpha and beta diversity (Figure 3; Table 1). When models were built with data from 300 m buffers, the effect was observed in winter on spe-cies evenness (Table 1; Figure 4a). This effect was also observed on richness and evenness in winter when models were built with data from 1,000 m buffers (Table 1; Figure 4g and h). Elevation correlated negatively with beta diversity (LCBD) in summer in models using data from both 300 and 1,000 m buffers (Table 1, Figure 4b and i). These results suggest that in Reunion Island thrips are richer, and the different species are more evenly represented and unique in low-lands. Rainfall had a negative effect on thrips species richness and evenness in the models built with landscape data from both 300 and
1,000 m buffers. This effect, however, was only observed in summer (Table 1; Figure 4c and j).
6 | Effect of fragmentation, habitat
diversity and habitat amount on insect
diversity and abundance
In winter, when including landscape data from both 300 or 1,000 m buffers, beta diversity and habitat amount related negatively (Table 1, Figure 4d and l). In the models built using data from 1,000 m buffers, insect abundance related positively with fragmentation in winter (Table 1, Figure 4k). In summer, and when using landscape data from 300 m buffers, for both species richness and evenness significant interactions between habitat amount and habitat diver-sity were found (Table 1). In both cases, interaction plots revealed that habitat amount had a positive effect on insect richness and evenness, but this effect was lost in areas of low habitat diversity (Figure 4e and f). This effect was not observed in winter.
7 | DISCUSSION
In agreement with our hypotheses, insect richness and evenness decreased with elevation, although the effect was only observed in winter. In summer, accumulated monthly rainfall was the abiotic variable that dominated over thrips alpha diversity with a negative effect too. These contrasting seasonal effects may reflect the envi-ronmental conditions that dominate these two seasons. In the Indian Ocean, summer is rainy, warm and often with violent cyclones that may wash away adult thrips, an impact already observed by Boissot, Reynaud, and Letourmy (1998) in this same area. In winter, how-ever, low temperatures are likely to be the most important factor reducing alpha diversity at high elevations. As in many other insects in the tropics (Kishimoto-Yamada & Itioka, 2015), abiotic variables are therefore important factors determining diversity patterns in our study. Insect beta diversity also decreased with elevation in summer, a result that we hypothesized. This effect is unlikely to be caused by the presence or absence of few influential species, or sampling effects because the effect was found in areas with particularly large insect richness. It is surprising, however, that in a hotspot of diversity like Reunion, lowland habitats that are dominated by invasive plant species (like L. camara) and urbanization (Strasberg et al., 2005) host the most diverse and unique thrips assemblages. Many studies have already reported similar correlations between human populations and diversity (Luck, 2007) probably because human populations concentrate in areas with larger annual energy budgets that lead to more benign conditions for organisms to thrive (Gaston, 2005). Thrips fauna in the Indian Ocean is poorly studied, and it is there-fore difficult to know whether these lowland thrips assemblages are dominated by exotic species that reached the island together with exotic plants, or by native insects. The former is a likely situ-ation because invasive insects often reach new territories together
with their host plants (Liebhold, Brockerhoff, Garrett, Parke, & Britton, 2012). Knowing where native thrips are located would be particularly useful to identify hotspots of endemic diversity within the island (Socolar et al., 2016), and to unveil the role that invasive plants played in determining insect diversity patterns.
Thrips diversity was influenced by landscape features, when extracting landscape information from 300 and 1,000 m buf-fers. This suggests that these minute insects are able to disperse large distances as has already been reported for some species (Mound, 2005). In summer, both species richness and evenness were significantly related to habitat amount, but this effect de-pended on habitat diversity. The relationship between habitat amount and insect diversity was positive in highly diverse land-scapes, but this effect was offset in areas of low diversity. In agree-ment with our hypotheses, the negative effect of habitat loss on insect diversity may be thus exacerbated in low diversity habitats. In a recent study, Corcos et al. (2018) explored whether the ef-fect of temperature on the diversity of a range of different insect guilds was modulated by habitat diversity along elevational gra-dients. These authors found contrasting effects on the different insect guilds studied, but the interaction between landscape and elevation was never significant. As done by these authors, our mea-sure of habitat diversity was based on the proportion of different habitat types within the buffer, also known as land cover diversity. This measure mainly expresses topographic heterogeneity, and a meta-analysis by Stein et al. (2014) revealed its strong effect on the richness of terrestrial plants and animals. In this meta-analy-sis, however, plant diversity and vegetation complexity also had
strong impacts on diversity. Studies with cavity-nesting bees and wasps (Staab et al., 2016), and with insect predators (Vehviläinen, Koricheva, & Ruohomäki, 2008), for instance, revealed that diver-sity at the plant layer can even cascade up to higher trophic levels, and that the effect may depend on plant composition and on phylo-genetic diversity [reviewed in (Moreira, Abdala-Roberts, Rasmann, Castagneyrol, & Mooney, 2015)]. It would be very interesting to ob-tain more detailed information from our study sites, and to explore how other habitat diversity measures affect the results obtained. Relative to lowlands, highlands in Reunion had the lowest habitat diversity values because these areas are uniformly dominated by natural forests. These habitats, however, are likely to be far more diverse in terms of plant richness so the results observed here may be reversed. Going deeper into the diversity of our study sites, for example exploring plant diversity, may also help to understand the unexpected negative effect that habitat amount had on beta diver-sity. Exploring the effect of plant diversity may require expertise in plant taxonomy and intense fieldwork, and using highly-resolved landscape layers is likely to be the most feasible technique in areas where plant taxonomy is not fully resolved, or fieldwork is challeng-ing. The method used here can therefore be useful to compare our results with other animal taxa because few studies have integrated a suite of landscape variables to identify and isolate the factors that drive alpha and beta diversity changes along environmental gradi-ents (Mori et al., 2018).
There is a long and unsolved debate over whether fragmen-tation has a positive or negative effect on diversity (Fahrig, 2019; Fletcher et al., 2018), and on whether negative effects are mostly
F I G U R E 2 Thrips diversity and
abundance on the different plants studied. Alpha diversity is expressed as species richness and evenness (Simpson index), and beta diversity as the local contribution to beta diversity metric (LCBD). Dark and light grey bars represent endemic and exotic plants, respectively. The category "others" includes plants that were sampled less than five times during the study. Abbreviations represent the following plants: Desmodium intortum (DesInt), Dombeya ficulnea (DomFic),
Hedychium gardnerianum (HedGar), Hubertia ambavilla (HubAmb), Ipomoea
spp. (Ipo), Lantana camara (LanCam),
Paspalum dilatatum (PasDil) and Solanum mauritianum (SolMau). Details on the
plants sampled can be found in Appendix S06. Othe r DesIn t DomFi c HedGar HubAmb Ip o LanCa m Pa sDil SolMau Richnes s 0.0 0.5 1.0 1.5 2.0 2.5 3.0 Othe r DesIn t DomFi c HedGar HubAmb Ip o LanCa m Pa sDil SolMau Ev enes s 0.0 0.5 1.0 1.5 2.0 2.5 3.0 Other DesInt
DomFic HedGar HubAmb
Ip o LanCam Pa sDil SolMau LCBD 0.000 0.001 0.002 0.003 0.004 Other DesInt
DomFic HedGar HubAmb
Ip o LanCam Pa sDil SolMau Ab undance 0 5 10 15 20 25
due to a reduction in the amount of habitat available. In our study, fragmentation had a positive effect on thrips total abundance in winter, but overall this variable had little influence on diversity esti-mates. Relative to habitat amount or habitat diversity, fragmentation is therefore a minor driver of thrips diversity in Reunion Island. In addition, if the models built are simplified and habitat amount re-moved (results not shown), fragmentation becomes a significant
explanatory variable for diversity in some cases, which suggests that habitat amount may sometimes be the reason behind significant ef-fects of fragmentation on diversity. Altogether, these results provide additional support to the habitat amount hypothesis (Fahrig, 2013; Watling et al., 2020), although more experimental work, and not just observational studies is needed to confirm this tendency over a range of taxa and ecosystem types.
F I G U R E 3 Scaterplots showing the relationship between elevation and landscape features with the different metrics of thrips diversity
and abundance. Alpha diversity is expressed as species richness and evenness (Simpson index), and beta diversity as the local contribution to beta diversity metric (LCBD). Landscape features are estimated using 1000 m buffers. Black and grey dots represent values estimated in summer and winter, respectively.
Our diversity estimates were based on adult thrips collected from flowers, but their larvae are known to predate on other insects, or to feed on a variety of plants and fungi, and then to disperse as adults to
feed on pollen or to mate (Mound, 2005). Thrips are easy to sample and have a large functional and taxonomic diversity, which makes this insect order a good model to study diversity patterns. Even if some
−1 0 1 2 0.5 1.0 1.5 2.0 Standardised elevation Ev enness par tial residuals A −1 0 1 0.0015 0.0020 0.0025 0.0030 0.0035 0.0040 0.0045 Standardised elevation LCBD pa rtial residuals B −1 0 1 2 0.0 0.5 1.0 1.5 2.0 2.5 Standardised rainfall Richness par tial residuals C −3 −2 −1 0 0.0020 0.0025 0.0030 0.0035 0.0040 0.0045 0.0050 0.0055
Standardised habitat amount
LCBD par tial residuals D −3 −2 −1 0 0.5 1.0 1.5 2.0 2.5
High diversity habitats Low diversity habitats
High diversity habitats Low diversity habitats
Standardised habitat amount
Richness par tial residuals E −3 −2 −1 0 0.5 1.0 1.5 2.0 2.5
Standardised habitat amount
Ev enness par tial residuals F −1 0 1 2 0.5 1.0 1.5 2.0 2.5 Standardised elevation Richness par tial residuals −1 0 1 2 0.5 1.0 1.5 2.0 Standardised elevation Ev enness pa rtial residuals −1 0 1 0.0015 0.0020 0.0025 0.0030 0.0035 0.0040 0.0045 Standardised elevation LCBD pa rtial residuals −1 0 1 2 0.0 0.5 1.0 1.5 2.0 2.5 Standardised rainfall Richness par tial residual s −1 0 1 2 3 0 1 2 3 Standardised fragmentation Ab undance pa rtial residuals −3 −2 −1 0 0.002 0.003 0.004 0.005
Standardised habitat amount
LCBD pa
rtial residuals
G H I
J
thrips species are known to be pollinators, this group is not usually considered as a pollinator guild, and most species are considered as passive dispersers with weak interactions with flowers as adults (Mound, 2005). The multivariate analysis revealed that plants had a strong effect on thrips composition, thereby suggesting that this group can also be useful to study insect–plant interaction networks. For example, the newly found species, T. reunionensis (Goldarazena et al., 2020) was associated with the endemic plant Dombeya
ficul-nea, but only in winter when this plant was in full bloom.
One reason why the elevational diversity gradient in herbivores is not fully understood is that it depends on several interacting fac-tors. Several environmental variables are hypothesized to be the driving force, but also their indirect effect via primary productivity and competitive interactions (Kreft & Jetz, 2007; Vetaas, Paudel, & Christensen, 2019). Many hypotheses like the mid domain effect or the water-energy dynamics have been proposed. As we show here, finding general patterns may be challenging if habitat disturbance by human populations is not taken into account. Reunion is a small island in which the landscape changes dramatically with elevation because human settlements concentrate in lowlands, a large na-tional park covers high elevation areas, and agricultural lands are found in between with strong differences between the east and the west of the island (Strasberg et al., 2005). Even if some land-scape variables like habitat amount were collinear with elevation, elevation impacted the different habitat features measured differ-ently. This situation offered a unique opportunity to explore how, in addition to elevation, landscape features affect diversity patterns. Island diversity, especially in highly populated and remote islands like Reunion, is particularly threatened by habitat loss and invasive species. Given the disproportionate diversity that tropical islands host, understanding how diversity varies across space and time in these areas can help designing future conservation efforts (Russell & Kueffer, 2019). Many thrips species are pests, and studying the diversity of this taxa can also help to understand their spatio-tem-poral dynamics and allow the design of agricultural landscapes in which pest outbreaks are less likely.
ACKNOWLEDGEMENTS
We are grateful to Samuel Nibouche for insightful discussions along the development of this project, to Gérard Lebreton and Eric Rivière (Pôle Forêt, Saint-Pierre) for help with plant identification,
to Bruno Michel and Arturo Goldarazena for help with thrips iden-tification, and to Christine Meynard, the many members of N.T.D's PhD committee, and two anonymous reviewers for insightful com-ments on earlier versions of the manuscript. This work was funded by the Regional Council of Reunion, the Departmental Council of the Region Reunion, the European Union (EAFRD and ERDF programs) and by the Centre de Coopération internationale en Recherche agronomique pour le Développement (CIRAD). N.T.D. was funded by Regional Council of Reunion via a PhD scholarship. EF was funded by the Regional Council of Reunion, the Departmental Council of the Region Reunion, the European Union (EAFRD), CIRAD and the Agence Nationale de la Recherche (ANR) via the PRIMA S2 2018 project INTOMED.
DATA AVAIL ABILIT Y STATEMENT
The data sets generated during and/or analysed during the current study are available at Dryad doi:10.5061/dryad.18931zcvk. R code used to analyse data can be accessed from the corresponding author on reasonable request.
ORCID
Enric Frago https://orcid.org/0000-0001-8817-1303
REFERENCES
Barnosky, A. D., Matzke, N., Tomiya, S., Wogan, G. O. U., Swartz, B., Quental, T. B., … Ferrer, E. A. (2011). Has the Earth’s sixth mass extinction already arrived? Nature, 471(7336), 51–57. https://doi. org/10.1038/natur e09678
Bates, D., Mächler, M., Bolker, B. M., & Walker, S. C. (2015). Fitting lin-ear mixed-effects models using lme4. Journal of Statistical Software,
67(1), 1–48. https://doi.org/10.18637/ jss.v067.i01
Benjamini, Y., & Hochberg, Y. (1995). Controlling the false discovery rate—A practical and powerful approach to multiple testing. Journal
of the Royal Statistical Society Series B (Methological), 57(1), 289–300.
https://doi.org/10.2307/2346101
Bertrand, C., Burel, F., & Baudry, J. (2016). Spatial and temporal het-erogeneity of the crop mosaic influences carabid beetles in agricul-tural landscapes. Landscape Ecology, https://doi.org/10.1007/s1098 0-015-0259-4
Betts, M. G., Fahrig, L., Hadley, A. S., Halstead, K. E., Bowman, J., Robinson, W. D., … Lindenmayer, D. B. (2014). A species-centered approach for uncovering generalities in organism responses to hab-itat loss and fragmentation. Ecography, 37(6), 517–527. https://doi. org/10.1111/ecog.00740
F I G U R E 4 Plots showing partial residuals from the models on the effect of elevation, rainfall and landscape variables on thrips diversity
and abundance when extracting landscape information from 300m (A-F) and 1000m (G-L) buffers. Only significant effects are plotted (see Table 1). The fitted lines are estimated from the linear mixed effects models, the points represent the partial residuals from the models, based on the visreg package in R, and the rugplot is shown along the abscissa axis. To fulfil model assumptions all analyses are performed after standardising all predictor continuous variables. A. The effect of elevation on thrips evenness in winter; B. The effect of elevation on thrips beta diversity (LCBD) in summer; C. The effect of accumulated rainfall on thrips species richness in summer; D. The effect of habitat amount on thrips beta diversity (LCBD) in winter. The effect of habitat amount and its interactions with habitat diversity on thrips species richness (E) and evenness (F) in summer. The interaction represents high (dark grey) and low (light grey) values of habitat diversity; The effect of elevation on thrips species richness (G) and evenness (H) in winter; I. The effect of elevation on thrips beta diversity (LCBD) in summer; J. The effect of accumulated rainfall on thrips species richness in summer; K. The effect of fragmentation on thrips abundance in winter; L. The effect of habitat amount on thrips beta diversity (LCBD) in winter. For both the models built using landscape data from 300 and 1000m, the significant effect of accumulated rainfall on thrips evenness in summer has been omitted as the relationship is very similar to that with species richness. Raw data ranges can be seen in Figure 3.
Boissot, N., Reynaud, B., & Letourmy, P. (1998). Temporal analysis of western flower thrips (Thysanoptera: Thripidae) population dynam-ics on reunion island. Environmental Entomology, 27(6), 1437–1443. https://doi.org/10.1093/ee/27.6.1437
Cardinale, B. J., Duffy, J. E., Gonzalez, A., Hooper, D. U., Perrings, C., Venail, P., … Naeem, S. (2012). Biodiversity loss and its impact on humanity.
Nature, 486(7401), 59–67. https://doi.org/10.1038/natur e11148
Chamberlain, D., Brambilla, M., Caprio, E., Pedrini, P., & Rolando, A. (2016). Alpine bird distributions along elevation gradients: The consistency of climate and habitat effects across geographic re-gions. Oecologia, 181(4), 1139–1150. https://doi.org/10.1007/ s0044 2-016-3637-y
Chao, A., Gotelli, N. J., Hsieh, T. C., Sander, E. L., Ma, K. H., Colwell, R. K., & Ellison, A. M. (2014). Rarefaction and extrapolation with Hill numbers: A framework for sampling and estimation in species di-versity studies. Ecological Monographs, 84(1), 45–67. https://doi. org/10.1890/13-0133.1
Chao, A., & Jost, L. (2012). Coverage-based rarefaction and extrap-olation: Standardizing samples by completeness rather than size.
Ecology, 93(12), 2533–2547. https://doi.org/10.1890/11-1952.1
Colwell, R. K., Chao, A., Gotelli, N. J., Lin, S. Y., Mao, C. X., Chazdon, R. L., & Longino, J. T. (2012). Models and estimators linking individu-al-based and sample-based rarefaction, extrapolation and compari-son of assemblages. Journal of Plant Ecology, 5(1), 3–21. https://doi. org/10.1093/jpe/rtr044
Corcos, D., Cerretti, P., Mei, M., Vigna Taglianti, A., Paniccia, D., Santoiemma, G., … Marini, L. (2018). Predator and parasitoid insects along elevational gradients: Role of temperature and habitat diver-sity. Oecologia, 188(1), 193–202. https://doi.org/10.1007/s0044 2-018-4169-4
Fahrig, L. (2013). Rethinking patch size and isolation effects: The hab-itat amount hypothesis. Journal of Biogeography, 40(9), 1649–1663. https://doi.org/10.1111/jbi.12130
Fahrig, L. (2017). Ecological responses to habitat fragmentation per se.
Annual Review of Ecology Evolution and Systematics, 48, 447–471.
https://doi.org/10.1146/annur ev-ecols ys-110316
Fahrig, L. (2019). Habitat fragmentation: A long and tangled tale. Global
Ecology and Biogeography, 28(1), 33–41. https://doi.org/10.1111/
geb.12839
Fletcher, R. J., Didham, R. K., Banks-Leite, C., Barlow, J., Ewers, R. M., Rosindell, J., … Haddad, N. M. (2018). Is habitat fragmentation good for biodiversity? Biological Conservation, 226, 9–15. https://doi. org/10.1016/j.biocon.2018.07.022
Gaston, K. J. (2005). Biodiversity and extinction: Species and peo-ple. Progress in Physical Geography, 29(2), 239–247. https://doi. org/10.1191/03091 33305 pp445pr
Goldarazena, A., Dianzinga, N. T., Frago, E., Michel, B., & Reynaud, P. (2020). A new species of the Genus Thrips (Thysanoptera, Thripidae) from the Afro-tropical Region. Zootaxa, 4750(3), 443–446.
Haddad, N. M., Brudvig, L. A., Clobert, J., Davies, K. F., Gonzalez, A., Holt, R. D., … Townshend, J. R. (2015). Habitat fragmentation and its last-ing impact on Earth’s ecosystems. Science Advances, 1(2), e1500052. https://doi.org/10.1126/sciadv.1500052
Haila, Y., & Hanski, I. K. (1984). Methodology for studying the effect of habitat fragmentation on land birds. Annales Zoologici Fennici.21(3), 393–397.
Hanski, I. (2015). Correspondence—Habitat fragmentation and species richness. Journal of Biogeography, 42(5), 989–993. Retrieved from http://onlin elibr ary.wiley.com/doi/10.1111/jbi.12478/ full.
Harrison, X. A., Donaldson, L., Correa-Cano, M. E., Evans, J., Fisher, D. N., Goodwin, C. E. D., … Inger, R. (2018). A brief introduction to mixed effects modelling and multi-model inference in ecology. PeerJ, 6, e4794. https://doi.org/10.7717/peerj.4794
Harter, D. E. V., Irl, S. D. H., Seo, B., Steinbauer, M. J., Gillespie, R., Triantis, K. A., … Beierkuhnlein, C. (2015). Impacts of global climate change on
the floras of oceanic islands - Projections, implications and current knowledge. Perspectives in Plant Ecology, Evolution and Systematics,
17(2), 160–183. https://doi.org/10.1016/j.ppees.2015.01.003
Hodkinson, I. D. (2005). Terrestrial insects along elevation gradients: Species and community responses to altitude. Biological Reviews
of the Cambridge Philosophical Society, 80(3), 489–513. https://doi.
org/10.1017/S1464 79310 5006767
Hooper, D. U., Adair, E. C., Cardinale, B. J., Byrnes, J. E. K., Hungate, B. A., Matulich, K. L., … O’Connor, M. I. (2012). A global synthesis re-veals biodiversity loss as a major driver of ecosystem change. Nature,
486(7401), 105–108. https://doi.org/10.1038/natur e11118
IUCN. (2008). World Heritage Nomination - IUCN technical evaluation,
Pitons, cirques and Remparts of Reunion Island (France) - ID No 1317.
Jackson, H. B., & Fahrig, L. (2015). Are ecologists conducting research at the optimal scale? Global Ecology and Biogeography, 24(1), 52–63. https://doi.org/10.1111/geb.12233
Jost, L. (2006). Entropy and diversity. Oikos, 113(2), 363–375. https://doi. org/10.1111/j.2006.0030-1299.14714.x
Kishimoto-Yamada, K., & Itioka, T. (2015). How much have we learned about seasonality in tropical insect abundance since Wolda (1988)?
Entomological Science, 18(4), 407–419. https://doi.org/10.1111/ens.12134
Kreft, H., & Jetz, W. (2007). Global patterns and determinants of vascu-lar plant diversity. Proceedings of the National Academy of Sciences,
104(14), 5925–5930. https://doi.org/10.1073/pnas.06083 61104
Kremen, C., & Merenlender, A. M. (2018). Landscapes that work for biodiversity and people. Science, 362(6412), eaau6020. https://doi. org/10.1126/scien ce.aau6020
Legendre, P., & Anderson, M. J. (1999). Distance-based redundancy anal-ysis: Testing multispecies responses in multifactorial ecological ex-periments. Ecological Monographs, 69, 1–24.
Legendre, P., & De Cáceres, M. (2013). Beta diversity as the variance of community data: Dissimilarity coefficients and partitioning. Ecology
Letters, 16, 951–963.
Legendre, P., & Gallagher, E. D. (2001). Ecologically meaningful transfor-mations for ordination of species data. Oecologia, 129, 271–280. Liebhold, A. M., Brockerhoff, E. G., Garrett, L. J., Parke, J. L., & Britton,
K. O. (2012). Live plant imports: The major pathway for forest in-sect and pathogen invasions of the US. Frontiers in Ecology and the
Environment, https://doi.org/10.1890/110198
Luck, G. W. (2007). A review of the relationships between human pop-ulation density and biodiversity. Biological Reviews, 82(4), 607–645. https://doi.org/10.1111/j.1469-185X.2007.00028.x
Mantyka-pringle, C. S., Martin, T. G., & Rhodes, J. R. (2012). Interactions between climate and habitat loss effects on biodiversity: A system-atic review and meta-analysis. Global Change Biology, 18(4), 1239– 1252. https://doi.org/10.1111/j.1365-2486.2011.02593.x
Marini, L., Prosser, F., Klimek, S., & Marrs, R. H. (2008). Water-energy, land-cover and heterogeneity drivers of the distribution of plant species richness in a mountain region of the European Alps. Journal of Biogeography, 35(10), 1826–1839. https://doi. org/10.1111/j.1365-2699.2008.01924.x
McCain, C. M. (2009). Global analysis of bird elevational diversity.
Global Ecology and Biogeography, 18(3), 346–360. https://doi.
org/10.1111/j.1466-8238.2008.00443.x
Moreira, X., Abdala-Roberts, L., Rasmann, S., Castagneyrol, B., & Mooney, K. A. (2015). Plant diversity effects on insect herbivores and their natural enemies: Current thinking, recent findings, and fu-ture directions. Current Opinion in Insect Science, 32, 15–21. https:// doi.org/10.1016/j.cois.2015.10.003
Mori, A. S., Isbell, F., & Seidl, R. (2018). β-Diversity, community assem-bly, and ecosystem functioning. Trends in Ecology and Evolution, 33(7), 549–564. https://doi.org/10.1016/j.tree.2018.04.012
Mound, L. A. (2005). Thyssanoptera: Diversity and interactions. Annual
Review of Entomology, 50(6), 247–269. https://doi.org/10.1146/annur