HAL Id: ird-00278335
https://hal.ird.fr/ird-00278335
Submitted on 12 May 2008
HAL is a multi-disciplinary open access archive for the deposit and dissemination of sci-entific research documents, whether they are pub-lished or not. The documents may come from
L’archive ouverte pluridisciplinaire HAL, est destinée au dépôt et à la diffusion de documents scientifiques de niveau recherche, publiés ou non, émanant des établissements d’enseignement et de
Didier Blavet, Jean-Claude Leprun, Ezoun Mathé, Marc Pansu
To cite this version:
Didier Blavet, Jean-Claude Leprun, Ezoun Mathé, Marc Pansu. Soil colour variables as simple indi-cators of the duration of soil waterlogging in a West African catena.. Soil Science: Confronting New Realities in the 21st Century. Transactions of the 17th World Congress of Soil Science, 14 - 21 August 2002, Bangkok, Thailand, 2002, Bangkok, Thailand. pp.1333-1:1333-11. �ird-00278335�
Soil colour variables as simple indicators of the
duration of soil waterlogging in a West African catena
BLAVET Didier (1), LEPRUN Jean Claude (1), MATHE Ezoun (2) and PANSU Marc (1)(1) IRD: Institut de Recherche pour le Développement, 911 Avenue Agropolis, B.P. 5045, 34032 Montpellier, France
(2) Institut National des Sols, Cacavelli, Lome, Togo
Abstract
The aim of this study was to analyse the relationships between soil colour and the duration of soil waterlogging by phreatic or perched groundwater, in a representative hillside of the West African granito-gneissic bedrock. This duration is a decisive parameter for agricultural or forestry development, but it can vary widely over short distances on hillsides, such as those of the West African granito-gneissic bedrock.
Whereas existing methods do not give ready access to this parameter, two arguments suggest that soil colour could give relatively low cost and low time-consuming indicators of the duration of soil waterlogging: i) soil color depends on the types of soil constituents present, which can depend on the duration of soil waterlogging; ii) soil color is also easily accessible and relatively stable over time.
The selected catena was in central Togo lat 8°38′–8°39′N, long 1°00″–1°01″E, in a biophysical environment covering some 500,000 km in West Africa. Nineteen hydropedological stations were installed on this catena. Soil and piezometric conditions were studied on these stations for three annual cycles (1989-1992). Data collected in each station were used to calculate the mean annual rate of soil waterlogging (WLG) at 10-cm intervals from the surface down to a depth of 7 m. At the same intervals, 8 numerical colour variables were calculated from the colours of the uncemented soil phases: Munsell value, chroma, angular hue and redness rating of the principal uncemented phase; mean Munsell value, mean chroma, mean angular hue and mean redness rating
Statistical relationships were established between WLG and each of these soil colour variables. The two most significant relations were those between WLG on one hand, and mean angular hue and mean redness rating on the other hand. These two relationships provided the basis for logistic models predicting the mean annual rate of soil waterlogging. The operational limits of these models were finally discussed.
Keywords: soil colour, waterlogging, toposequence, catena, granito-gneissic bedrock,
West Africa
Introduction
The duration of soil waterlogging by phreatic or perched groundwater is a decisive parameter for agricultural or forestry development. When its spatial variability is high, it becomes particularly useful to obtain ready access to this parameter. This case frequently arises on the hillsides of the West African granito-gneissic bedrock, as shown
by several water table monitorings with piezometers or tensiometers (Lelong, 1966; Worou, 1988; Fritsch et al., 1990a; Fritsch, 1993; Blavet, 1996). However, this type of monitoring requires a rather complex equipment and numerous measurements over time, which excludes its employment on wide areas. In addition, methods such as simulation of the duration of soil waterlogging from hydrological models or inferences from remote sensing analysis remain time-consuming and imprecise, owing to i) the requirement of numerous data and model calibration (Beven and Kirkby, 1979; Depraetere, 1992; Langsholt, 1994; Engman and Gurney, 1991; Smith et al., 1992), ii) the hydrological complexity of this type of hillside (Poss and Valentin, 1983; Chevallier, 1988) and iii) the masking of soil surface by anthropized vegetation (Poss et
al., 1990; Blavet et al., 2000).
From an operational point of view, it is worth looking for simple soil indicators of the duration of soil waterlogging on these hillsides. Ferrous iron content and oxidation-reduction potential could be such indicators (Vizier, 1974, 1984), but they also require numerous on site-measurements over time. On the other hand, several arguments suggest that soil colour can be such an indicator: i) soil colour theoretically depends on the types of soil constituents (Schwertmann, 1993), which can depend, in turn, on the duration of soil waterlogging; ii) soil colour is also easily accessible and relatively stable over time, which explains that several soil classification systems use it in diagnosing the water regime of a soil (e.g. USDA, 1975; Vizier, 1992); iii) several studies conducted in temperate regions have revealed significant correlations between soil colour and the duration of water saturation of the soil (Franzmeier et al., 1983; Evans and Franzmeier, 1986, 1988; Mokma and Cremeens, 1991; Mokma and Sprecher, 1994; Thompson and Bell, 1996).
Within this framework, our aim was to study the relations between soil colour and the duration of soil waterlogging, on a representative hillside on the granito-gneissic bedrock of West Africa.
Material and Methods Localisation of the study and monitoring in the field
The study was carried out on a typical hillside of a biophysical environment covering some 500,000 km2 in West Africa (Blavet et al., 2000). This hillside is located at 300 km north of Lomé, Togo, 1°00'-1°01' E and 8°38'-8°39'. The bedrock is a biotite/muscovite gneiss, and the vegetation is a savannah. Mean annual rainfall is 1,158 mm (1974-1992 data). The rainy season is centred around July-August-September. Mean temperature is 25°C (1990-1992 data), with extremes of 15°C and 35°C. The soil catena consist of red ferrallitic soils upslope, yellow ferruginous soils at mid-slope positions and greenish hydromorphic soils downslope. This catena is thought to be largely the result of transformations of an ancient red kaolinitic mantle (Boulet, 1974; Grandin, 1976; Leprun, 1979) connected with the action of water: the yellow horizons of the ferruginous, mid-slope soils would have formed from reddish ferrallitic soils under the effects of a temporary perched water-table (Segalen, 1969; Faure, 1975; Levê que, 1975; Chauvel, 1977; Chauvel and Pedro, 1978; Fritsch et al., 1990b); downslope, the permanent groundwater has led to bleached horizons and greenish gley (Fritsch, 1993, Blavet, 1996).
Nineteen hydropedological stations were installed on this hillside, along a toposequence of 650 m long. Each station consisted of an array of 2 to 4 piezometers, with observation pits and boreholes. The piezometers were installed with a depth going up to 7 meters (Blavet et al., 2000). The field study continued through three complete annual cycles, from September 1989 to September 1992. This period was proved to be representative of rainfall conditions at the site (Blavet, 1996). During this period, observation pit profiles and borehole cores were analysed, and piezometric levels were taken daily.
Relating soil colour parameters to the duration of waterlogging Calculation of annual and mean annual soil waterlogging rate
The soil waterlogging rate at a given point in the toposequence was defined following equation 1, for measurement periods of one or several years:
365 . 100 WLGxi,zi n N
∑
× = (1)with xi, zi = the spatial coordinates of the point in question (xi = position of the station in the toposequence and zi = vertical position of the measurement point), ∑N = number of days throughout the measurement period during which the water table reached the point in question, and n = number of years for which measurements were taken. Equation (1) gave the annual soil waterlogging rate for the three annual cycles of the study (1989-1990, 1990-1991 and 1991-1992), and the mean annual soil waterlogging rates (WLG) for the period 1989-1992. These rates were calculated at vertical intervals of 10 cm, for each of the 19 hydropedological stations. These operations were made by a computer program working on a piezometric database, as they produced 630 measurement points and involved more than a million readings of the water table level.
Obtaining variables derived from soil colour
The study of the profiles and core samples allowed the identification of 144 homogeneous, sub-horizontal elementary soil volumes (SVs), whose characteristics were introduced in a soil database. These characteristics included their vertical boundaries and the proportions and colour of each uncemented phase. These proportions were assessed, with a field quantification scale developed by Chatelin (1976) and Beaudou (1977). A numerical conversion of this field scale was produced by i) optimisation, under the constraint of the boundaries of each interval, in order to produce for each SV a sum of proportions close to 100%, and ii) weighting of the proportions, so that the sum of the weighted proportions were exactly equal to 100%.
The colours of the phases were assessed by Munsell colour chart (Munsell, 1946 and 1976), including Hue (H Munsell), Value (V) and Chroma (C). This operation was
first carried out in the field, to identify the uncemented phases. The colour of each phase was re-assessed in the laboratory from air dried SV samples, under constant light conditions (white-light neon tube). The Munsell hues, as re-assessed in the laboratory, were converted into angular hues in degrees (H), according to the position of the hues in the circle of the Munsell colour cylinder, and taking as a convention H = 360 for HMunsell
= 10 RP. The conversion’s formula is given in equation 2, where I1 is the numerical
YR⇒ I1 =1, etc.) and I2 is the number associated with that Munsell hue (i.e. 2.5 for
2.5 YR; 5 for 5 YR; etc.):
+ ⋅ = ° 10 I I 36 H 1 2 (2)
Redness ratings (Torrent et al., 1980, 1983) were also calculated, for they are linked to the mineralogical form of iron oxide present, especially its hematite content (Schwertmann, 1993; Jeanroy et al., 1991), and they are potential indicators of soil water saturation status (Thompson and Bell, 1996). Redness rating (RR) is defined following equation 3. The conventions for the hue are Hr = 0 for 10 R and Hr = 10 for 10
YR. This gives a grading system where the hue circle is divided into 100 units for Hr (as
against 360 units for H), with a displacement of one tenth of the circle (36 units of H or 10 units of Hr) between the starting point of H (10 RP) and that of Hr (10R). The
conversion between Hr and H° is given by equation 4.
V C ) H (10 RR= − r × (3) 10 18 5H 360 ) 36 100(H Hr= °− = °− (4)
Finally, eight variables were obtained: i) four “main colour” variables were obtained from the colour of the principal uncemented phase of each SV, which are the Munsell value, chroma and angular hue of this phase (Vphase1, Cphase1 and Hphase1), and its
redness rating (RRphase1); ii) four “mean colour” variables were calculated as functions
of the colours and weighted proportions of the various uncemented phases of each SV: Munsell value (V ), mean chroma ( C ),mean angular hue ( H° ) and mean redness rating ( RR ). The general formula used to calculate these four variables is given by equation 5, where Colv represents Munsell value, Munsell chroma, angular hue or redness rating; Colv i are the values of these variables for the different uncemented phases within the same soil volume, and αi are the weighted proportions of the different uncemented phases of this volume (
∑
αi= 100%).(
)
∑
× = Colvi Colv Mean αi (5)Relating the variables derived from soil colour to WLG.
For each hydropedological station, we determined the elementary soil volume (SV) corresponding to the points used for calculating WLG. This established 574 pairs associating an SV with a mean annual soil waterlogging rate for the catena. Taking the eight colour variables for each SV, we obtained eight sets of 574 pairs of values associating a colour variable with WLG. Furthemore, the following statistical analysis were carried out: i) each set was first analysed in search of a possible regression model such that f(x) = WLG, where x is a colour variable. We analysed the significance of the correlation coefficient of these models, and we compared how well the different models fitted the data by a statistical examination of the differences between the correlation coefficients (Baillargeon, 1989); ii) for the models that best fit the data, we calculated
the 95 % confidence error margins EWLG0.95[x] and the intervals of prediction IWLG 0.95[x] of WLG, given as equation 6 (Blavet et al., 2000).
IWLG0.95[x] = min(100, f(x)+EWLG0.95[x]) – max(0,f(x)-EWLG0.95[x]) (6) Results
Waterlogging rates and soil color variables
Table 1 shows the statistical characteristics of the annual and mean annual soil waterlogging rates obtained for the 630 points of the catena. These rates vary between 0 (no waterlogging) and 100 (permanent waterlogging) depending on the localisation on the catena (Blavet et al., 2000). The results obtained for any given year is close to those obtained for any other year (cf. mean and standard deviation), which is confirmed by a strong linear correlation between these rates, with adjustment on a slope close to 1 and r > 0.96.
Table 1 Characteristics of annual and mean annual soil waterlogging rates.
Hydrologic variable N. of points Min. Max. Mean Std. Dev.
WLG [89-90] 26.9 36.5 WLG [90-91] 27.9 37.7 WLG [91-92] 26.7 35.0 WLG 630 0 100 27.7 35.4
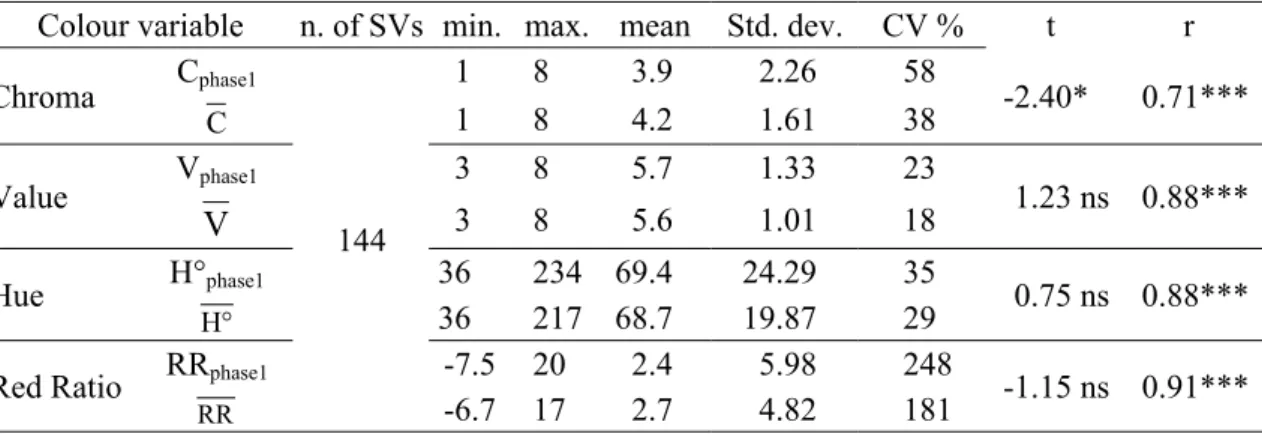
Table 2 shows statistical data for the color of the 144 SVs of the catena. Few differences appear between the mean values of the “main colour” variables (i.e the colour variables of the principal phase) and the “mean colour” variables. However, the main colour variables only partly reflect the colour of the materials, since 105 of the 144 SVs are mottled with two or three phases and there can be major colour differences between these phases: up to 5 units of Munsell value, 7 units of chroma and 171° of angular hue. This explains that the correlations between these variables are notably different from perfect correlations, as r < 0.92.
Table 2 Colour characteristics of SVs and comparisons between “main colour” and
“mean colour” variables.
Colour variable n. of SVs min. max. mean Std. dev. CV % t r
Cphase1 1 8 3.9 2.26 58 Chroma C 1 8 4.2 1.61 38 -2.40* 0.71*** Vphase1 3 8 5.7 1.33 23 Value V 3 8 5.6 1.01 18 1.23 ns 0.88*** H°phase1 36 234 69.4 24.29 35 Hue ° H 36 217 68.7 19.87 29 0.75 ns 0.88*** RRphase1 -7.5 20 2.4 5.98 248 Red Ratio RR 144 -6.7 17 2.7 4.82 181 -1.15 ns 0.91*** * = significant at 95 % *** = significant at 99.9 %
Relationships between soil colour and WLG
From the analysis of data sets associating each colour variable with WLG, four different cases emerge, as shown by Table 3 and Figure 1: i) no correlation can be seen between chroma variables and WLG (random patterns for the dispersion diagrams; r no significant); ii) exponential regression models rely the Munsell value variables to
WLG, but the relatively small values of r coefficients (r around 0.3) show that a wide variation inWLG is still not explained by these models; iii) sigmoïdal logistic functions (Jolivet, 1983) connect the angular hue and redness rating of the main uncemented phase to the WLG variable (r around 0.55); iv) the best adjustments (r = 0.72) are obtained with logistic functions connecting the mean angular hue ( H°) and the mean
redness rating ( RR) to WLG.
Table 3 Relationships between soil colour and WLG.
N variable (y)Hydrologic Modelf(x) Colour variablex α β r Cphase1 / / 0.008 ns Linear Chroma C / / -0.06 ns Vphase1 0.02 1.07 0.25*** Exponential WLG = f(x) = αeβx Value V 0.07 0.87 0.35*** H°phase1 18551 -0.11 0.57*** Hue H° 382353 -0.16 0.72*** RRphase1 2.67 1 0.52*** 574 WLG Logistic
(
. .x)
1 100 WLG β αe + = Red Ratio RR 2.07 1 0.72*** *** = significant at 99.9 % 0 0.1 0.2 0.3 0.4 0.5 0.6 0.7 0.8 0.9 1 Cpha se1Mean C Vphase1 Mean V RRphas e1 H?ph ase1 mean H ? Mean R R |r| Chroma (ns) Value Redness rating and Hue of the main phase
Mean Redness rating and Mean Hue
nb : Textures of the histograms gather the coefficients of correlation that are statistically non different at p = 95%
Figure 1 Statistical comparison of the correlation coefficients between the colour
variables and WLG.
Figures 2 and 3 show the curves of the models that connect H° and RR to mean
WLG, and their associated 95% confidence error margins of prediction of WLG (E
WLG0.95[x]). The sigmoïdal shape of these curves shows thresholds below which the
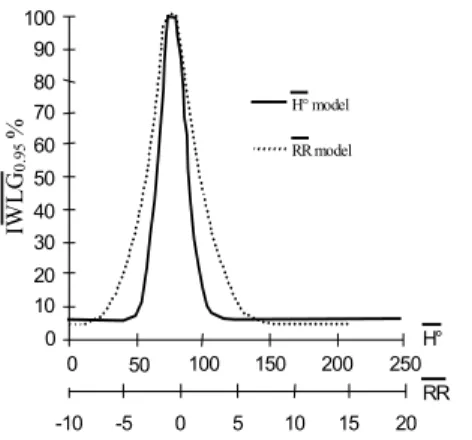
maximum. These thresholds correspond to mean angular hues of around 75, i.e. between 10 YR and 2.5Y, and to redness ratings close to 0. Figure 4 compare the 95% confidence intervals of prediction of WLG (IWLG0.95) associated to H° and RR
colour variables. A shown by this figure, there is a zone of maximal uncertainty for
WLG (IWLG0.95 = 100) around the identified thresholds, in the upcurve zone of the
logistic curves. 0 10 20 30 40 50 60 70 80 90 100 0 50 100 150 200 250 H° WL G % Observed mean WLG Model
95 % conf. error margins of prediction of WLG
Correspondence, between Munsell Hue and angular Hue H°: H°27 36 45 54 63 72 81 90 126 162 234, H Munsell
7.5R 10R 2.5YR 5YR 7.5YR 10YR 2.5Y 5Y 5GY 5G 5B
Figure 2 WLG = f (H°) relationship and 95% confidence error margins of prediction.
0 10 20 30 40 50 60 70 80 90 100 -15 -10 -5 0 5 10 15 RR WL G % Observed mean WLG Model
95 % conf. error margins of prediction of WLG
Figure 3 WLG= f (RR) relationship and 95% confidence error margins of prediction.
150 200 250 0 10 20 30 40 50 60 70 80 90 100 IW LG 0. 95 % H° -10 -5 0 5 10 15 20 RR H° model RR model 50 100 0
Discussion
From the weak variations of the annual waterlogging rates, one can consider that the results obtained during this study are similar to those that would be obtained for a longer period of readings. However, among the soil colour variables that we tested, only some are potential indicators of the duration of waterlogging, and certain restrictions should be stressed.
The lack of any link between chroma (Cphase1 et C ) and mean annual soil
waterlogging rate could be explained by the fact that chroma is only connected with the degree of saturation of the colours, so that soil materials of the same chroma may have different spectral reflectances due to a wide range of mineralogical compositions and hydrological conditions. The fairly weak link between Munsell value and mean annual soil waterlogging rate may reflect a combination of relationships: although the results suggest a tendency for the materials to pale as groundwater leaches out minerals, this tendency could be partly masked by the effects of organic matter on Munsell value, as mentioned by Schulze et al. (1993).
The logistic regression models based on angular hue and redness rating variables are best suited to predicting mean annual soil waterlogging rate. This confirms that there is a link between these colour variables, the mineralogical form of iron present in the materials, and the hydration or oxidation-reduction conditions produced by waterlogging. Moreover, the results show that it is preferable to take into account the colors of all the phases. Waterlogging is always very rare in materials redder than 10 YR, and it is nearly permanent in materials greener than 2.5 Y. However, 48% (1-r2=0.48) of total variations in WLG are still not explained, and there is a maximal
uncertainty in prediction of WLG for the SVs whose hue is close to 10 YR and redness ratings is close to 0. Several causes could be involved: i) their constituents may be only weakly sensitive to variations in mean annual soil waterlogging rate; ii) some of them, as “fossil volumes”, may have colour which is not be linked to present-day hydrological conditions. Some of the dispersion of the curves may also be due to imprecision or bias introduced by the methods used to estimate colour, such as colour measurement on dry samples, colour assessment with Munsell colour plates, and estimation of the relative volumes of different uncemented phases. These methods migh, be improved by measuring colour on-site with a colorimeter (Trouvé, 1991), or by quantifying more precisely the relative volumes of the uncemented phases.
Conclusion
The results of this survey show that the mean angular hue and mean redness rating of a soil are significantly linked to its mean annual soil waterlogging rate, by logistic functions. These colour variables are therefore easily-obtained potential indicators of the annual duration of soil waterlogging. However, for a variety of reasons (stability of certain colours, presence of fossil soil structures formed under waterlogged conditions, method of measuring colour variables and mean annual soil waterlogging rate), the models established have proven imprecise for Munsell hues of 10YR to 2.5Y and redness ratings of about 0. In knowledge of these limits, it should be possible to apply the logistic models based on these colour variables to other situations in the biophysical environment of this study. It must be borne in mind that these models concern only hillsides with parent material analogous to that of the hillside studied (red ferrallitic
weathering). They assume that there is equilibrium between the soil structures and the hydrological behaviour of the hillside. They cannot, therefore, predict a recent change in groundwater dynamics in the hillside due, for example, to drainage work.
Acknowledgements
This study was conducted as part of a joint program between IRD (ex. Orstom) and the National Institute of Soils, Togo. The experimental site was provided by CIRAD. Our special thanks to A. Forget and R. Mawussi for their valuable help in the field.
References
Baillargeon, G. 1989. Probabilités, Statistique et Techniques de Régression, pp. 401-428. In S.M.G., Trois-Rivières (ed.).
Beaudou, A.G. 1977. Note sur la quantification et le langage typologique. Cah. Orstom, Sér. Pédol. 15(1):35-41.
Beven, K. and M.J. Kirkby. 1979. A physically based, variable contributing area model of basin hydrology. Hydrological Sciences Bull. 24:43-69.
Blavet, D. 1996. Hydropédologie d'un bassin versant représentatif d'un paysage sur socle granito-gneissique d'Afrique de l'ouest (Togo). Relations avec le comportement d'une plante cultivée. Thèse de doctorat, Univ. Montpellier II. 236 p. Blavet, D., E. Mathe and J.C. Leprun. 2000 Relations between soil colour and
waterlogging duration in a representative hillside of the West African granito-gneissic bedrock. Catena 39:187-210.
Boulet, R. 1974. Toposéquences de sols tropicaux en Haute-Volta. Equilibres dynamiques et bioclimatiques. Thèse Univ. Strasbourg. 330 p.
Chatelin, Y. 1976. Une épistémologie des sciences du sol. Thèse Univ. Dijon. 151 p. Chauvel, A. 1977. Recherches sur la transformation des sols ferrallitiques dans la zone
tropicale à saisons contrastées. Coll. Trav. et Doc. Orstom No.62. Paris, 532 p. Chauvel, A. and G. Pedro. 1978. Genèse des sols beiges (ferrugineux tropicaux lessivés)
par transformation des sols rouges (ferrallitiques) de Casamance (Sénégal). Cah. Orstom, Sér. Pédol. 16(3):231-249.
Chevallier, P. 1988. Complexité hydrologique du petit bassin versant. Exemple en savane humide : Booro-Borotou (Côte d'Ivoire). Thèse Univ. Montpellier. 342 p. Depraetere, C. 1992. Demiurge 2.0. Chaîne de production et de traitement de modèles
numériques de terrain. Coll. Logorstom, Paris. 198 p.
Engman, E.T. and R.J. Gurney. 1991. Remote sensing in hydrology. Remote sensing applications, Chapman and Hall 225 p.
Evans, C.V. and D.P. Franzmeier. 1986. Saturation, aeration and color patterns in a toposequence of soils in north-central Indiana. Soil Sci. Soc Am. J., 50:975-980. Evans, C.V. and D.P. Franzmeier. 1988. Color index values to represent wetness and
aeration in some Indiana soils. Geoderma 41:353-368.
Faure, P. 1975. Les associations de sols rouges et jaunes au nord-ouest Dahomey. Caractères des sols et des séquences. Cah. Orstom, Sér. Pédol. 13(2):119-157. Franzmeier, D.P., J.E. Yahner, G.C. Steinhardt and H.R. Sinclair. 1983. Color patterns
Fritsch, E., P. Chevallier and J.L. Janeau. 1990a. Le fonctionnement hydrodynamique du bas de versant, pp.185-206. In Structure et fonctionnement hydropédologique d'un petit bassin versant de savane humide. Coll. Etudes et thèses Orstom, Paris. Fritsch, E, C. Valentin, P. Morel and P. Leblond. 1990 b. La couverture pédologique:
interaction avec les roches, le modelé et les formes de dégradation superficielles, pp. 37-57. In Structure et fonctionnement hydropédologique d'un petit bassin versant de savane humide. Coll. Etudes et thèses Orstom, Paris.
Fritsch, E. 1993. Organisation et fonctionnement de systèmes sols en zone de contact forêt-savane du milieu tropical ouest africain. (Booro Borotou, Côte d'Ivoire). Coll. Etudes et thèses Orstom, Paris. 176 p.
Grandin, G. 1976. Aplanissements cuirassés et enrichissements des gisements de manganèse dans quelques régions d'Afrique de l'ouest. Coll. Mémoires Orstom 82, Paris 276 p.
Jeanroy, E., J.L. Rajot, P. Pillon and A.J. Herbillon. 1991. Differential dissolution of hematite and goethite in dithionite and its implication on soil yellowing. Geoderma 50:81-94.
Jolivet, E. 1983. Introduction aux modèles mathématiques en biologie. Coll. Actualités Scientifiques et Agronomiques INRA, No. 11. Masson, Paris. 151 p.
Langsholt. 1994. Water balance modelling in lateritic terrain. Hydrological Processes 8:83-99.
Lelong, F. 1966. Régime des nappes phréatiques contenues dans les formations d'alté ration tropicale. Conséquences pour la pédogenèse. Sciences de la Terre (2), Fond. Scient. Géol. et App., Nancy. pp. 201-244.
Leprun, J.C. 1979. Les cuirasses ferrugineuses des pays cristallins de l'Afrique occidentale sèche. Genèse-Transformations-Dégradation. Thèse Univ. Strasbourg and Sci. Géol. Strasbourg, 58. 253 p.
Levêque, A. 1975. Pédogenèse sur le socle granito-gneissique du Togo. Différenciation des Sols et Remaniements Superficiels. Thèse Univ. Strasbourg. 301 p.
Munsell, A.H. 1946, A Color Notation, Munsell Color Co., Baltimore MD.
Munsell Color co, 1976. Munsell Book of Color. Matte Finish Collection, Baltimore Md.
Mokma, D.L. and D.L. Cremeens. 1991. Relationships of saturation and B horizon colour patterns of soils in three hydrosequences in south-central Michigan, USA. Soil Use Manage. 7:56-61.
Mokma, D.L. and S.W. Sprecher. 1994. Water table depths and color patterns in soils developed from red parent materials in Michigan, USA. Catena 22:287-298.
Poss, R. and C. Valentin. 1983. Structure et fonctionnement d'un système eau-sol-végé tation: une toposéquence ferralitique de savane (Katiola-Côte d'Ivoire). Cah. Orstom, Sér. Pédol. 20(4):341-360.
Poss, R., B. Roussel and E. Jallas. 1990. Relations entre les caractères du milieu et les espèces ligneuses au Nord-Togo. Rev. Ecol. (Terre Vie) 45:7-24.
Schulze, D.G., J.L. Nagel, G.E. Van Scoyoc, T.L. Henderson and M.F. Baumgardner. 1993. Significance of organic matter in determining soil colors, pp. 71-90. In Soil Color, Soil Sci. Soc. Am. Spec. Pub. No. 31. Madison.
Schwertmann, U. 1993. Relations between iron oxides, soil color, and soil formation, pp. 51-69. In Soil Color. Soil Sci. Soc. Am. Spec. Pub. No. 31. Madison.
Segalen, P. 1969. Contribution à la connaissance de la couleur des sols à sesquioxydes de la zone intertropicale : sols jaunes et sols rouges. Cah. Orstom, Sér. Pédol. 7 (2):225-236.
Smith, M.C., G. Vellidis, D.L. Thomas and M.A. Breve. 1992. Measurement of water table fluctuations in a sandy soil using ground penetrating radar. Trans. ASAE. 35 (4):1161-1166.
Thompson, J.A. and J. Bell 1996. Color index for identifying hydric conditions for seasonally saturated mollisols in Minnesota. Soil Sci. Soc. Am. J. 60:1979-1988. Torrent, J., U. Schwertmann and D.G. Schulze. 1980. Iron oxide mineralogy of some
soils of two river terrace sequences in Spain. Geoderma 23:191-208.
Torrent, J., U. Schwertmann, H. Fechter and F. Alferez. 1983. Quantitative relationships between soil color and hematite content. Soil Science 136(6):354-358.
Trouvé, A. 1991. La mesure de la couleur. Principes, technique et produits du marché. Afnor-Cetim. 193 p.
USDA. Soil Survey Staff. 1975. Mottles that have chroma of 2 or less. In Soil Taxonomy A Basic System of Soil Classification for Making and Interpreting Soil Surveys. Agriculture Handbook 436:48-49.
Vizier, J.F. 1974a. Recherche de relations morphogénétiques existant dans un type de sé quence de sols hydromorphes peu humifères au Tchad. 1ère partie: etude des caractères morphologiques et analytiques des sols de la séquence de Gole. Cah. Orstom, Sér. Pédol. 12(2):171-206.
Vizier, J.F. 1974b. Recherche de relations morphogénétiques existant dans un type de sé quence de sols hydromorphes peu humifères au Tchad. 2ème partie: dynamique de l'eau et du fer dans les sols de la séquence. 3ème partie: conclusions sur l'évolution actuelle des sols et hypothèse sur la formation de la séquence. Cah. Orstom, Sér. Pedol. 12(3):211-266.
Vizier, J.F. 1984. Les phénomènes d'hydromorphie en régions tropicales à saisons contrastées. Application à une meilleure caractérisation des concepts de gley et de pseudogley. Science du Sol. Bull. AFES. 3:225-238.
Vizier, J.F. 1992. Eléments pour l’établissement d’un référentiel pour les solums hydromorphes, pp. 193-207. In Référentiel Pédologique. Principaux Sols d’Europe. Coll. Techniques et Pratiques, INRA, Paris.
Worou, S. 1988. Les nappes perchées semi-permanentes: bien les connaître pour mieux les utiliser. Comm. 97 Réu. Cor. des sols. FAO Cotonou 14-23 Nov. 1988. Rapp. FAO 63:202-207.