Design of Motor Controller Water Cooling System
for a Formula SAE Electric Racecar
by
Ash Demir
Submitted to the
in partial fulfillment of the requirements for the degree of
Bachelor of Science in Mechanical Engineering
at the
MASSACHUSETTS INSTITUTE OF TECHNOLOGY
June 2019
@
Massachusetts Institute of Technology 2019. All rights reserved.
Signature redacted
A uthor ...
May 17, 2019
Certified by...
Signature redacted
John H. Lienhard V
atif Jameel Professor of Water
Thesis Supervisor
Signature redacted
A ccep ted by ...
MASSACHUSETTS INTTTE OF TECHNOLOGYJUL 16 2019
LIBRARIES
Maria Yang
Professor of Mechanical Engineering
Unergraduate Officer
0
Qi)Design of Motor Controller Water Cooling System for a
Formula SAE Electric Racecar
by
Ash Demir
Submitted to the
on May 17, 2019, in partial fulfillment of the requirements for the degree of
Bachelor of Science in Mechanical Engineering
Abstract
This thesis explores the design of a water cooled cold plate system for motor controller used in an FSAE Electric racecar. Models for pressure drop and rate of heat transfer along with the constuction of Computational Fluid Dynamics (CFD) simulations are presented to predict the pressure drop and heat transfer rate. The goal is to provide a framework to design cold plates for motor controllers, along with any other components that generate heat, such as the vehicle battery. A test bench is constructed to validate the results of the models used. Preliminary results show that while such models are useful in understanding the fundamental relationships between different variables and the properties of the flow, it is difficult to construct a model that predicts pressure losses reliably using introductory material on thermodynamics and heat transfer.
Thesis Supervisor: John H. Lienhard V Title: Abdul Latif Jameel Professor of Water
Acknowledgments
I first would like to thank Prof. Betar Gallant for teaching 2.006: Thermal-Fluids
Engineering II. Her presence and genuine excitement about the subject every day in class got me curious and interested in the subject enough to volunteer to take on this project and the water cooling system of the MY19 battery.
The Edgerton Center has provided a great work space for MIT Motorsports and made anything we might need available. I am very thankful for all of the resources they have provided us with and the opportunity to build a car from ground up every year. I also want to thank the group of people I worked with within the team, Zoe Levitt, Harriet Chiu and Annetoinette Figueroa for teaching me and learning with me as we tried to establish the framework for something that the team has not tried before. Special thanks to Ethan Perrin for his patience and what seems like an infinite source of wisdom in machining, sealing, electronics, fasteners... essentially about how any two components should go together.
Contents
1 Introduction 13
1.1 FSAE Competition ... 13
1.2 MY19 ... ... 14
1.3 Thesis Scope. ... ... 14
2 Cold Plate Design Background 17 2.1 Functional Requirements . . . . 17
2.1.1 Heat Transfer Estimations . . . . 17
2.1.2 Pressure Drop Estimations . . . . 19
2.2 Cold Plate Construction . . . . 20
2.3 C F D . . . . 20
2.3.1 Pressure Drop Simulation . . . . 21
2.3.2 Heat Transfer Simulation . . . . 22
2.4 Consideration of Heat Fins . . . . 23
3 Experimental Setup 27 3.1 P rocess . . . . 27
3.2 Pressure Drop Measurement . . . . 28
3.2.1 Calibration . . . . 29
3.3 Rate of Heat Transfer Measurement . . . . 30
4 Results & Discussion 33 4.1 Pressure Drop . . . . 33
4.2 Heat Transfer . . . . 36
5 Conclusion and Future Work 37
5.1 Pressure Drop Model . . . . 37
List of Figures
1-1 MY18 at the Formula SAE Electric 2018 Competition in Lincoln, Ne-braska. . . . . 14
2-1 Power draw of MY18 during the endurance event. At about 5th lap, which is around 600 seconds in, power limiting is turned on. . . . . . 18
2-2 a) Cold Plate with S-Channel Geometry. . . . . 20
2-3 Exploded view of cold plate. Quick disconnect fittings thread into the cold plate lid and sit flush to the internal surface of the lid, perpendic-ular to the direction of flow in the cold plate . . . . . 21 2-4 HV box with cold plates highlighted in blue. Motor controllers sit on
the cold plates. . . . . 21
2-5 Pressure Drop CFD Cut Plot with 8LPM Flow Rate. . . . . 22
2-6 Pressure Drop vs Volumetric Flow Rate for the S-Channel Geometry. 23
2-7 Heat Transfer CFD Cut Plot with 8 LPM flow rate. . . . . 24
2-8 Channel cross sections considered with dimensions labeled. Channel is 480mm long. a) Channel with no fins. b) Longitudinal fins . . . . 25 2-9 a) Rate of heat transfer vs volumetric flow rate for smooth channel and
finned channel. b) Pressure drop vs volumetric flow rate for smooth channel and finned channel. . . . . 26
3-1 Bench setup schematic for cold plate testing . . . . 28 3-2 Test bench setup . . . . 29
3-3 Calibration numbers. These values reflect the pressure drop of the system in between the measurement points without any component inserted . . . . 30
3-4 Pressure drop across one set of quick disconnect fittings. . . . . 30 3-5 O utlet tee . . . . 31
4-1 Pressure drop vs volumetric flow rate for the U-Channel and S-Channel geom etries . . . . 34 4-2 Pressure drop results compared with CFD and head loss equation
es-tim ations . . . . 34 4-3 Pressure drop results compared with CFD and head loss equation
es-tim ations . . . . 35
4-4 Pressure drop using the head loss equation with a minor loss coefficient
List of Tables
2.1 Values and constants used in first order estimations . . . . 19
4.1 Pressure Drop in fittings at 10 LPM. . . . . 35
1
Introduction
1.1
FSAE Competition
Formula SAE is an engineering design competition started by the society of Au-tomotive Engineers. In this competition, student teams design and build a race car to perform in various events in static and dynamic categories. With the addition of an electric component to the competition in 2013, MITs student team switched to developing electric race cars. Electric race cars are vehicles that use rechargeable batteries for energy storage and electric motors for propulsion. [3]
The vehicles compete in three static events: design, cost, and presentation and five dynamic events: acceleration, skidpad, autocross, endurance and efficiency. The performance of each team in these events is scored and used to rank the vehicles. In many of these events, reducing the mass and the volume of the components, which drive the overall car mass, is crucial to score well. Reductions in weight and size both improve car acceleration and push teams to think creatively to shave off weight. Endurance is a 16 lap event in a 22km long track, and is worth almost one third of the total points of the whole competition. Here, the vehicle is pushed to its limit and this event outlines most of the functional requirements of the car such as power and the total energy stored in the battery.
Figure 1-1: MY18 at the Formula SAE Electric 2018 Competition in Lincoln, Ne-braska.
1.2
MY19
Model Year 19 has one rear motor and two front motors, each driven by their own motor controller. Given the volume and mass constraints, we decided to repackage the Bamocar D3 motor controllers used for the front motors to reduce mass and size to score higher in the design event and perform better in the dynamic events. These motor controllers, like any other, are not completely efficient and generate heat as they operate. It is crucial to dissipate this heat to ensure that the temperature of the motor controllers stay below their specifications. To keep an adequate heat transfer rate, we decided to construct use a water cooling system for the motor controllers.
1.3
Thesis Scope
The larger goal is to design the smallest and lightest cold plates to regulate the temperature of the two BAMOCAR D3 motor controllers driving the two front motors to maintain operation. The low weight goal, along with the specifications of the motor controllers, shape the constraints for the cold plate design. The functional
requirements for the cold plates become to ensure an adequate rate of heat transfer to maintain a steady state temperature below 45'C and to minimize the pressure drop across the cold plate to keep the pump required small. Rate of heat transfer required to maintain a steady state condition is estimated from the power the vehicle outputs to the wheels and dissipates as heat during an endurance run, the most demanding dynamic event in the competition. Some water channel geometries were determined using the head loss equation. Solidworks CFD models were constructed to validate pressure drop results and to identify hot sections in a heat transfer scenario. A test bench was constructed to measure cold plate performance, as reflected in their heat transfer rate and pressure drop to validate analysis and CFD results.
2
Cold Plate Design Background
Most examples of electronics water cooling systems on the market use a cold plate, a solid, thermally conductive medium to transfer heat between the heat source and the liquid. The two important factors in selecting a channel geometry are heat transfer rate, whether enough of the power dissipated in the motor controllers during operation can be transferred to limit their temperature, and pressure drop, whether the pump in the system can circulate water at the desired flow rate.
2.1
Functional Requirements
2.1.1
Heat Transfer Estimations
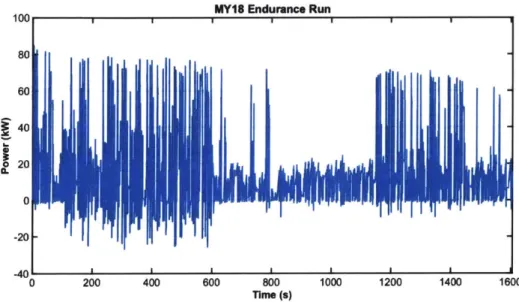
For the BAMOCAR D3 motor controllers we decided to use to drive our two front motors, the cooling requirement comes from its operational temperature range. To shape the functional requirements for the cold plates, the power output of MY18 during the endurance event and the efficiency of the motor controller were utilized to estimate the heat generation rate. According to Figure 2-1, the car outputs an average of 30 kW of power, with a peak of 80 kW. The motor controller efficiency reported on the Bamocar reference sheet is 92%.For MY18, the power draw is expected to be similar to that of MY18 with the power split between the front and rear motors of 24.12% front and 75.88% rear. These show that the average heat generation rate is
290W for each of the two front motor controllers with a peak of 770 W heat generation
rate at peak power draw of 80 kW. From here the energy equation is used to determine
the inlet and outlet temperatures of the cooling fluid in the cold plate. The motor
controller lists maximum allowable temperature as 500C with operating temperature
range from 00C to 45*C.
151
MYIS Endurance Run
I
IAf I f I I 1 1 1 1 1 1
0 200 400 600 800
Time (s) 1000 1200 1400 1600
Figure 2-1: Power draw of MY18 during the endurance event.
which is around 600 seconds in, power limiting is turned on.
At about 5th lap,
Heat transfer rate of water depends on mass flow rate, and the temperature
dif-ference between the hot and cold mediums. As the temperature difdif-ference increases,
the heat transfer rate increases. To reach a steady state, the water that exists the
cold plate must be cooled down to its inlet temperature before it enters the system
again. For any of the components in the cooling loop, the temperature of the fluid at
the inlet and outlet thermal energy lost or gained is calculated using the conservation
of energy principle:
Q
= pV cC(Tou - Tn)(2.1)
[6]
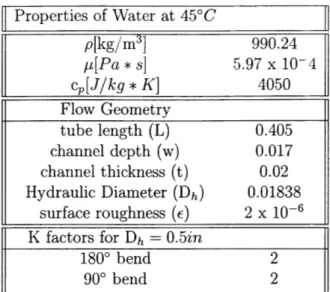
Properties of Water at 450C p[kg/m3] 990.24 p[Pa * s] 5.97 x 10⁻⁴ c[J/kg *K] 4050 Flow Geometry tube length (L) 0.405 channel depth (w) 0.017 channel thickness (t) 0.02 Hydraulic Diameter (Dh) 0.01838
surface roughness (E) 2 x 10⁻⁶ K factors for Dh = 0.5in
180' bend 2
900 bend 2
Table 2.1: Values and constants used in first order estimations
2.1.2
Pressure Drop Estimations
Initially two simple paths, a U-shaped channel and an S-shaped channel were considered as water channel geometries. First order pressure drop estimations were done using the head loss equation using the hydraulic diameter of the cold plate, 0.018m, to calculate velocity:
Lv2 V2
AP = p[f2D + Ktotai (2.2)
where the friction factor in the turbulent regime is calculated according to the Haaland Equation:
1 -1.81og[ 6.9 ( ) (2.3)
f1/
2 ReD3.7
With Reynold's Number:
ReD - pvDh (2.4)
P
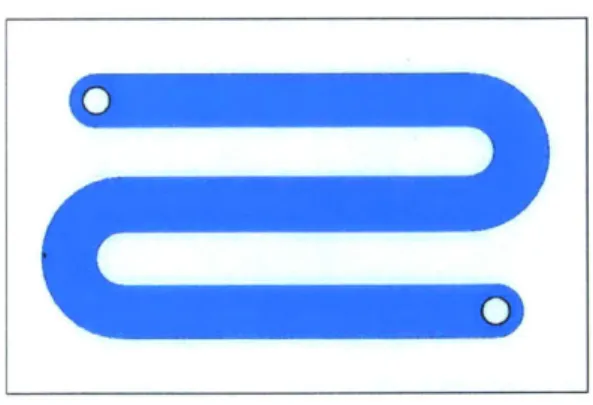
Figure 2-2: a) Cold Plate with S-Channel Geometry.
2.2
Cold Plate Construction
The cold plates consist of two aluminum plates, one with a milled channel and one
as a lid, that bolt together and seal with an o-ring. The location and the footprint
of the cold plates are constrained by the power electronics. They bolt under the
Bamocar D3 motor controllers in the high voltage electronics box and are attached
to the rest of the cooling loop with quick disconnect hose fittings.
2.3
CFD
For a more in-depth analysis of the effect of different geometries on pressure drop
and rate of heat transfer, computational fluid models were preferred. SolidWorks
Flow Simulation was used to get an understanding of how channel geometry and
dimensions affect pressure drop and heat transferred to the fluid. Initial channel
geometries simulated were U-channel and S-channels of varying shapes and hydraulic
diameters.
Bottom Plate
Bolts to in controlle
Figure 2-3: Exploded vi
cold plate lid and sit fl
Lid
3
otor rew
ish
a
33I
Quick Disconnect Hose Fittings 0-ring groove Water ChannelBolts connect top and bottom plates
I
f cold plate. Quick disconnect fittings thread into the
to the internal surface of the lid, perpendicular to the
direction of flow in the cold plate.
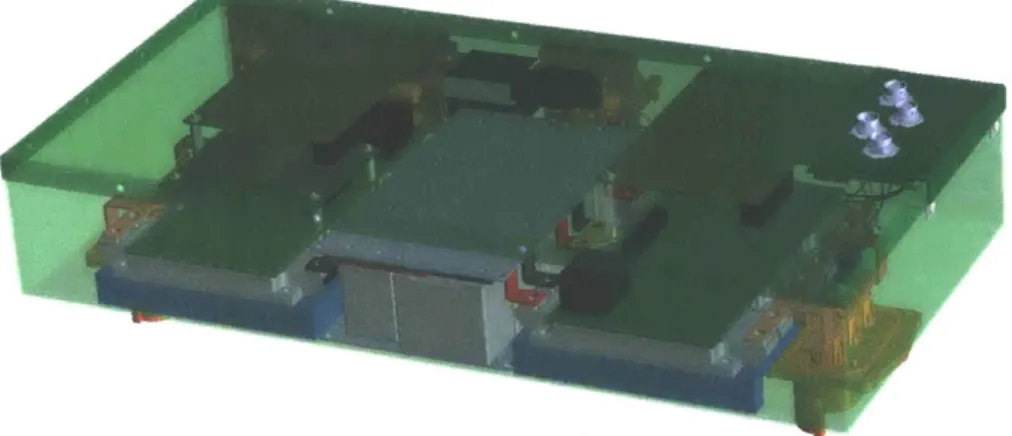
Figure 2-4: HV box with cold plates highlighted in blue. Motor controllers sit on the
cold plates.
2.3.1
Pressure Drop Simulation
The fluid simulated is water at 450C. The surface roughness of the walls are
lence length and turbulence intensity are determined empirically. The initial
turbu-lence length was set as 0.02m, the width of the channel in the cold plate and intensity
as 18%, at the advice of Prof. Pierre Lermusiaux. With a mesh size of 0.0001m, these
parameters were changed until the pressure drop results started converging. The final
values used were for 0.02m turbulence length and for 18.65% turbulence intensity. A
control simulation was constructed to verify these results by comparing them to first
order estimations. Flow through a simple cylindrical pipe with the same diameter as
the channel hydraulic diameter, and similar turbulence length and intensity values
were set up at a volumetric flow rate of 8 LPM. The CFD and head loss equation
calculation were 89.46Pa and 89.62Pa respectively.
104731.91 104697.93 104463.96 104329.99 1 041 96.00 104062 .02 103929.04 103794.06 1036160.08 103626.11 103392.13 103258.15 103124.17 102990.19 102656.21 102722.23 102696.26 Pressure [pal
Cut Plot I c-ontouib
Cut Plot 0: cortours
4- 4-. ~- ~ .4- .4- .4~ .4 -.4-. :t-.4. *. -5 .5 W 5, -. - . .41. .l. .0 . f
* t
N 1~ ~
~
~
4 -4~
~
W V'~ 4- NA,- 4- 4 tiFigure 2-5: Pressure Drop CFD Cut Plot with 8LPM Flow Rate.
2.3.2
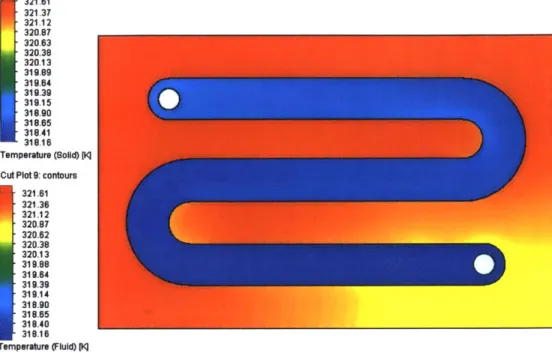
Heat Transfer Simulation
To simulate the heat transfer case, I added a temperature constraint to the top
after the flow and pressure drop were set up. The simulation and the hand
calcula-tions in this case match because the energy conservation equation is not as complex
as water flow. These simulations also do not take junction resistance into account so
5000 0 Head Loss Equation 0 CFD 4000 3000
*
*
0 2000 U,0
0~0 1000 0S
0 3 4 5 6 7 8 9 10Volumetric Flow Rate [LPM]
Figure 2-6: Pressure Drop vs Volumetric Flow Rate for the S-Channel Geometry.
they match the hand calculation estimations in their set-up. The total rate of heat
transfer is 0.3 kW. Simulations assume all external walls are adiabatic. Flow rate is
kept constant across all at 5.7 LPM. This is the maximum flow rate of Wakefield-Vette
Cold plates. Initially, we wanted to benchmark with off-the shelf components before
we determined our own volumetric flow rate through testing, validation and iteration.
Because the heat load is small, all simulated geometries can achieve this heat transfer
rate with inlet temperature 318.15*K and the outlet temperature about 319.15*K.
But the channel geometries result in different hot spots in the solid. So the
impor-tant aspects here are the maximum temperature of the plate and the temperature
distribution through cut plots to evaluate how evenly the heat transfer occurs.
2.4
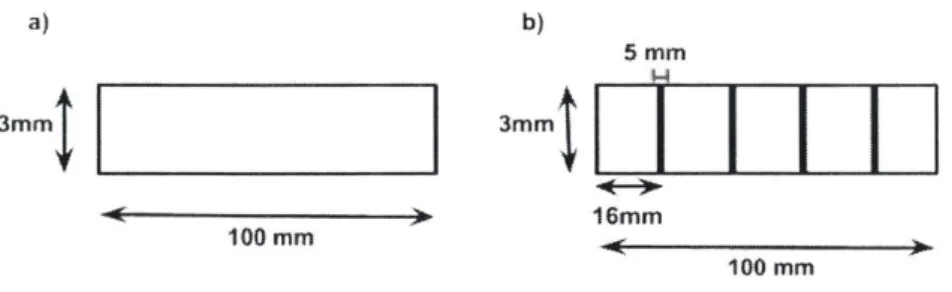
Consideration of Heat Fins
In parallel, the heat transfer performance of heat fins were investigated. While
the liquid can be channeled in a smooth heat exchanger like a duct, heat fins can
be used to increase heat transfer rate. These fins can come in different shapes like
321.61 321.37 321 .12 320.97 320.63 320.38 320.13 319.9 319.64 319.39 319.15 319.90 319.65 319.41 319.16 Temperature (lid) Pq Cut Plot 9: contours
321 .61 321.36 321.12 320.97 320.62 320.39 320.13 319.88 319.64 319.39 319.14 318.90 318.65 319.40 318.16 Temperature (Fluid) Ji Cu Plot 10: contours
Figure 2-7: Heat Transfer CFD Cut Plot with 8 LPM flow rate.
rectangular fins that extend parallel to the duct, or as pin fins. Introducing these
fins also change how the water flows, so they change the pressure drop across the two
ends of the channel.
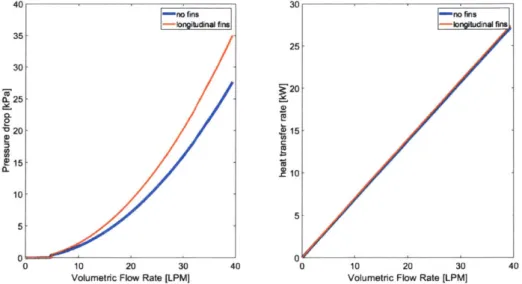
In these estimations we explored how much heat transfer capability the fins added
to the system, and how they would affect the pressure drop across the channel. Initial
estimations were done for longitudinal fins with a channel cross section illustrated in
2-8.
The following assumptions were made to simplify the model:
* Steady state conditions at the maximum allowable motor controller
tempera-ture, 450C. This also gives us the water inlet and outlet temperatures, 450C
and
46*C.
* Incompressible water flow.
b)
5 mm
3mm 1
16mm
100 mm
Figure 2-8: Channel cross sections considered with dimensions labeled. Channel is 480mm long. a) Channel with no fins. b) Longitudinal fins
are neglected because this was a quick first order estimation.
* Geometry is straight, rectangular pipe with no minor losses.
o The motor controllers only exchange heat with the fluid in the duct. No con-vection with air occurs.
In a MATLAB script, related constants were calculated to classify the fins and the heat transfer rate and pressure drop were calculated for a mass flow rate from 0.1 to 1m3
/s
, which is 0.6 LPM to 60 LPM for water.a)
3mm
100 mm io I
40 0.25 S20 2 215 10[ n 0 10 20 30
Volumetric Flow Rate [LPM]
25 20 15 210 5 01 0 0 10 20 30
Volumetric Flow Rate [LPM]
Figure 2-9: a) Rate of heat transfer vs volumetric flow rate for smooth
finned channel. b) Pressure drop vs volumetric flow rate for smooth
finned channel.
channel and
channel and
40 30-03
Experimental Setup
A test bench was constructed to monitor the two design parameters, the pressure
drop and the heat transfer rate of the manufactured cold plates. Various sensors were placed across the water loop on the bench.
3.1
Process
The test bench consists of a built-in water loop with a reservoir and a heating element in the reservoir to conduct tests at the temperature conditions of Lincoln, Nebraska, where the competition is held. A 12V diaphragm pump pumps water
exiting from the reservoir across the loop. A flowmeter placed downstream measures the volumetric flow rate and is used to set the flow rate of the water loop. The loop is interrupted with two female ended quick disconnect fittings with pressure and temperature measurement occurring upstream of the first and downstream of the second (Appendix A). These fittings allow for different cooling loop components like radiators and different cold plates to be switched out easily.
Components can be plugged in to complete the water loop to start testing. When the pump is turned on, water flows through the loop. The volumetric flow rate is adjusted by hand by reading out the measurements and changing the pump voltage with a knob on the front panel.
reservoir to simulate the temperature outside during competition. Water temperature is controlled with a temperature controller. Data is taken 5 minutes after changing any of the variables, such as fan speed or type of radiator for the system to reach a steady state. Fill Reservoir
I
Heating Element -0-DrainSous Vide Heater
P T Tedt Coid PNOl
P T
Thermocoo .
I
CSoSerI
SSR
Figure 3-1: Bench setup schematic for cold plate testing P: Pressure gauge
T: Thermocouple F: Flowmeter
3.2
Pressure Drop Measurement
The pressure drop across the component and the two quick disconnect fittings is measured by two pressure gauges, placed before and after the cold plate.
Test cold plate
Heater at 45*C 41
- Stock cold
plate at 451
Temperature Flow meter
controller Reservoir
Thermocouple reader
Pressure gauges
Figure 3-2: Test bench setup
3.2.1
Calibration
The cooling loop on the test bench itself has major and minor losses due to tubes,
fittings, valves and bends in the loop. Before any component was attached to the
loop, the pressure drop across the two pressure gauges was measured by completing
the loop with a short tube. These measurements were made at flow rates from 1LPM
to 10 LPM with 1 LPM increments. To determine the pressure drop across any
component placed, the calibration value at the corresponding flow rate is subtracted
from the pressure difference measured on the gauges. [I]
The test bench has two sets of quick disconnect fittings between the two points
of pressure measurement. These fittings thread in directly to the cold plate at a
90"" angle with the directiong of water flow in the cold plate. The pressure drop
data for the quick disconnects are provided by the manufacturer, Koolance. As these
fiitings are the biggest source of pressure loss in the calibration system, the calibration
measurements are close to two times the pressure drop of one set of quick disconnect
fittings. For example at 6 LPM, the pressure drop of one fitting is reported to be 1
psi, and the pressure drop of the test bench at 6 LPM is 2.75 psi. [41
Test Bench Pressure Drop
12 0I
I
01 0
S
10 12 14 4 6 8Volumetric Flow Rate [LPM]
Figure 3-3: Calibration numbers. These values reflect the pressure drop of the system in between the measurement points without any component inserted
QD3
6 5 03 2 0 0 2 4 6 8 10 12 14 16 Flow Rate (LPM)Figure 3-4: Pressure drop across one set of quick disconnect fittings.
3.3
Rate of Heat Transfer Measurement
Rate of heat transfer is estimated using the temperature at the inlet and outlet of the cold plates, along with the volumetric flow rate and thermal properties of water at given temperature, using the energy equation
0 14 2 0 2 0 2
so
Q
= P Cp(Tou-
Tin)Because of the sensor and heater locations in the reservoir, at flow rates less than
3LPM, water would start boiling in the reservoir so no measurements were taken at
this range. Temperature at the inlet and outlet points are measured with K-type
thermocouples with a thermocouple reader.
Water In (from com onent outlet)
Water out (to reservoir Inlet)
Pressure gauge (Pout)
thermocouple
Figure 3-5: Outlet tee
Figure 3-5 illustrates the pressure and temperature measurement point at the cold
plate outlet. Water from the cold plate outlet enters a cross fitting from the top and
exits at a
900
bend. At one end of the cross fitting is an NPT threaded pressure gauge
and at the other is an NPT threaded thermocouple probe. The probe contacts the
water directly and is 50 mm long. The inlet tee is constructed in a similar way.
(3.1)
4
Results & Discussion
Goal of this project was to design the most compact cold plate that regulates the temperature of the two Bamocar D3 motor controllers driving the two front wheels.The two design parameters that shape the design were the heat transfer rate required to keep the motor controller temperature below 500C and the pressure drop across the cold plate.
4.1
Pressure Drop
Using the test bench, the pressure drop across the inlet and outlet at varying volumetric flow rates were measured. The experiment was repeated for two channel geometries of equal hydraulic diameters: U-channel and S-channel.
The results show that while the U-channel has fewer minor losses due to the number of 1800 bends, it overall had a higher pressure drop. The results are very close to each other at every point of measurement, so no conclusion about the effect of geometry on presure drop could be made. Considering that the S-channel allows for a more even temperature distribution across the plate surface because the channels are closer together, following experiments used the S-channel cold plate.
When compared with the first order estimates and CFD results, the pressure drop is much higher than predicted. In the light of these results, first order estimates were revisited to explain this discrepancy. The first theory considered was the effects of
CL 0O e-% 125 100 75 50 25 S * U-Channel * S-Channel 0 0 S 0 S
S
0-Volumetric Flov, Pate [LPM]
Figure 4-1: Pressure drop vs volumetric flow rate for the U-Channel and S-Channel
geometries
*1~ 0. 0 U5 4' 125000 100000 75000 50000 250007T
f
* Head Loss Equon
* CFD * test resuits
i
I X o ^ A * a a a 3 4 5 6 7 8 9 10Vokznetric Flow Rate [LPM)
Figure 4-2: Pressure drop results compared with
mations
CFD and head loss equation
esti-neglected minor losses, such as those in the quick disconnect fittings and bent tnbes
leading to the test plate. Because the calibration accounts for the pressure drop in
the quick disconnect fittings, the only losses not accounted for are those related to
the G fitting between the quick disconnect and the cold plate. The expansion and
contraction of the hydraulic diameter through these fittings cause pressure losses. To
estimate these losses, the sudden expansion and sudden contraction K factor equations are used. Sudden Expansion
Sudden Contraction
KSE =(1 Din )2 DuKsc
=0.42(1
- Din )2Dout
(4.1) (4.2)The velocity at the smallest opening in the region is used to calculate the minor
pressure drop. Table 4.1 suggest that the losses in these regions are 1.5 times higher
than in the cold plate. Although this finding increases the expected pressure drop 2.5
times, it is not enough to match the test results.
Direction
K
Inlet Diameter [m] Outlet Diameter [m] Pressure Drop [Pal
QD to fitting
0.42
0.02
0.013
325.67
fitting to channel
1
0.013
0.018
775.4
channel to fitting 0.42
0.018
0.013
325.67
fitting to QD
1
0.013
0.02
775.4
total
2202.16
Table 4.1: Pressure Drop in fittings at 10 LPM.
CL
125000 100000 75000 50000 25000f
HHead Loss Equatbou
* co
test results Improved Modelj~
1
I X V 0-
Ah h a a a a 3 4 5 6 7 8Volumetric Flow Rate ILPM]
Figure 4-3: Pressure drop results compared with
mations
9 10
esti-Using the hydraulic diameter of the test plate, 0.018m, and the test data, the
minor loss coefficient of the system was calculated. Later this value was used to
calculate the pressure drop of the cold plate using the head loss equation.
125000 0 Head Loss Equation
S CFD
f test results 100000 [ Model with Expansion &
Contraction Losses 0 Model with K-920 75000 0 O 50000 25000 0 3 4 5 6 7 8 9 10
Volumetric Flow Rate [LPM
Figure 4-4: Pressure drop using the head loss equation with a minor loss coefficient
of 920
4.2
Heat Transfer
While the only way to validate if the rate of heat transfer from the motor controller
is satisfactory is to have temperature data from a running car, this data is currently
not available. Instead, a quick test was done to get preliminary results. When the test
cold plate is stacked on top of the stock cold plate with water at
450C
and wrapped in
insulating material, a temperature rise of
0.60Cwas measured between the inlet and
outlet of the test cold plate on the test bench. For water at 8 LPM, the temperature
rise to keep the heat dissipation rate at 290 W, the average heat generation rate, is
0.55*C. With the current s-channel setup, it is possible to satisfy the average heat
dissipation rate, but the cold plate fails to mitigate the temperature of the motor
controller at peak power draw, which requires a temperature rise of 0.72*C across the
cold plate.
5
Conclusion and Future Work
The main takeaway from these results as a member of a Formula SAE team is that it is not possible to rely on introductory models of pressure drop and heat transfer to design and select components. The only way to ensure that the performance of a liquid-cooling component designed in-house satisfies the functional requirements is to test these quantities of the component.
5.1
Pressure Drop Model
This investigation aimed to construct reliable models to predict pressure drop across a cold plate. First order estimations using the head loss equation and the Haaland equation to find the friction factor were used. The friction factor was checked against a Moody chart to validate results. A computational fluid dynamics model was set up using the Solidworks Flow Simulation package. Although both models had the same quadratic trend as the test results in pressure drop across a cold plate at increasing flow rates, neither model was able to match the test results for pressure drop across a cold plate. The head loss equation results were 100 times lower than the test results and the CFD predictions were 25 times lower than the test results. While different sources of minor losses were investigated, these losses are not in within the order of magnitude of the test results. It was concluded that a model based on minor losses in sudden expansion and contraction were not able to predict the losses on the
test plates.
Given the head loss equation's sensitivity to hydraulic diameter and velocity, which also has a dependency on hydraulic diameter, future models could focus on capturing effects of varying hydraulic diameters on the pressure drop across the cold plate setup. Major losses in the short sections of fittings and how these affect the overall pressure drop could be modeled. Another minor loss that was not accounted for in any of the models was the effects flow change in the transition between the outlet quick disconnect fittings to the test bench. Here, the fittings thread in perpendicularly to the flow in the cold plate, so the the water hits the bottom of the cold plate and changes direction. A model was not found in the scope of this work, but this abrupt change in direction coming into the cold plate could be a significant source of pressure
loss.
A K factor for the test bench can be calculated using the pressure loss
mea-surements of the test bench. This value can be used to recalculate pressure losses due to the test bench construction and the placement of pressure drop measurement instruments using the head loss equation.
Bibliography
[1] Harriet Chiu. Design of fsae cooling system, massachusetts institute of technology,
2019.
[2] B. Gallant. 2.006 property data tables, Spring 2018.
[3] SAE International. About formula sae series, [online]. available: https://www.sae.org/attend/student-events/formula-sae-electric/about.
[accessed:15-may-2019], 2019.
[4] Koolance. Qd3 female quick disconnect no-spill coupling, male threaded g 1/4 bspp *black*, [online]. available: https://koolance.com/qd3-fsg4-bk-quick-disconnect-no-spill-coupling-female-threaded-g-1-4-black [accessed: 16-may-2019j, 2019.
[5] Unitek. Manual digital three-phase servo amplifier bamocar-pg-d3. Hans-Paul-Kaysser-Strae 171397 Leutenbach Nellmersbach, FourthEdition, January2018.
[6] Frank M. White. Fluid Mechanics. McGraw Hill Education, University of Rhode
Appendix A
Table A.1: Test Bench Bill of Materials
Single Scale Pressure Gauge with Plas- McMaster Part Number 4089K66 tic Case
High-Temperature Panel-Mount
McMaster Part Number 4215K3 Flowmeter for Water
Jaybva Waterproof K Typer Thermo- UNSOSC Code 41112210
couple
Leaton Digital Thermocouple Meter Part Number CECOMINOD043943 Tester
Koolance Quick Disconnect Part Number QD4-FS13X19-BK QD4 NorthStar NSQ Series 12V On-
Part Number 2683061
Demand Sprayer Diaphragm Pump
Atoplee lpc Stainless Steel Waterproof Model NO.: MR2170-1/2-50 Pt100 Ohm Probe Sensor
Dernord 240V Water Tubular Heater Part Number DN150130 Element
Inkbird Ac 100-240v Digital PID Tem- Part Number ITC-perature Controller 100VH+25ASSR+K+WHHS