Design of an Electronically-Actuated Gas Lift Safety Valve
By
Changkuan Yu
B.S., Stanford University (2011)
Submitted to the Department of Mechanical Engineering in partial fulfillment of the requirements for the degree of
Masters of Science in Mechanical Engineering
ARCHNES
MASSACHUSETTS INST 1tEOF TECHNOLOGY
JUN 2 5 2013
LIBRARIES
at the
MASSACHUSETTS INSTITUTE OF TECHNOLOGY
June 2013
@ Massachusetts Institute of Technology 2013. All rights reserved.
Author ...
Department of Mechanical Engineering May 14, 2013
Certified by... .. ... . . ... .
Franz Hover Fimneccanica Career Development Associate Professor
Thesis Supervisor
Accepted by...
David E. Hardt Graduate Officer, Department of Mechanical Engineering
Design of an Electronically Actuated Gas Lift Safety Valve
By
Changkuan Yu
Submitted to the Department of Mechanical Engineering on May 14, 2013, in partial fulfillment of the
requirements for the degree of
Masters of Science in Mechanical Engineering Abstract
Gas lift valves are widely used in oil production fields to pump recycled gas and nitrogen into the production tubing, to sustain production by aerating the oil and lifting it to the ground or sea surface. Today's industry standard, a pressure-actuated valve, is susceptible to various modes of failure, including corrosion and jamming. Safety mechanisms are needed to seal the valve in case of a backflow event, in which oil flows backward through the production tubing. Since human monitoring
is difficult to implement at deep level underground, these safety mechanisms have to be highly sensitive and autonomous.
This thesis documents the design of an electronically-actuated gas lift safety system that builds on a prior invention based on shape-memory alloy, but, among other features, can handle the slowly changing temperature conditions downhole. The newly-designed control circuit is integrated into the original shape memory alloy (SMA) scheme. The selection criteria and features of various sensors in this circuit are reviewed in relation to oil's physical and chemical characteristics. System functionality is proved through model-scale prototype testing within a controlled environment. At the same time, the system is modeled with heat transfer and structural analysis to predict its behavior in different
environments with air or water, or their mixture with oil. Overall, our concept satisfies many of the key operational needs in artificial gas lift.
Thesis Supervisor: Franz Hover
Acknowledgments
I would like to thank my thesis advisor, Professor Franz Hover, for all his help and guidance in this research project. Thanks to Mr. Eric Gilbertson for laying the groundwork and providing technical consulting throughout this project. I would like to give special thanks to Ike Feitler of the Material Science Department at MIT for the help with setting up the test facility. Mr. Dennis Harris of Chevron helped a lot in providing consulting from the industry, putting us in contact with collaborators and arranging the field visit to the gas lift operation.
This work is supported by Chevron Corporation, through the MIT-Chevron University Partnership Program.
Contents
1. Introduction ... 12
1.1 Petroleum Production ... 12
1.2 Artificial Lift Technology ... 14
1.2.1 Artificial Lift System Overview ... 14
1.2.2 G as Lifting Today ... 17
1.3 Prior Art on Thermally-Actuated Safety Mechanism ... 21
1.3.1 Gas Lift Valve Failure Mode ... 21
1.3.2 Safety M echanism ... 22
1.3.3 Temperature Drift Technical Challenge ... 25
1.4 Thesis O utline ... 27
2. Possible Solutions ... 28
2.1 Chem ical Heating ... 30
2.2 Tracking Transition Temperature ... 32
2.2.1 O verall Strategy...32
2.2.2 Structural D esign ... 33
2.2.3 Therm al D esign ... 35
2.3 Chapter Sum m ary ... 35
3. Electronically-Actuated Safety Mechanism ... 41
3.1 Control Circuit Design ... 43
3.1.1 C ircuit ... 43
3.1.2 Part Selection ... 48
3.1.3 PCB Prototype ... 57
3.2 M echanical Integration ... 59
3.3 Chapter Sum m ary ... 60
4. SM A System M odeling ... 63
4.1 H eat Transfer ... 63
4.2 Structural Strength ... 68
5. Sensor Selection ... 69
5.1 Crude Oil Characteristics ... 69
5.2 Turbidity Sensor ... 70
5.3 Conductivity Sensor ... 73
5.4 Tem perature Sensor ... 74
5.5 Foam Effect ... 77
5.6 Chapter Sum m ary ... 77
6. Survival Test ... 82
6.1 Com ponent Test ... 82
6.2 Chapter Summary... 82
7. System Functionality Test ... 86
7.1 Test Facility... 86
7.2 Test result ... 89
8. SMA Repeatability Test... 91
8.1 Test Facility ... 91 8.2 Test Result... 94 8.3 Chapter Summary ... 94 9. Conclusion... 95 9.1 Summary ... 96 9.2 Future Work... 96
List of Figures
1-1: Energy source distribution around the world ... 12
1-2: Oil production countries, OPEC 2006 ... 13
1-3: US oil import and share of domestic consumption, BP 2012... 14
1-4: All artificial lift technologies, BP 2012 ... 14
1-5: Rod lift system ground facility [32] ... 15
1-6: G as lift system [3] ... 16
1-7: Gas lift valve, Chevron 2009 ... 16
1-8 Gas lift valve cutaw ay [3] ... 17
1-9: Gas lift valve in market, Chevron 2009 ... 18
1-10: Wireline operation, Weatherford 2012 ... 19
1-11: U nloading process [3] ... 20
1-12: Valve failure mode and safety valve [3] ... 21
1-13: Crystal phase change [4] ... 22
1-14: Shape memory transition [4] ... 23
1-15: Dynalloy SM A wire data [11] . .... ... 24
1-16:V alve body [3] ... 24
1-17: Ball valve with SMA [3] ... 25
1-18: W ell tem perature drift ... 29
2-1: Embedded chemical case design ... 29
2-2: Temperature change vs. SMA wire strain ... 30
2-3: Tracking well temperature with SMA wire ... 31
2-4: Axle mechanism to track well temperature ... 32
2-5: Insulated aluminum bar and equivalent thermal resistors ... 35
2-6: Thermal simulation in fast and slow temperature change scenarios... 37
2-7: Thermal simulation with different As, values and ambient change rates... 39
3-1: Temperature strategy in electrical heating ... 41
3-2: Control circuit schem atics ... 40
3-3: Valve body with integrated circuit system ... 44
3-5: Rem ote control version ... 46
3-6: sample pressure wave form in annulus casing ... 47
3-7: 3X large scale polyethylene prototype ... 48
3-8: Charge stage ... 51
3-9: D ischarge stage ... 51
3-10: D ischarge tim e ... 52
3-11: Equilibrium voltage with different voltage divider ... 54
3-12: General use MOSFET, Digikey.com ... 55
3-13: Electronic feature of MOSFET irfl324, Digikey.com ... 56
3-14: PCB schem atics file, 4pcb.com ... 58
3-15: PCB layout file, 4pcb.com ... 58
3-16:PCB prototype assembly, advanced circuit ... 59
3-17: Valve annulus chamber design (VAC) ... 60
3-18: Cross section view of VAC ... 61
4-1: Nusselt number vs. (inclination and Rayleigh number) [5] ... 64
4-2: Heat transfer with constant current ... .. 65
4-3: Heat transfer in air with supercapacitor discharge ... .. 65
4-4: Heat transfer in air with supercapacitor discharge at high ambient temperature... 66
4-5: Heat transfer in water with supercapacitor discharge ... 67
4-6: Increase in A, due to additional initial tension ... 68
5-1: Photoresistor [20] and turbidity test equipment ... 71
5-2: Photoresistor [20] current with light intensity under controlled voltage... 71
5-3: Turbidity test with photoresistor resistance result ... 72
5-4: General use conductivity sensor probe [31] ... 74
5-5: Tem perature change rate ... 76
5-6: Foam effect simulation and weighted average result (w = 0.2) ... 76
5-7: Turbidity test equipm ent ... 78
5-8: Water bubble test experiment result, pure water 60% turbidity... 79
5-9: Oil bubble test experiment result: pure cooking oil 47% turbidity ... 80
7-1: Constant temperature water tank design and hardware ... 87
7-2: W ater temperature fluctuation ... 88
7-3: PW M control signal ... 89
7-4: W ater tank with prototype ... 89
7-5: Ball valve turning angle during actuation ... 90
8-1: High frequency test equipment design ... 93
List of Tables
2-1: Design space of safety mechanism ... .... 28
3-1: List of parts for our prototype circuit... ... 57
3-2: Volume distribution in the part ... 61
5-1: Resistance characteristics of crude oil from different regions [Weatherford] ... 70
6-1: M O SFET test result ... 85
6-2: B attery test result ... 85
6-3:Relay test result ... 85
Chapter 1
Introduction
1.1
Petroleum Production and Consumption
Fossil fuels are a major energy source on earth: about 90% of the world's total energy is
provided by coal, gas, and petroleum. Petroleum is used widely in power plants, transportation, and heat generation; in addition, the chemical products derived from petroleum, such as plastics and carbon fibers, are also used in other industries and applications. Among these fossil fuels, oil is especially critical to the US economy. It accounts for 40% of the total US energy consumption, including 94% of transportation consumption and 40% of industry consumption [12]. As a result, oil supply security has become a cornerstone of US national security in both the economy and military defense and has led to several military conflicts in oil production regions such as the Persian Gulf in the first decade of the 21' century.
Biomass Hydro Geo (2%)
Nuclear
(-7%)/Solar
& Wind
(8%) (0.2)
Fossil Fuels
Coal, Gam, Petroleum
Soute: Intemabonel Energy Agency (2004)
Figure 1-1: Energy source distribution around the world
The use of fossil fuels has arguably caused considerable global climate change over the 200 years since the first Industrial Revolution and these fuels are increasingly being replaced by new
sustainable clean energy, e.g. wind, solar, nuclear, and hydro power. Nevertheless, the dominant position of fossil fuels in the US economy will remain for at least the next 50 years. Therefore, more resources and technology than ever before are being applied to search for more oil reservoirs and to increase, or at least sustain, the production rate of the current ones.
Rank Country Production
1 Saudi Arabia 10,665 2 Russia 9,677 3 United States 8,330 4 Iran 4,148 5 China 3,845 6 Mexico 3,707 7 Canada 3,288
8 United Arab Emirates 2,945
9 Venezuela 2,803 10 Norway 2,786 11 Kuwait 2,675 12 Nigeria 2,443 13 Brazil 2,167 14 Algeria 2,122 15 Iraq 2,008
Figure 1-2: Oil production countries, OPEC 2006
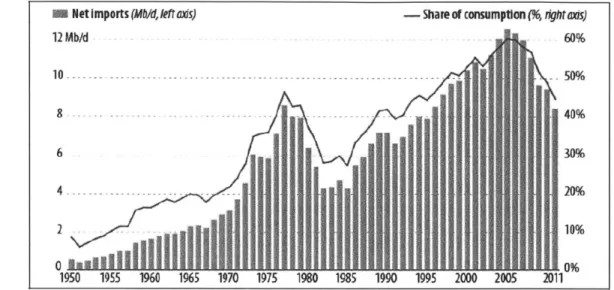
Currently, the world's oil production totals 30 billion barrels per year [2], with a current market value of 3 trillion US dollars. However, the peak of production is coming within the next decade [1], after which the production is predicted to drop precipitously. Saudi Arabia is the largest producer and proven oil reservoir in the world. Including Saudi Arabia, Middle Eastern nations hold two-thirds of the total proven oil reservoirs on earth. Although the US is a major oil production country, the US imported, on average, 8.4 million barrels/day [12] in 2012, which represents over 45% of the total domestic oil consumption. The US is also a net importer of crude oil. With an average per capita oil consumption twice the global average, the US remains heavily dependent on the Middle East to keep its economy running, as indicated in Figure 1-3. Since its peak in 2005, US importation of crude oil has dropped by at least 17% [12] due to multiple factors, including the economic meltdown, high oil prices, application of clean energy, increased domestic oil production offshore, and the decreasing price of replacing energy sources such as shale gas. Among all these factors, the application of new technology in oil exploration and production in offshore oil
reservoirs and extracting oil from previously depleted wells has made a significant contribution.
M
NetImports (Mb/d,fltais)12 Mb/d
-- Share of consumption (%, ight ais)
2...
60%Data Soirce: EIA, Petroleum & Other Liquid Fues, February 28, 2012, htp:Jlwww.eia.gov/petroleum/data.cfm.
Figure 1-3: US oil import and share of domestic consumption, BP 2012
1.2 Artificial Lift Technology 1.2.1 Artificial Lift System Overview
At least 90% of current oil wells need some kind of artificial method to sustain continuous
production, especially offshore wells deep under the sea floor. Ground operation has to supplement the natural reservoir pressure to sustain production[13].
3% 5% 2% 4% * Rod Lift 7%
0
ESP 0 PCP * Hydraulic M Gas Lift * Plunger M OtherSome of the major artificial lift systems include electric submersible pump system (ESP), rod lift, progressing cavity pump systems (PCP), gas lift, plunger lift and hydraulic lift[13]. As shown in Figure 1-4, the technology most widely used, and easiest to implement on the ground, is ESP, where a pump and an electric motor are inserted downhole and add pressure to bring hydrocarbons to the ground.
Beam Horsehead
Gearbox
Polished rod
Motor Stuffing box
Discharge
Figure 1-5: Rod lift system ground facility [32]
The rod lift system consists of the horsehead run by a motor-gear system up and down, a long cylinder barrel in the tubing and a piston-valve system at the bottom of the tubing to lift the oil up. This lifting technology has a long history and is used widely in reservoirs on the ground.
The gas lift is used widely on offshore oil rigs and is becoming a promising way to explore deep sea reservoirs because it is flexible and versatile and does not require ground wire to communicate or control. In addition, it is especially capable of dealing with the pressure, temperature, and corrosion in an undersea environment. There are over 3000 gas lift wells in the Gulf of Mexico region alone, and the number is rapidly growing.
Figure 1-6 shows how the gas lift system works. Gas is injected through a single-direction gas lift valve through a casing annulus into the main tubing, where it aerates the hydrocarbon. The oil with gas bubbles turns into a foam-like amorphous mass and flows up through the main tubing under high pressure. Ground operation can control the production speed by tuning ground valves
normally methane and other natural gas, and added nitrogen from the ground. With the gas lift, no solid tubing or electric wire has to be installed in the system.
Figure 1-6: Gas lift system [3]
Injection Gas
Gas passes through
mandrel hole into gas chamber
surrounding gas lift valve
through gas lift
valve
and into tubing
Casing - Tubing Gas lift valve O-Rings seal gas in chamber around GLV Side pocket Mandrel
1.2.2 Gas Lifting Today
The production system of gas lift wells consists of an annulus, casing and tubing. Gas is injected into the annulus through the ground valves. The gas lift valves are located in the side pocket on the main tubing called the mandrel, as shown in Figure 1-7. The valve is sealed by two
0-rings at the top and two at the bottom to prevent oil or gas from flowing into the annulus. During production, high pressure gas in the annulus actuates the bellows valve and flows into the tubing. Gas mixes with crude oil and aerates it so that the low-density foam-like oil flows up through the tubing to the ground.
Gas Dome
- Bellows Spring
Bellows Valve - * Injection Gas
Check Valve
I
W
p
Figure 1-8 Gas lift valve cutaway [3]
The valve is the central control mechanism for the whole system and will be the focus of this thesis. It consists of a pressurized bellows and an internal check valve. When the injection gas pressure in the annulus increases beyond a certain threshold-which is designed, predetermined, and tested on the ground by changing the pressure in the bellows-the bellows will lift up to open the gas orifice. At the same time, the pressure presses on the check valve and starts the gas
flowing into the tubing. The major function of the check valve is to block the oil backflow
regardless of its pressure; the bellows is the control mechanism to start or stop the production. As
a result, the check valve is more prone than the bellows to multiple failure modes since it is in
direct contact with crude oil.
Figure 1-9: Gas lift valve in market, Chevron 2009
Gas lift valves are installed with wireline operation, as depicted in Figure 1-10. During an
emergency or valve failure, the valves can be retrieved with wires and repaired on the ground.
V
Lower to design level Kick into mandrel Pound to install Shear to disconnect
Figure: 1-10: Wireline operation [34]
Normally, one production tubing will have multiple injection points with multiple valves for different stages of production. All these valves have different actuation pressures because the tubing pressure varies for different levels. However, with the latest single point injection
technology [34], the injection gas pressure could be high enough so that only one production valve is needed, at the bottom of the tubing, to achieve the whole production process.
After the drilling for a new well is finished, the annulus and tubing are normally filled with a
mixture of water, gas, oil and various chemicals, which is called kill fluid. As a result, the kill
fluid needs to be flushed completely out of the system to start production. This process, called
unloading, is depicted in Figure 1-11. Previously, multiple production valves were also used to
flush kill fluid. The valves have different actuation pressures and open one by one until no more
kill fluid is available in the system. With the current technology, most wells have only two valve
systems, one only for flushing kill fluid and one for production. This is the assumed design for our
system so that the orifice of the production valve is never in direct contact with any liquid, even
during the unloading process. Kill fluid valves only open at the beginning of the production and
shut down after that. Production valves are shut down at the beginning and take over after kill
fluid is gone. This process is actuated by tuning the pressure in the annulus with ground operation.
Bellows 2TJ
Pressure
Annulusfilled with liquid. Oil in tubing, not flowing. Al
Ivalves
are open from hydrostatic pressure. Lower unloading valves have lower bellows pressures, P1>P2>P3>P4
Gas is pumped down the annulus, flowsthrough the top two GLVs. Liquid level in the annulusdropsas fluid is pushed out of the annulus.
Injection gas pressure
decreases, top GLV closes.
1.3 Prior Art on Thermally-Actuated Safety Mechanism
1.3.1 Gas Lift Valve Failure Mode
By "valve failure", we mean that either the sealing of valves is compromised and the oil or
gas flows back through valves into the annulus casing and even up to the ground, or that the injection is blocked and the gas injection appears to be interfered with. Valve failure can cause
serious safety issues for the offshore platform, such as fires and explosions, or at least stop production.
Normal operation.
Injection gas flows through
the GLV and the thermal lockvalve is closed.
Failure mode: debris is caught in the check valve
and oil begins flowing into the annulus.
Thermal lockvalve heatsup and actuates, blockingflow through the orifice.
Figure 1-12: Valve failure mode and safety valve [3]
The failure modes are mostly mechanical and chemical:
" Jamming: Minerals, rocks, and large dimension solid hydrocarbons may flow through the check valve and get stuck near the perimeter, holding the check valve open regardless of the injection gas pressure, as shown in Figure 1-12.
" Corrosion: Many chemicals in crude oil are corrosive. During constant direct contact with the check valve surface, the sealing may be compromised.
1.3.2 Safety Mechanism
Oil production typically takes place several hundred meters below the sea floor, where the pressure is at least 3000 psi and the temperature ranges from 80'C to 100 C, in addition to the corrosive material. It is an extremely harsh production environment.
Eric Gilbertson [11] designed the first version of a thermally-actuated safety mechanism for a gas lift valve in 2011. It is the first type of safety mechanism that has a different failure mode than the original valves. Previous attempts by Schlumberger and Weatherford only added a second check valve to the system in case the first one failed. However, if the first one did fail, there was a good chance that the second would fail in the same way soon after.
Gilbertson's thermally-actuated device is an add-on device to the original gas lift valve with the pressurized bellows and check valves, so it does not change the external dimensions of the valve body. This mechanism is based on shape memory alloy contraction.
Cool Austenite Rer
Deform Martensite
Martensite .(Deformed) (Twinned)
Figure 1-13: Crystal phase change [4]
The shape memory alloy is about 50% nitinol and 50% titanium. The exact ratio determines the transition temperature. When the material is heated beyond the transition temperature, it undergoes a change in its crystal form, or atomic arrangement. This change in the crystal structure in NiTi alloys is from an ordered cubic crystal form to a monoclinic crystal phase above the transition temperature[4], and there is no permanent memory for this transition. The type of transformation that occurs in shape memory alloys is known as a thermoelastic austenite transformation. It changes the material from the low temperature form, called martensite, to the
high temperature form, called austenite. During this process, the atomic crystal shrinks and the external volume decreases isotropically to the same level and same shape as indicated in Figure
1-13. The process is predicable and repeatable at the same temperature. The critical points in the
transition are the martensite start temperature during cooling (M,), the martensite finish temperature(Mf), the austenite start temperature during heating (As), and the austenite finish temperature(Af), which are shown in Figure 1-14.
z
U' .J
Mg Me As A#
- TEMPERATURE +
Figure 1-14: Shape memory transition [4]
The major shape memory effect on the NiTi wire is its elongation and contraction in length at different temperatures. Taking a typical Dynalloy NiTi 0.02" shape memory allow (SMA) wire as
an example, the transition temperature is 700C or 900
C depending on the specific material recipe,
as shown in Figure 1-15. The contraction rate is up to 5% of the total length, and the pulling force is 3.56 Kg [11].
One handy feature of SMA wire is the adjustability of transition temperature by changing the initial tension on the wire:
As= A0 + AL
-~ I S* S
In this equation, a is the initial stress on the wire and M is a constant value, 6.9 Mpa/C [11]. When As is increased, M. tends to change accordingly by the same amount. Normally,two transition temperatures have a constant difference. However, we can tune either of them by changing the preloaded tension. As - M= 20- 30*C
-70 'C Heating -70 *C Cooling 90 C Heating --- 90 "C Cooling
CL E a. 140 120 100 0 80 40 20 0 D.c 1.00% 2.00% 3.00% 4.00% 5.00% Strain %
Typical Temperature vs. Strain Characteristics for Dynalloy's standard 158"F (70*C) "LT" and 194"F (90*C) "HT Austemte start temperature alloys, at 172 MPa
Figure 1-15: Dynalloy SMA wire data [11]
Figure 1-16:Valve body [3] 00%
During typical oil production, the temperature of the valve body is in equilibrium with the annulus casing gas temperature, which is between 800C and 100*C
at deep earth level. However, during a backflow event, when the oil flows back through the valve orifice slowly and immerses the whole valve body in hot oil, the temperature can heat up beyond 100*C within a time frame of minutes. The high temperature will heat the shape memory alloy wire beyond transition
temperature and lead to contraction.
As shown in Figure 1-16, this 5% contraction of the wire turns the shaft of a ball valve that was held aligned with the orifice by the torsion spring. The rotation of the shaft shuts down the ball valve and stops production. This mechanism uses the SMA wire as both a sensor to detect backflow event and an actuator to shut down the gas lift valve. This process, from backflow to complete shut down, takes up to 10 minutes and could effectively prevent further leaking.
0-Rings Stopper Berig Torsion Torsion Spring Spring SMA Wire SMA Wire
Figure 1-17: Ball valve with SMA [3]
1.3.3 Temperature Drift Technical Challenge
Our prototype has proven to be functional in a controlled environment simulating real wells. One major technical challenge to meet before it can be brought to market is production
much as IC/month due to steady pumping of relatively cold gas into the reservoir, as shown in Figure 1-17.
Well temperature
SFalse alarm
12 3Time (month)
Figure 1-18: Well temperature drift
During an emergency shut-in event, when all personnel are evacuated from the platform and production is shut down due to hurricanes or other natural causes, the oil heats up the whole system slowly due to lack of cooling gas. If we use the SMA wire as a sensor and set the transition temperature to a constant value, this temperature fluctuation causes false alarms on the safety valve and shut down the valve-even if there is no backflow.
This thesis focuses on how to solve this problem, i.e. how to improve the performance of a shape memory alloy-based safety valve with normal production reservoir temperature drift.
1.4 Thesis Outline
The thesis is organized as follows:
* Chapter 1 presented the engineering challenge and prior art for this technology. The shape memory alloy technology is explained in detail with application in the thermally-actuated safety valve designed by Gilbertson et al. in 2011. The false alarm caused by oil reservoir temperature drift is analyzed and it's the focus for the whole thesis.
" Chapter 2 covers the possible solutions we have explored. The potential advantage
and technical challenges of each are listed and analyzed.
* Chapter 3 presents the design of the electronically-controlled concept and the way to integrate it with the current gas lift valves and production tubing.
" Chapter 4 models the shape memory alloy wires with both heat transfer and
structural strength. The simulation helps us understand and predict the SMA wire behavior in both air and water. Also, it helps ensure the wire's robustness under extensive tuning tension.
" Chapter 5 presents the features and requirements quantitatively of different sensors
that could be implemented in the system.
" Chapter 6 documents the experiment process for testing survival performance
under high pressure and temperature on both the component level and system level.
" Chapter 7 presents the system integration and functionality testing to show how the
new safety valve functions in a controlled constant temperature environment.
" Chapter 8 covers the experiment on the SMA wire for multiple cycles to study its
fatigue performance. A high frequency heating and cooling device was built and documented to finish such a test with over 50 cycles within a day.
Chapter 2
Possible Solutions & Design Space
The gas lift valve is designed to fit the current mandrels already installed in the wells. It is a
huge initial investment to drill a well and install a new set of tubings. It is much easier to bring the
new device to market if it can physically fit into the current valves. Moreover, the device has to
survive in the high temperature, high pressure environment for up to one year, which is the
average time before the old valves are retrieved, repaired, or replaced during maintenance. In
addition, in terms of time frame, the reaction time requirement depends on the specific well
situation and government requirement. Although the single valve price seems negligible compared
to the total investment in drilling and installation of a new well, multiple valves have to be
replaced regularly on each well every year. Price is definitely a factor in the design. Table 2-1 lists
all the design constraints for our device.
Design Space
Constr
Unit
aint
Length
10
Inch
Volume1
Inch^3Diameter
1.5
Inch
Pressure
3000
Psi
Temperature
80-100
*C
Price
100
USD
Reaction Time
30
min
Table 2-1: Design space of safety mechanism
The dimensions are predominantly constrained by the current valve, which is 1.5 inches in
diameter and 10 inches long. Considering the total volume and structural strength, we prefer to use
under 1 cubic inch hollow volume in the valve body to insert the new device.
version of the design, the pressure target is 3000 psi, and we will try to improve the design for deep sea application with higher pressure in the following work. In terms of cost, the current single valve price ranges from 700 to 1000 USD. An additional device under 100 USD would be acceptable considering the hazard it could effectively eliminate. Ideally, the reaction should be immediate, but the initial leaking material would be oil foam and natural gas, not crude oil. Thirty minutes is an acceptable reaction time before the leaking can cause serious safety issue[17].
In section 2.2 we present some of the possible design solutions we considered (based on the above requirements) but finally rejected. They might be helpful for future researchers in this field.
We could install a perfbrated boxto hold chemical in SMA cornparbmnt
Oil flow channel
SMA wire cornpartrent
Figure 2-1: Embedded chemical case design
2.1 Chemical Heating
chemical sensor. The valve orifice is connected to the SMA compartment. During a backflow
event, the oil flows into the SMA compartment, where we installed a perforated case to hold the
reacting chemicals surrounding the shape memory alloy wire, as shown in Figure 2-1. Oil and this
highly oxidant chemical mix in the case start a fast exothermic process to release a lot of heat,
warm the wire through direct conduction, actuate the SMA wire, and finally close the valve.
This chemical should be stable, stay effective for up to one year, and not decompose
spontaneously under high pressure and temperature. Preferably, this chemical should be easy to
handle and low in toxicity. In addition, it needs to be in solid state to fit into the perforated case.
The transition temperature has to be tuned well above the possible reservoir temperature
fluctuation upper limit but below the temperature achievable through chemical reaction by adding
more preloaded tension to the wire initially. As a result, no matter how vibrantly the reservoir
temperature drifts, the system will not actuate unless there is oil in the orifice to react with the
chemical.
Some candidates for the chemical are KmnO4, XePtF6, Na2S208, NaBiO3-2H20, mostly
active oxidants.
Mf
Tiow Tmean
Thigh Tshut As chemical heating Strain Tleakage MsAf
Tstablecooling to shut in temperature after SMA shut down
Temperature
Figure 2-2 shows the temperature sequence during the whole shut-down actuation process. Tshut and Tstable are the temperatures when the cold injection gas is stopped due to maintenance or emergency natural causes. The well temperature slowly reaches equilibrium with the ambience. Tleakage is the maximum temperature of the wire during the chemical heating. The exothermic reaction will bring the wire temperature from production temperature, past A,, the actuation temperature, and then finally past Af, the complete contraction temperature. Since there is no cooling flow, the wire will never cool down to below Ms, become martensitic, and contract again. As a result, the safety valve will stay closed.
Shut-down procedure:
1. Crude oil mixes with chemicals in the perforated case during backflow.
2. The exothermic process heats up SMA wire from Tmean (mean production temperature) to Tleakage. SMA wires finish contraction. Safety valve closes.
3. System cools back to Tstable, ambient temperature, and safety valve stays closed.
4. Whole valve is retrieved to the ground and replaced.
The major technical challenge of this solution is the chemical stability issue. All the active oxidants tend to self-decompose slowly and cannot stay effective for a fairly long time. Also, the humidity in the injection gas is an uncertainty since there is currently no drying process before
injection. As a result, the chemical will increasingly absorb water, slowly react with the water, and dissolve.
Another major challenge is the coating protection on the stainless steel valve body. Since we are introducing highly active oxidant chemicals into the system with high humidity and
0.8 0 .7 --- ---.-.-. - ---.- ---. .. .. -- - -... -.. ... ---... .. ... .- .... .. --- ---. .. ..-.. 0 .6 -- - -... - --.- ... --.-- - -- - ---.-..- --.- -.... ... ... .. --... -.. --.. -... - ---.. ... 0 .5 --- -- ... -- -... -. .. - -- .. -. ... -- -.-..--.-- .. ... ...--.--.-.- ---. .. --- --0.21stmprtr -0.2 ... ... ... As... temperature.... . 1 1.5 2 2.5 3 3.5 4 4.5 5 Tune [month]
Figure 2-3: Tracking well temperature with SMA wire
2.2 Tracking Transition Temperature 2.2.1 Overall Strategy
Changing the transition temperature to track the reservoir temperature drift is another option. In short, this design seeks to change the transition temperature in the same direction by the same amount of reservoir drift to avoid a false alarm, as shown in Figure 2-3.
The major challenge of this design is incorporating a low pass filter mechanism into this tracking system, i.e. to follow the well temperature in slow frequency change to avoid a false alarm but keep the transition temperature constant during real backflow event with fast ambient temperature change to effectively actuate the system.
Trunnion
BO
SMA wire shielded auium bar erogel
Alumninum bar
Constant torque axle
One of the mechanisms we designed takes advantage of the thermal expansion feature of metal. In this concept, a shielded aluminum bar and the SMA wire are connected by a constant torque axle, as shown in Figure 2-4. The aluminum is shielded with a high insulation material such as aerogel.
During slow ambient temperature change, the aluminum bar heats up, expands slowly, stretches the SMA wire by the axle, increases the wire tension, and increases the transition temperature. The reverse occurs in the cooling process. The application of the axle dramatically minimizes the length of the aluminum bar needed due to mechanical advantage. However, in the fast ambient temperature change scenario, the shielded aluminum cannot react rapidly enough in expansion to keep the A, the same as for SMA. As a result, the ball valve mechanism can actuate as expected. The transition temperature change obeys As= A.+ M [11] where - is the tension on the wire and M is a constant value.
2.2.2 Structural Design
We make the following assumptions:
A. Thermal expansion coefficient a is very close for aluminum and SMA at around 2x10⁻⁶
B. The aluminum bar diameter is much larger than that of the SMA wire, so we can neglect the force on the axle from the SMA compared to the aluminum bar. As a result, the
displacement of both SMA wires and aluminum bar are completely due to the heat expansion of the aluminum bar.
The design has a general goal of keeping the As, the transition temperature, change the same with the ambient temperature change AT by tuning the tension on the SMA wire. As a result, the SMA wire can avoid phase change due to ambient temperature drift.
AAs= AT (2.1)
The transition temperature change follows the rule
As= Ao+ .!. (2.2)
M
where M = 6.9 Mpa/C [4] is a constant value. After combining these two equations, we have the
AT = . (2.3)
We also know the heat expansion of the aluminum bar follows the rule
E = = aAT (2.4)
L
where a is the thermal expansion coefficient and E is the strain, After we plug in the strain-stress relation of
- = E -E (2.5)
where E is the Young's modulus, with Equations 2.3 and 2.4, we have the relation between aluminum bar strain and SMA wire strain
Ealum = a - Em - Esma / M. (2.6)
We then express the total SMA wire strain Esma as the ratio between real expansion caused by aluminum bar stretching NAz substracted by the expansion due to the heat expansion of SMA wire itself, and the total length of SMA wire. Az is the expansion of the aluminum bar and N is the axle diameter ratio.
Esma= (NAz - a -AT -Ls) / Lsm (2.7)
We then plug equation 2.7 in equation 2.6 and get the relation between the length of the two materials
NAz-a-Lsma -AT E (2.8)
Lsma - M
Therefore, in equation 2.8 we replace the strain for aluminum bar Eaum with the ratio of its expansion and total length and express AT with Az in heat expansion Equation 2.4. Finally, we cancel out Az on both sides of the equation and get the ratio between two materials as
L(alum) M 1 I a-E(sma)
L(sma) aM 29)
Plug in the values for the constants of M and E=7.5e10 Pa to collect the numerical ratio between two materials as
Ratio = L(alum) 5.5
L(sma) N
where N is the ratio between the larger raduis and the smaller one on the axle, i.e. SMA/Aluminum.
This is the required ratio between two wires to ensure that the transition temperature can keep a constant difference above the ambient temperature, as required (see Figure 2-3). For a
typical gas lift valve, the overall maximum length is less than 10 inches. If we install a
10-inch-long aluminum bar, the maximum SMA wire length turns out to be 1.8 inches. A single wire of this length would not have enough contraction length to pull the ball valve completely. Another axle or lever system would be needed at the wire-valve joint.
2.2.3 Thermal Design
The insulation design of the aluminum bar determines the valve closure timing. We choose aluminum because of its relatively high thermal expansion coefficient (among cheap metals), ease of manufacture and large enough Young's modulus. We want to model the aluminum bar heat transfer and predict the closure behavior with different dimensions of the bar and insulation layer. The major heat transfer mode is direct conduction from the stainless steel casing to the aerogel and from the aerogel to the aluminum bar. In our case, the cross section of aluminum bar has a very large Biot number; therefore, we can neglect the temperature difference within the metal.
The dominant thermal resistor turns out to be the aerogel insulation layer compared with the small contact resistance between steel casing and aerogel and between aerogel and aluminum.
aluminum aerogel stainless steel erogel
conduction
Aluminum bar
contact r2 contact rl
Figure 2-5: Insulated aluminum bar and equivalent thermal resistors
contact, stainless steel and aluminum, respectively. The stainless steel temperature represents the ambient temperature in the well. We neglect the contact thermal resistance ri and r2 in this analysis.
Therefore, we can focus on the heat transfer through the aerogel. This is effectively conduction and follows the conduction rule
q" = -K A - = - 27r L- - (2.10)
AX Ar
with a small variation for aerogel cylinder. K is the conduction transfer rate, A is the heat transfer contact surface area and r, L are the dimensions of the cylinder.We then introduce the idea of equivalent thermal resistor
R =- (2.11)
qti
Therefore, the infinitesmal thermal resistor for a smal thickness within the cylinder is
AR = 27wrlK Ar ((.2
We can calculate the total thermal resistor by taking the sum of all these infinitesmal resistors
E AR = 2LK ln( r(Out) 'i) (2.13)
Where rnt and rm are the outer and inner radii of the cylinder.
The ambient temperature keeps rising from initial temperature To at a speed of IC/month and the temperature at time t in seconds can be expressed as
Tout= To + x (2.14)
30x24x3600
Then we plug 2.15 in the heat conduction equation with transient temperature Tout, aluminum bar temperature rise AT + To and the total equivalent thermal resistor R to obtain the instant heat transfer rate at time t
q" =( -AT) - . (2.15)
At the end, with the sum of instant heat transfer , the total heat transfer results in a temperature rise at the aluminum bar
f q"dt = Caim - Maium - AT . (2.16)
After we take the derivative with respect to time on both sides of 2.17, we have an ordinary differential equation in terms of AT. We can then solve this equation by plugging in the boundary condition of AT(0) = 0, AT(1 month) = 1, the constant values K = 0.02W/m.K for aerogel ,Caim=
follows the following equation and definitions
AT 1 month - e~ + 1 (t-A), A=38880lnr(out)) (2.17)
month (in)nr
We can see from equations above that the temperature fluctuation of the aluminum bar is a function of both the dimensions of insulation design, i.e. the aerogel outer diameter and the bar outer diameter, and the environment temperature change rate. We conduct a case study on one of the feasible designs within the design space to see how the closure behavior is affected by the thermal design.
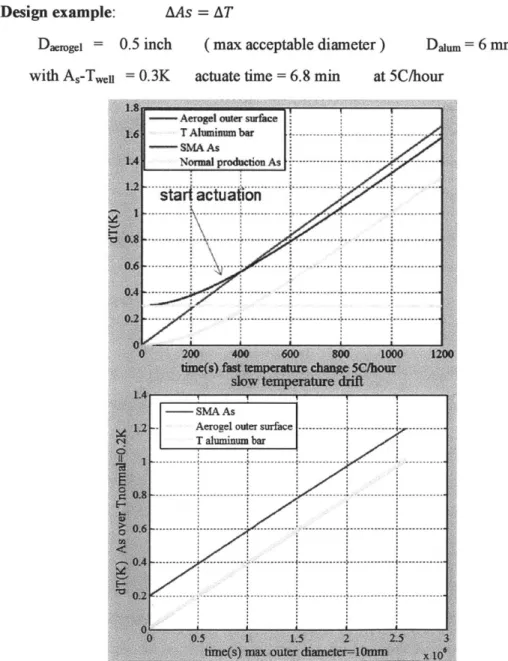
Design example: AAs = AT
Daerogei = 0.5 inch (max acceptable diameter) Dal.m= 6 mm with A,-Twen = 0.3K actuate time = 6.8 min at 5C/hour
With this structural and thermal design, the change in transition temperature on the SMA equals the temperature change on the aluminum bar. In the fast response case, when the well temperature (aerogel outer surface temperature) rises rapidly and the transition temperature cannot keep up due to the insulation effect, the safety mechanism will start to actuate when these two curves cross, after about seven minutes. With a slow well change, the transition temperature keeps rising by the same amount with the ambient environment and avoids a false alarm.
Our repetitive tuning of the dimensions of the insulation and aluminum bar shows that the closure timing does not have a linear relation with either the insulation or the bar dimension. Their effects are coupled. Thus, we can not minimize the closure time by maximizing the aerogel thickness. Although more insulation would decrease the heat transfer to the aluminum, a smaller metal bar due to the expanding insulation would also need a smaller amount of heat to expand, and thus delay the closure. In contrast, the slow temperature tracking behavior is not sensitive to change in insulation dimensions.
Shut down procedure:
1. SMA wire transition temperature stays above ambient temperature with a constant value
during normal production.
2. During backflow the fast heating, As curve intercepts the ambient temperature curve and the safety valve starts to close.
3. System cools back to Tstable, ambient temperature, and the safety valve stays closed.
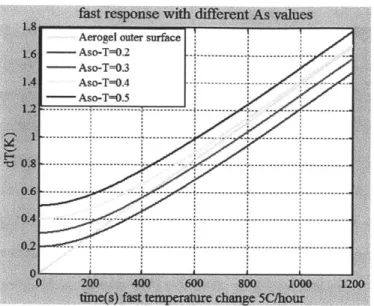
Figure 2-7: Thermal simulation with different A., values and ambient change rates
As shown in Figure 2-7, in different cases with different predetermined As, the valve SMA
will actuate at different times. With a too large A. vs. Tweii difference, the well temperature and A,
curves might never cross and then never actuate. We have to choose the preset As value carefully
to ensure reliability. Also, the system is also sensitive to the change rate of the well temperature. A
large A, vs. Tweii SMA wire will effectively actuate with a 20C/hour well temperature change but
will not be functional in the 5C/hour case.
One major flaw in this design is the reliability of complete closure. When the SMA As and
ambient temperature curves intercept, the valve starts to contract. As the ambient temperature
increases, the valve As and Af temperatures increase accordingly. It is highly likely that the Af is
too high and the wire will never finish complete contraction, i.e. completely close the valve.
This temperature tracking mechanism is less prone to corrosion, high pressure, and high
temperature damage since all the parts are mechanical. However, it takes special tuning of the
preloaded SMA tension to fit each well since the well temperature various greatly from well to
well. It takes a long time to actuate after the backflow initially appears because the oil has to heat
up the stainless steel valve body first, before heating up the embedded safety mechanism parts.
Everything has to fit together and work perfectly to shut down the production valve as expected.
We explained the two possible design concepts to solve the false alarm problem caused by temperature drift. The advantages and disadvantages for both designs are discussed. The ground work of mathematical modeling and design is presented. Future researchers can follow the path and explore deeper in these directions.
Chapter 3
Electronically-Actuated Safety Mechanism
The overall strategy behind this concept of solving the temperature drift problem is to replace
the shape memory alloy with a sensor-microprocessor circuit and preset the transition temperature
well above the possible reservoir temperature drift range to avoid a false alarm and be able to
actuate at the same time. Also, thermal heating from the ambience is replaced with electrical
heating from a battery-supercapacitor energy storage system. With controlled voltage and current,
the actuation behavior is more predictable and reliable. The rest of the thermally-actuated safety
mechanism stays the same, including the ball valve design and the shape memory alloy mounting.
This new concept is an improvement of, and an add-on device to, the original version.
Mf Tiow Tmean Thigh Tshut -in
Seaain
Tatable
valve closed, wire cooling to ambient temperature
Temperature
Figure 3-1: Temperature strategy in electrical heating
We have to avoid the possibility of false alarms during shut-in as well. The transition
down due to maintenance or weather issues and the temperature rises to ambient temperature due
to the lack of cooling gas. This temperature is normally above the well temperature drift range.
This circuit should be also able to store and pass energy to the shape memory alloy to actuate
contraction. After the actuation, the wire reaches a maximum temperature Tactuate, and slowly cools
down to the ambient temperature, which is still well above M. As a result, the wire will maintain
its contracted length. The valve could be retrieved to the ground for repair and replacement soon
after.
Lithium-polymer primarycell
I 20V
3.1 Control Circuit Design
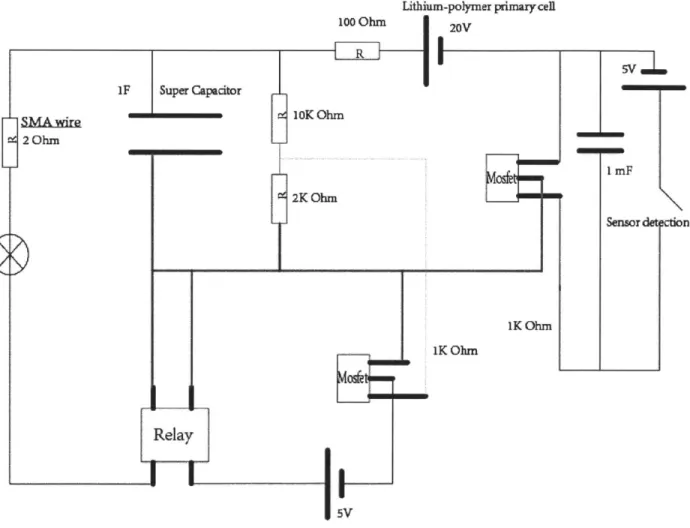
3.1.1 Circuit
Figure 3-2 shows how the passive control circuit works. By " passive," we mean it is not consuming any energy before there is a backflow event. The imbedded conductivity sensor system monitors the situation in the gas lift valve orifice. Once there is crude oil, water, or aerated oil foam in the orifice, this dramatically changes the resistance between the sensor probes. The circuit is immediately closed. The first 5V battery will apply a voltage charge on the first MOSFET to close the charging circuit. The energy storage lithium battery will start to slowly charge the supercapacitor with a physical discharge limit of 200 mA, which takes up to 3 minutes in experiments. The voltage divider on the supercapacitor monitors the voltage constantly. As soon as the voltage reaches the designated value, it will apply enough voltage to the second MOSFET to close the actuation circuit, which in turn applies enough voltage to the relay to start the fast discharge from the supercapacitor to the shape memory alloy. The discharge is finished within 1 second. As soon as the wire is hot enough, it will finish the 5% contraction and close the valve. In the downhole environment, it is never going to cool to below the Ms value and keep the valve closed. The whole process takes up to 3 minutes.
The passive sensing system is based on a simplified version of the conductivity sensor. The metal plate electrodes are installed on opposite sides of the flow orifice. The sensor is in series with the lithium 5V battery and the first control MOSFET. During normal conditions, only
injection gas goes through the sensor and the resistance is extremely high. When oil foam flows up through the orifice, the low resistance material closes the circuit and applies the voltage on the
MOSFET to actuate the following procedures.
The circuit consists of two major functions: energy storage and sensing. The reason for including the dual battery-capacitor system is the life range requirement and the memory alloy contraction current requirement.
It takes 4A for at least 1 second [11] to complete the 5% contraction for the 0.02-inch diameter
SMA wire we use. However, the lithium ion battery has a maximum 200 mA discharge rate with 100 Ohm resistance [15] due to its chemical mechanism. It is a perfect energy storage device due
to the low self-discharge rate of 2% per year [15] but it is less than ideal for actuation current. On the other hand, a supercapacitor can hold up a large amount of energy with a high capacitance, and
the discharge rate is technically unlimited [7]. The only drawback is the high self-discharge rate of up to 30% per day. As a result, we decide to combine these two types of energy storage devices to store the energy for up to a year during normal operation and discharge the energy quickly through capacitors in actuation. Turner and Xu have designed such a circuit [8][9] for other purposes, especially in power plant and electronic appliance energy regulation. Our version is an improvement to and modification of their design. Our circuit design has to store and deliver a much larger amount of energy and has to survive in a harsh environment for extensive periods of time. Also, our electronic system is the first one to be integrated with gas lift oil production systems.
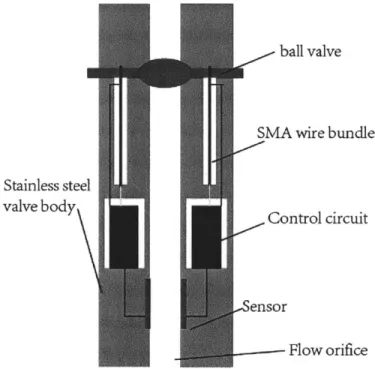
Stainless steel valve body
ball valve
SMA wire bundle
Control circuit
ensor
Flow orifice
Lithium-polymeprimary cell
I
20VMicroprocesor
Sensor detection
Figure 3-4: Control circuit with embedded microprocessor
A more advanced version includes a high pressure, high temperature microprocessor to
replace the passive control system. The sensor system shown in Figure 3-4 sends real-time data to
the microprocessor, which records and analyzes the turbidity, pressure, temperature, and
conductivity data in the orifice, makes decisions about when to start the shut-down process,
applies a predesigned voltage to the MOSFET of the energy storage system, and starts the process.
In this version, the processor and sensor are constantly consuming energy to execute the
monitoring task.
To save energy, the system could be turned on every 24 hours or even every week to collect
data. With the current technology, a low power sensor consumes as little as 1 mW and can run on
the lithium button battery for up to 20 years. In addition, with the microprocessor, the noisy data
from the sensor can be filtered, stored, compared and even sent back to the ground. We discuss
how to analyze raw sensor data and use the information to make decisions in Chapter
5,
Sensor
Selection.
decision signal
microprocessor
energy storage
shape memory alloy
gas flow
sensors
valve body
ball va
lve
Figure 3-5: Remote control version
As shown in Figure 3-5, the microprocessor collects data from multiple sensors (turbidity, conductivity, temperature) in the flow orifice, makes decisions based on the data, and sends a decision signal to actuate the energy storage circuit to start our shape memory alloy mechanism to shut down the production valve.
A variation of the active smart version shown in Figure 3-5 includes a pressure sensor. This sensor is attached to the valve body in direct contact with the annulus casing gas. By tuning the high pressure valves to change the pressure in the annulus casing in a predetermined pattern, the ground can send a command signal to the microprocessors. With this sensor, we can send pressure signals from the ground to remotely control the behavior of the safety valve without a wire. It is even possible to design a pressure-based language with different patterns of pressure fluctuation to tell the microprocessor to make different decisions, e.g. hold valves open for one hour during
special maintenance and unloading, close the valve although no abnormal change of sensor data is found, calibrate the sensor and reset the current value to zero, etc. Figure 3-6 illustrates one possible way to send different command by changing the duty ratio with PWM signal.
.0 01 L_4 4 3 2 1 0 -1 -2 L 0 2 4 6 8 10
time
[minute]
Figure 3-6: Sample pressure wave form in annulus casing where Duty ratio = High period
High period +Low period
According to Chevron [17], the annulus casing pressure can vary with a maximum frequency of 30%/minute by tuning the CHOKE (ground gas injection valve) on the ground. Therefore, by changing the duty ratio of the pressure wave form, the signal can instruct the microprocessor to make different decisions. Although it is only a one-direction communication, the gas lift valve is much smarter with this remote control mechanism.
3.2 Part Selection
We built a 3x large scale prototype [3]. Two 0.02" diameter SMA wires actuate the ball valve, each of which is 5 inch long [3] to get 36N force to pull the ball valve. The design goal is to
during actuation. We discuss below how to select the appropriate electronic parts for this prototype.
Figure 3-7: 3X large scale polyethylene prototype
The major parts of this circuit include battery, MOSFET, supercapacitor and relay. Each has to
satisfy the pressure and temperature requirements and also has to have enough energy capacity.
Major energy deliver processes are charging, during which the battery charges up the
supercapacitor slowly, and discharging, during which the supercapacitor dumps a large current
through the SMA wire.
Battery
A lithium battery can survive in a high pressure environment with a temperature up to 80
0C.
High temperature testing up to 150*C caused an explosion and fire in the oven. Further work
needs to be done to improve performance or find a better type of battery. The battery should have
enough energy for the whole process of wire heating, and also enough voltage to confine the
charging stage to a reasonable period of time. We also considered other options, such as an
alkaline battery, which has an extremely low self-discharge rate and can stay functional for up to ten years, but the discharge rate is too low for our purpose. As a result, the alkaline battery system would have a very long charging stage before actuation.
The energy requirement is calculated based on total consumption on the shape memory alloy wire. With a constant current through the wire, the total energy dissipation follows the Joule's law
E = 12 Rt . (3.1)
However, the total energy dissipation should include the energy lost due to the battery internal resistance
Etota = Eoss + E. (3.2)
By plugging in the data I=4A, t=ls and the resistance of the wire Ra in 3.3,
Rw= 0.22 Ohm/in x5 inch = 1.1 Ohm [11] (3.3)
we know the total energy dissipation should be around 100J. With a safety factor of 2, the total energy we need to store in the battery should be
Etota= 200 J. (3.4)
In conclusion, the battery capacity requirement is 200J with a design voltage we will discuss later in this chapter. A lithium battery has a natural current limit, a natural power limit of 340 W/kg [33], and an energy density of 500 W.h/L. With our mechanical volume limit and the electrical features of the off-the-shelf button cells, the output current limit is generally 200 mA. This output current performance can constrain the charging stage to several minutes.
Supercapacitor
Electrical double-layer capacitors (EDLC) are, together with pseudocapacitors, part of a new type of electrochemical capacitors called supercapacitors, also known as ultracapacitors. Supercapacitors do not have a conventional solid dielectric. Rather than two separate plates separated by an intervening insulator, these capacitors use virtual plates made of two layers of the same substrate. Their electrochemical properties, an "electrical double layer," result in the effective separation of the charge despite the vanishingly thin (on the order of nanometers) physical separation of the layers. The lack of a need for a bulky layer of dielectric (and the porosity of the material used) permits the packing of plates with much larger surface area into a given volume, resulting in high capacitance in uniquely small packages. The capacitor for our
design should have large enough capacitance to hold enough energy to heat up the SMA wire, but also not too much capacitance to confine the charging and discharging within a reasonable period of time. Also, compared to a constant current process, the supercapacitor heating has an exponentially decaying current curve. The total energy dissipated on the wire should be at least equal to the constant current heating.
In the charging stage, the voltage on the capacitor V increases exponentially and can be expressed with the input voltage U0, capacitor capacitance C, battery inner resistance R and time t.
=1- e~
(3.5)
U0
At t = CR, capacitor charges to about 50%, we prefer this value to be in the magnitude of minutes. Since R=100-200 Ohm for lithium battery, if we expect CR = 200s, then we could set the capacitance value as
C = 1 F . (3.6)
At discharging stage, the voltage on the capacitor follows the exponential decay law
V = Vo -e- (3.7)
where Vo is the initial voltage, C is the capacitance, R is the wire resistance.
With C = iF, R = 0.55 Ohm (two wires in parallel, 1.1 Ohm for each), the capacitor
discharges 50% energy at t = 2s. We want to tune the initial voltage so that, at the half energy stage, the current through the SMA wire is still beyond the 4-amp requirement. As a result, the initial voltage should be at least around 10V. However, considering that it cannot transfer 100% energy to the capacitor, it has to be significantly higher than 1OV to charge the capacitor within a reasonable time frame.
When the voltage drops to a certain value, the energy dissipated on the wire will be
immediately transferred to the ambience instead of raising wire temperature, which we discuss in the thermal modeling in Chapter 4.
The exact value for battery voltage is decided by charge/discharge modeling. We still start the modeling with a trial of 25V on battery because this is a general voltage that we can achieve by assembling several off-the-shelf battery in series. The capacitance and voltage ratings depend on the charge time, discharge time, and energy storage requirement. We simulate these processes
![Figure 1-8 Gas lift valve cutaway [3]](https://thumb-eu.123doks.com/thumbv2/123doknet/14685957.560264/17.918.293.625.412.831/figure-gas-lift-valve-cutaway.webp)
![Figure 1-14: Shape memory transition [4]](https://thumb-eu.123doks.com/thumbv2/123doknet/14685957.560264/23.918.205.666.372.715/figure-shape-memory-transition.webp)
![Figure 1-17: Ball valve with SMA [3]](https://thumb-eu.123doks.com/thumbv2/123doknet/14685957.560264/25.918.290.612.534.843/figure-ball-valve-sma.webp)