HAL Id: inserm-02173933
https://www.hal.inserm.fr/inserm-02173933
Submitted on 4 Jul 2019
HAL is a multi-disciplinary open access
archive for the deposit and dissemination of
sci-entific research documents, whether they are
pub-lished or not. The documents may come from
teaching and research institutions in France or
abroad, or from public or private research centers.
L’archive ouverte pluridisciplinaire HAL, est
destinée au dépôt et à la diffusion de documents
scientifiques de niveau recherche, publiés ou non,
émanant des établissements d’enseignement et de
recherche français ou étrangers, des laboratoires
publics ou privés.
struggle for survival
Jérémy Surre, Claude Saint-Ruf, Valérie Collin, Sylvain Orenga,
Mahendrasingh Ramjeet, Ivan Matic
To cite this version:
Jérémy Surre, Claude Saint-Ruf, Valérie Collin, Sylvain Orenga, Mahendrasingh Ramjeet, et al..
Strong increase in the autofluorescence of cells signals struggle for survival. Scientific Reports, Nature
Publishing Group, 2018, 8 (1), pp.12088. �10.1038/s41598-018-30623-2�. �inserm-02173933�
Strong increase in the
autofluorescence of cells signals
struggle for survival
Jérémy Surre
1,2, Claude Saint-Ruf
1,3, Valérie Collin
2, Sylvain Orenga
2,
Mahendrasingh Ramjeet
2& Ivan Matic
1,4Prokaryotic and eukaryotic cells exhibit an intrinsic natural fluorescence due to the presence of fluorescent cellular structural components and metabolites. Therefore, cellular autofluorescence (AF) is expected to vary with the metabolic states of cells. We examined how exposure to the different stressors changes the AF of Escherichia coli cells. We observed that bactericidal treatments increased green cellular AF, and that de novo protein synthesis was required for the observed AF increase. Excitation and emission spectra and increased expression of the genes from the flavin biosynthesis pathway, strongly suggested that flavins are major contributors to the increased AF. An increased expression of genes encoding diverse flavoproteins which are involved in energy production and ROS detoxification, indicates a cellular strategy to cope with severe stresses. An observed increase in AF under stress is an evolutionary conserved phenomenon as it occurs not only in cells from different bacterial species, but also in yeast and human cells.
All prokaryotic and eukaryotic cells exhibit an intrinsic natural fluorescence (autofluorescence; AF) due to the presence of different fluorescent cellular structural components and metabolites, such as flavins, nicotinamide-adenine dinucleotide (NAD), aromatic amino acids, lipofuscins, advanced glycation end prod-ucts, and collagen1,2. Cellular AF spectra encompass most of the spectral range because different endogenous fluorophores emit at different wavelengths of the electromagnetic spectrum. For example, flavins, NAD, and lipo-fuscin emit green, blue, and orange light respectively when excited at appropriate wavelengths. For this reason, AF frequently overlaps with the spectrum of exogenous fluorophores used for research purposes, and therefore interferes with the fluorescent microscopy and cytometric analyses. For example, AF precludes the detection of weak signals from the fluorescent reporters for low-abundance proteins. Correction of this “contaminating” AF is problematic because it is frequently unevenly distributed within and between cells. In addition, because cellular extracts are frequently components of the growth media, growth media are also commonly autofluorescent. For these reasons, considerable efforts have been made to develop methods to deal with these nuisances, which are referred to as background fluorescence, noise, or spectral crosstalk1,2.
However, cellular AF itself presents several advantages and can therefore be used for various analytical pur-poses. Firstly, cellular AF can be monitored without the need for labor-intensive sample preparation involving external fluorophores. Therefore, potential chemical toxicity for the sample and the user, and nonspecific binding and interference with biomolecular functions are avoided. Secondly, AF can be examined in situ without dis-rupting complex structures like bacterial biofilms and multicellular eukaryotic tissues. Thirdly, because cellular AF varies with the cellular morphology as well as with the metabolic and pathological states of cells, it can be used for diagnostic purposes2,3. For example, the change in tissue AF is used for non-invasive, in vivo, detection of tumors4. The infection of human HeLa cells with enterohemorrhagic Escherichia coli was also monitored by measuring the change in the AF of HeLa cells5. AF was also used as a reliable biomarker of the senescence of
Caenorhabditis elegans nematodes6. AF can also be used for rapid detection and identification of bacterial con-taminants in food because different bacterial strains and species have distinct intrinsic fluorescence7–13.
1Institut National de la Santé et de la Recherche Médicale (INSERM) U1001, Université Paris Descartes, Sorbonne Paris Cité, Faculté de Médecine Paris Descartes, Paris, France. 2bioMérieux SA, Microbiology Unit, R&D Microbiology, La Balme les Grottes, France. 3INSERM U1016, Centre National de la Recherche Scientifique (CNRS) UMR8104, Institut Cochin, Paris, France. 4CNRS, 75016, Paris, France. Correspondence and requests for materials should be addressed to I.M. (email: ivan.matic@inserm.fr)
Received: 11 October 2017 Accepted: 3 August 2018 Published: xx xx xxxx
Among different endogenous fluorophores, flavins and NAD are extensively studied because they are respon-sible for most of the cytoplasmic AF and because of their prominent role in cell metabolism. Flavins, which com-prise a category of molecules involving riboflavin and its derivatives flavin adenine dinucleotide (FAD) and flavin mononucleotide (FMN), and NAD are involved in various redox reactions. For example, FAD and NAD, which emit fluorescence when they are oxidized and reduced, respectively2 play a key role in the conversion of energy from acetyl CoA to ATP. Therefore, AF derived from these molecules is expected to vary as a function of the ATP production in different cellular growth phases, and because of the variable nutrient availability and presence of stressors. FAD and FMN are also associated with proteins, some of which are included in the protection against reactive oxygen species (ROS)14.
In this study, we examined how AF of E. coli cells changes as a function of exposure to different stressors. As stressors, we used antibiotics that, besides their medical importance, are powerful tools for unraveling com-plexity of bacterial physiology15, and sodium hypochlorite (bleach) which is a widely used bactericidal agent. We used two classes of antibiotics: ß-lactams that are cell wall synthesis inhibitors, and the protein synthesis inhibitors tetracycline and gentamicin. We found that treatment of E. coli with the ß-lactam antibiotic ampicillin or with sodium hypochlorite, significantly increased cellular AF, while no significant AF increase was observed in protein synthesis inhibitor-treated cells. Our data suggest that flavins are major contributors to bactericidal treatment-induced AF and that AF increase reveals cellular adaptive response to cope with the life-threating stressors. Finally, we demonstrated that the increase in green cellular AF subjected to life-threating treatments is an evolutionary conserved phenomenon as it occurs not only in cells from different bacterial species but also in yeast and human cells.
Results
Ampicillin-induced increase of autofluorescence.
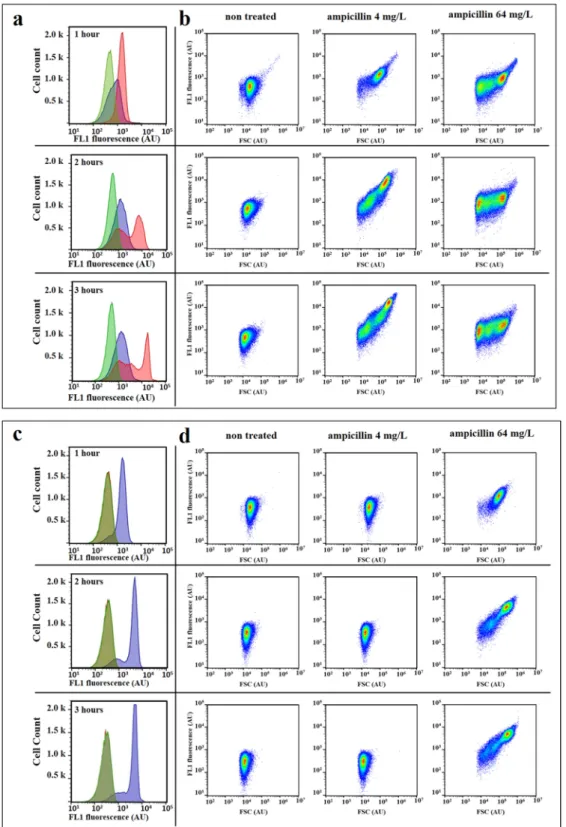
We first tested whether treatment with the ß-lactam antibiotic ampicillin increases AF of E. coli cells. We used two E. coli strains which are susceptible (7705035) and resistant (8812112) to ampicillin according to the Clinical & Laboratory Standards Institute guidelines (www.clsi. org) (Table S1). Minimum inhibitory concentrations (MIC) of these strains are 4 mg/L and 64 mg/L respectively. Exponentially growing cultures of both strains were treated for 3 hours with a range of ampicillin concentrations. Cellular AF, as well as light scattering profiles, were analyzed by flow cytometry (Figs 1, S1 and S2). When com-pared to untreated conditions, all tested ampicillin concentrations induced an increase in green AF (excitation at 488 nm with bandpass filters of 530/30). Maximal AF was observed at ½ and 1× MIC. Of note, susceptible cells treated at 1× MIC revealed important heterogeneity in the autofluorescence distribution profile, which reflects cell-to-cell metabolic state heterogeneity. A similar trend was observed with the resistant strain. At concentrations above the MIC, cellular AF was higher than that of the untreated control, but lower than the AF measured at the MIC. Such an increase in the cellular AF, as a response to cytotoxic antibiotic treatment, was observed for other ampicillin-treated E. coli strains, but also for meropenem-treated Klebsiella pneumoniae and Serratia marcescens (Fig. S2).The forward scattering (FSC) profiles of ampicillin-treated cells became dispersed, due to the appearance of cells of different shapes and sizes relative to the untreated control, and they changed over time (Figs 1 and S1). After one hour of incubation, cells treated with 1× and 16× MIC started increasing in size. After two hours of incubation, cells treated with 1× MIC continued to increase in size and smaller cells increased in frequency within populations of cells treated with 16× MIC. After three hours of incubation, smaller cells increased in frequency within populations of cells treated with both ampicillin concentrations. This could be explained by the mode of action of ß-lactam antibiotics that interfere with the synthesis of the peptidoglycan layer, which pro-vides structural strength to the cell and balances osmotic pressure16. Consequently, treatment with the ß-lactams results in a loss of cell-wall integrity, elongation, bulge formation and ultimately cell lysis17,18. This raised the ques-tion of whether increased AF results from the increase in cell size upon antibiotic treatment, as was previously suggested19.
To address this question, we calculated the correlation coefficient r between the cell AF (FL1) and: (i) the FSC that is a proxy for cell size; (ii) the side scattering (SSC) that reflects cell internal complexity (Table S2). r values between FL1 and FSC increased over time for populations treated with the ampicillin concentrations below the MIC, while they decreased for the ampicillin concentration above the MIC. The same tendency was observed for the correlation between FL1 and the SSC.
However, when we normalized AF values of each individual cell with its FSC values, we observed that AF val-ues increased significantly in E. coli cells treated with ≥MIC of ampicillin. The same phenomenon was observed for K. pneumoniae and S. marcescens treated with meropenem (Fig. S2). This result, combined with the correla-tion data between light scattering and cell fluorescence values (Table S2), suggests that the increase in AF is not due to the increase in bacterial cell size. This was observed for four different E. coli strains and two strains from other species, illustrating that the observed phenomena do not depend on a particular genetic background.
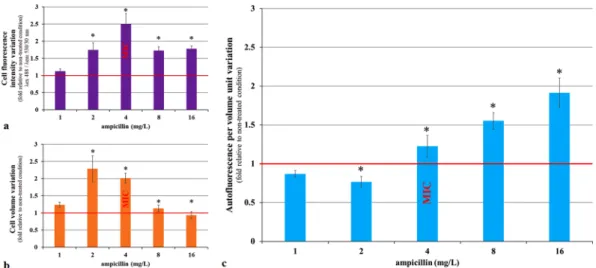
Because the light scattering parameters only give approximate values of cell size and shape, we also analyzed ampicillin-treated E. coli (MIC 4 mg/L) cells using the ImageStream imaging flow cytometer system (Fig. 2). We collected images of 480,000 cells (20,000 cells for each of the six concentrations and four repetitions). We quanti-fied the AF of each cell. We also calculated the volume of each cell using the following formula:
= π ⋅ ⋅ − V 4 width length width 3 , 2
as previously described20. We observed that after 2 hours of incubation, both the AF intensity and the volume of cells treated with 0.25× and 0.5× MIC of ampicillin, increased in comparison to untreated controls. However, because the cell volume increased more than the AF, the AF normalized per cell volume decreased significantly
Figure 1. Effect of ampicillin treatment on the forward light scattering and autofluorescence intensity of E. coli
cells. E. coli 7705035 [MIC = 4 mg/L; (a) and (b)] and 8812112 [MIC = 64 mg/L; (c) and (d)] cells were treated with a range of ampicillin concentrations for 3 hours of the exponential growth. Autofluorescence and forward light scattering signal (FSC) of treated cells and non-treated control were measured after 1, 2 and 3 hours of incubation using the Gallios flow cytometer. (a) and (c) The change in the distribution profiles of the cellular autofluorescence (λex 488 nm/λem 525/20 nm) over time, for the ampicillin concentrations: 0 (green), 4 (red) and
64 mg/L (blue). (b) and (d) 2-dimensional representation of the FSC and FL1 (λex 488 nm/λem 525/20 nm) of
each event (n = 50,000) at 1, 2 and 3 hours of treatment with 0, 4, and 64 mg/L of ampicillin. This figure presents results of one representative experiment which was independently repeated three times. The overlap of green and red produces the khaki area.
(p value < 0.05 - One-way ANOVA Dunn’s comparison test). In cells treated with 1×, 2× and 4× MIC, the nor-malized AF increased significantly (p value < 0.05 - One-way ANOVA Dunn’s comparison test). The nornor-malized AF increase was particularly strong at higher ampicillin concentrations because of the increased frequency of the small cells. Therefore, it can be concluded that an increase in the AF of ampicillin-treated bacterial cells is not an artifact due to increased cell size. Importantly, we also observed a significant increase in the AF of the yeast
Saccharomyces cerevisiae and HeLa human cancer cells treated with a cytotoxic agent, sodium hypochlorite21 (Fig. 3). Taken together, our data indicate that AF increases in stressed prokaryotic and eukaryotic cells.
Protein synthesis is a prerequisite for the increase in autofluorescence.
Because treatment with bactericidal antibiotic ampicillin increases cellular AF, we tested the impact of a bacteriostatic antibiotic tetra-cycline on AF. Tetratetra-cycline inhibits bacterial protein synthesis by preventing the binding of aminoacyl-tRNA to ribosome-mRNA complex22. Therefore, tetracycline prevents cell growth but does not kill cells. ExponentiallyFigure 2. Change in the autofluorescence, volume and autofluorescence per volume unit of E. coli cells after
2 hours of ampicillin treatment. E. coli 7705035 cells were treated, with a range of ampicillin concentrations during exponential growth. After 2 hours of treatment, images of 20,000 cells per condition were collected using the ImageStream flow cytometer system. (a) The cell autofluorescence intensity (λex 488 nm/λem 530/30 nm).
(b) The cell volume. (c) The autofluorescence intensity per volume unit. For each cell, the fluorescence was normalized by the cell volume. Data are represented as a variation relative to a non-treated control. Each value represents the mean (+/−standard error) of the median values of four independent experiments. The asterisk represents significant differences in the ampicillin 1 versus ampicillin 0 (reference) condition according to 1-way ANOVA Dunn’s comparison test p value < 0.05.
Figure 3. Sodium hypochlorite-induced autofluorescence increase in eukaryotic cells. Yeast and human
cells were treated with sodium hypochlorite and their autofluorescence was assessed by flow cytometry (λex
488/λem 525/20 nm). (a) S. cerevisiae SK1 strain. (b) HeLa human cervical cancer cells. Non-treated (blue).
Sodium hypochlorite 0.08% (green), 0.16% (violet), 0.32% (red). S. cerevisiae was treated with 0.08% sodium hypochlorite for 1, 2 and 3 hours, while HeLa cells were treated with sodium hypochlorite for 1 hour. The asterisk represents significant differences relative to the non-treated controls according to the unpaired t-test; p value < 0.05. Each value represents the mean (+/−standard error) of the median values of three independent experiments.
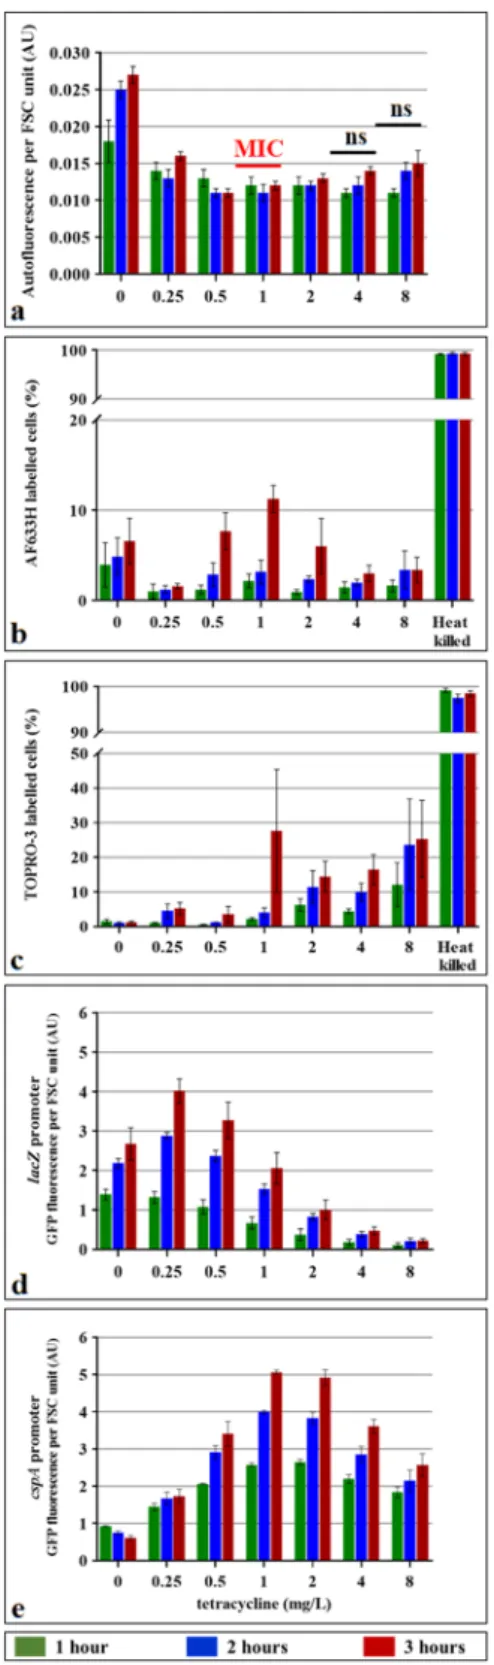
growing cultures of a sensitive E. coli strain were treated with a range of tetracycline concentrations for 3 hours. We did not observe increased AF in tetracycline-treated cells at any of the concentrations tested (Fig. 4).
To confirm that tetracycline did affect treated cells, we used two plasmid-borne reporters which consist of fusions of the promoters of the cspA and lacZ genes to a gene coding for green fluorescent protein (GFP)23. As expected, the expression of the cspA gene, which is known to be induced by treatment with antibiotics that inhibit protein synthesis24, increased upon tetracycline treatment (Fig. 4e). A peculiar structure of the cspA mRNA allows preferential translation, even in the absence of synthesis of other proteins due to antibiotic treatment or low tem-perature25. The lacZ promoter-driven GFP fluorescence decreased with increasing doses of tetracycline in spite of its induction with IPTG, which indicates that tetracycline blocks protein synthesis (Fig. 4). These experiments confirmed that tetracycline had affected treated cells but that this did not increase AF.
We also evaluated the viability of cells treated with tetracycline using the viability markers, Alexa Fluor
™
633 Hydrazide (AFH) which targets carbonyl groups, and TO-PRO™
-3 which binds to DNA in cells with damaged membranes26,27. Both viability markers confirmed that tetracycline did not kill the cells (Fig. 4) but that they both stained heat-killed cells.This raised the question of whether AF did not increase in tetracycline-treated cells because they were alive or because tetracycline inhibited protein synthesis. To address this question, we treated cells with the bactericidal pro-tein synthesis inhibitor gentamicin28 and with the bactericidal agent sodium hypochlorite (Fig. 5). We observed that gentamicin treatment did not increase cellular AF. However, sodium hypochlorite strongly increased cellular AF. Taken together, our data indicate that protein synthesis is a prerequisite for the increase in AF.
Autofluorescence spectra correspond to flavin fluorescence.
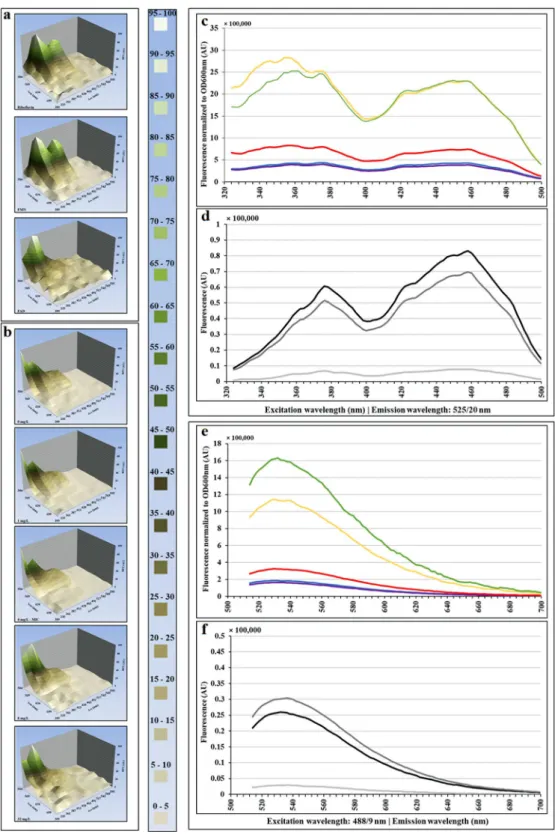
Different fluorescent cellular compo-nents and metabolites have different excitation and emission wavelengths2,4. We aimed to identify the endogenous fluorophores that are responsible for the observed increase in cell AF. Using several excitation and emission wave-length combinations, we investigated the fluorescence per FSC unit of ampicillin-treated E. coli by flow cytometry and fluorimetry. There were two peaks of excitation, one between 320 and 400 nm (maxima at 354 and 372 nm) and another between 408 and 488 nm (maximum at 458 nm, Fig. 6). The peak of emission was 525 nm (Fig. S3). These excitation and emission AF wavelengths correlated well with the flavin spectral properties4. The compar-ison of the excitation and emission AF spectra of cells treated with ampicillin in LB (Fig. S4) or in M9 medium (Fig. 6), with the spectra of purified flavins: riboflavin, FMN and FAD, further confirmed the correlation.To further investigate possible involvement of flavins in the observed ampicillin treatment induced cellular AF, we used reporters to measure expression of ribA, ribB, ribC and ribE, which are essential genes required for FMN and FAD biosynthesis29 (Fig. S5). Expression of ribA, ribC and ribE genes increased significantly in cells treated with ≥1× MIC of ampicillin relative to untreated controls (Fig. 7a). The expression of the ribB gene increased significantly in cells treated with ≥4× MIC of ampicillin relative to untreated controls.
Finally, we tested the impact of the deletion of the yeeO gene that codes for the MATE transporter protein, which exports both FMN and FAD30 on ampicillin-induced AF (Fig. 7b). At 1× MIC of ampicillin, we found that the ΔyeeO strain had higher AF than the control strain, while there was no difference at 0.25× or 0.5× MIC. Taken together, our data suggest that flavins are major contributors to the observed increase in AF in ampicillin-treated cells.
Protective induction of genes coding for flavoproteins in ampicillin-treated cells.
It was esti-mated that 1 to 3% of all bacterial enzymes, most of which are involved in redox processes, depend on the FMN or FAD cofactors for their activity14. Many flavoproteins are involved in the response to various cellular damages, which may explain why flavin biosynthesis pathway is induced by cytotoxic treatments. Binding to flavin cofac-tors was experimentally confirmed for only a small number of proteins31. We examined the activity of promoters of 28 genes coding for the confirmed flavoproteins that we found in the Uri Alon library of transcriptional report-ers23. In addition, we tested the promoter of the soxR gene which codes for the non-flavin-requiring protein that controls SoxRS regulon, including ribA gene32. This regulon is involved in the protection against superoxide and nitric oxide-induced stress. Finally, we used the lacZ gene promoter as a control. The advantage of this control reporter is that it can be fully induced with IPTG. All tested promoters were fused to the gene coding for GFP protein23. The cells were grown with and without ampicillin in 96-well microplates, and optical density and GFP fluorescence were measured for 3 hours (Table 1).We broadly classified the gene promoters that showed significant induction when compared to the lacZ control, in three functional categories according to the gene functions described in the EcoCyc E. coli database (http://ecocyc.org/). (i) Genes coding for protection against ROS and reactive nitrogen species (RNS); soxR, sen-sor and transcriptional regulator of the SoxRS regulon; fpr, a member of the SoxRS regulon, which is involved in the protection against oxidative agents such as methyl viologen and paraquat; nfnB, reduction of nitroaromatic compounds including the antibiotics nitrofurazone and nitrofurantoin; norV/norW, nitric oxide reductase. (ii) Genes coding for the respiratory chain components: poxB, ndh, nuoA and nuoF. (iii) Genes coding for proteins involved in different metabolic pathways: Sulfur metabolism: cysJ, sulfite reductase involved in the assimilation of sulfate (A cysJ mutant is less sensitive to paraquat than wild type); ssuD/ssuE, alkanesulfonate monooxygen-ase allowing utilization of alkanesulfonates as a sulfur source (ssuD deletion mutant is sensitive to heat shock). Amino acid metabolism: aroC involved in biosynthesis of aromatic amino acids; ilvI, participates both in valine and isoleucine biosynthesis; metF, involved in biosynthesis of methionine. Energy metabolism: dfp; catalyzes two sequential reactions in the coenzyme A biosynthetic pathway; mqo, TCA cycle enzyme malate:quinone oxidore-ductase; wrbA having an NAD(P)H:quinone oxidoreductase activity; frdA, catalytic subunits of the fumarate reductase complex.
Figure 4. Effect of tetracycline treatment on the autofluorescence, protein synthesis and viability of E. coli
cells. E. coli 7705035 cells were treated with a range of tetracycline concentrations for 3 hours of the exponential growth. The MIC of this strain is 1 mg/L of tetracycline. Autofluorescence (a) and cell viability were assessed using AF633H (b) and TOPRO-3 (c) dyes and flow cytometer. As a control for staining of dead cells, cells were killed by incubation at 65 °C for 30 min. The impact of tetracycline on protein synthesis was assessed using lacZ (d) and
cspA (e) promoters which were fused to the gene coding for the fast folding green fluorescent protein (GFP). cspA
is known to be induced by protein synthesis inhibiting antibiotics, while lacZ should be repressed. Exponentially growing E. coli cells carrying plasmids with these reporter fusions, as well as promoter-less control plasmid, were incubated with IPTG and a range of tetracycline concentrations for 3 hours. Background autofluorescence was removed by subtracting the promoter-less autofluorescence. GFP fluorescence and FSC of each cell was monitored with the flow cytometer and cell autofluorescence or GFP fluorescence was normalized by the FSC. Values represent the mean (+/−standard error) of the median values of three independent experiments.
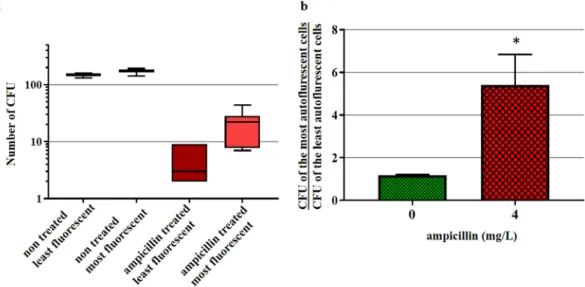
Increased transcription of genes coding for respiration, energy metabolism, different biosynthetic pathways and protection against ROS and RNS indicates that cells treated with ampicillin induce different cellular mech-anisms in order to fix treatment-induced cellular damage and survive. If the increase in these flavoproteins is directly correlated with the increased AF, then the increase in AF should correlate with higher cellular robustness. In order to test this hypothesis, we incubated E. coli cells with the 1× MIC of ampicillin for 2 hours, after which 200 cells per condition, with low and high AF intensity were sorted using FACS, plated on LB agar plates without antibiotic, incubated overnight at 37 °C and compared with untreated controls (Fig. 8). Untreated bacteria did not show any significant difference in the plating efficiency between low AF and high AF populations. However, regarding ampicillin-treated bacteria, the plating efficiency of the high AF population was about 5-fold higher than that of the low AF population. This result supports our hypothesis that AF increase reveals the induction of protective responses to severe stresses.
Discussion
In this study, we examined how the AF of E. coli cells changes as a function of exposure to the different stress-ors. We found that bactericidal stressors, such as ß-lactam ampicillin, significantly increased cellular AF and that de novo protein synthesis is required for the AF increase. We also showed that an increased AF is not an artifactual consequence of an antibiotic-induced cellular morphology. Several lines of evidence suggest that most of the observed increase in the AF comes from flavins. Firstly, the excitation and emission spectra of the AF of ampicillin-treated cells correspond to the spectra of purified flavins: riboflavin, FMN and FAD. Similarly, Mihalcescu et al.11 have studied AF of E. coli grown in comparable conditions and have shown that flavins FMN, FAD and riboflavin, were responsible for more than 80% of the fluorescence at wavelength 525 nm. They also reported that most of the remaining 20% of fluorescent molecules could be attributed to other flavin deriva-tives. Secondly, ribA, ribB, ribC, and ribE genes required for the FMN and FAD biosynthesis are induced with the ampicillin treatment. Thirdly, ampicillin-treated cells with deletion of the yeeO gene that codes for the MATE transporter protein exporting both FMN and FAD, have higher AF increases than ampicillin-treated cells with the functional yeeO. Fourthly, many of the tested genes coding for flavoproteins are overexpressed in ampicillin-treated cells.
We also demonstrated that increased AF is not just a collateral consequence of the cytotoxic treatment, but that it corresponds to the activation of a complex adaptive response that increases cell robustness to severe stresses. This is primarily illustrated by the fact that the plating efficiency of the high AF intensity ampicillin-treated cells was, on average, 5-fold higher than that of the low AF intensity ampicillin-treated cells. Cellular functions of
Figure 5. Effects of gentamicin and sodium hypochlorite treatment on the autofluorescence of E. coli cells.
E. coli 7705035 cells were treated with a range of gentamicin concentrations corresponding to 0 (red), 0.125
(light blue), 0.25 (orange), 0.5 (MIC; light green), 1 (dark green), 2 (brown) and 4 mg/L (violet) or 0.08% sodium hypochlorite (grey) for 3 hours of the exponential growth. Autofluorescence and FSC of treated cells and untreated control were measured after 1, 2 and 3 hours of incubation using a flow cytometer. Cell autofluorescence was normalized by the FSC signal to obtain the autofluorescence per FSC unit. (a), (b) and (c) 1, 2 and 3 hours of gentamicin treatment respectively. The overlap of red, light blue, orange, light green and dark green produces the brown area. (d), (e) and (f) 1, 2 and 3 hours of sodium hypochlorite treatment respectively. This figure presents results of representative experiments, which were independently repeated 4 times.
Figure 6. Comparison of excitation and emission spectra of ampicillin-treated E. coli cells and purified flavonoid
compounds. E. coli 7705035 cells [MIC = 4 mg/L] growing exponentially in M9 medium supplemented with glucose, were treated with a range of ampicillin concentrations for 6 hours. After 6 hours of treatment, the excitation and emission spectra of treated cells were established and compared with the spectra of FAD, FMN and riboflavin. Three-dimensional representation of fluorescence spectra of flavins (a) and E. coli (b). (c) and (e): excitation and emission spectra of E. coli cells treated with ampicillin, normalized to the optical density at 600 nm. The colors represent ampicillin concentrations: 0 (blue line), 1 (violet line), 4 (red line), 8 (yellow line) and 32 mg/L (green line). (d) and (f): excitation and emission spectra of 10 µM purified flavonoid compounds: FAD, FMN and riboflavin. The colors represent: light grey for FAD, black for FMN and dark grey for riboflavin. This figure presents results of representative experiments, which were independently repeated 4 times.
the observed ampicillin-induced genes indicate how increased flavin production can contribute to increased cell robustness. These genes code for flavoproteins that are involved in respiration, energy metabolism, different biosynthetic pathways and protection against ROS and RNS. The observed induction of the ribA, ribB, ribC and ribE genes by ampicillin treatment is important for increased supply of the FMN or FAD cofactors for fla-voproteins. In addition, the ribA gene is a member of the SoxRS regulon and is also inducible by paraquat and superoxide-generating compounds32. This protein can also hydrolyze 8-oxo-dGTP which is a potent mutagenic substrate for DNA synthesis33. Importantly, AF increased significantly relative to the untreated control when the concentration of bactericidal stressor was close to or above the MIC. Therefore, AF can be used for the evaluation of susceptibility of bacterial pathogens to the bactericidal, non-protein synthesis inhibiting antibiotics.
A common reaction of the prokaryotic and eukaryotic cells to stress is the increase in energy production, which is required to deal with macromolecular damages. For this, cells increase respiratory activity, which increases ATP production, but also accidental ROS production that must be rapidly eliminated. The AF of the NAD and FAD cofactors is widely used to follow changes in energy production by the respiratory chain in eukar-yotic cells, as well as to monitor the redox state of the stressed cells34,35. FAD fluorescence can be quenched when they are protein bound. However, it was also observed that FAD fluorescence increases when they are bound to mitochondrial lipoamide dehydrogenase (LipDH) and electron transfer flavoprotein (ETF), which are respon-sible for 75% of the flavin autofluorescence in rat liver mitochondria36,37. Importantly, it was reported that the amount of electron-transfer fluorescent flavoproteins correlates with respiration rates in eukaryotic cells34,36,38.
NAD and FAD fluorescence reflects the redox state of cells. For example, the reduced form of the NAD, NADH, is strongly fluorescent, while its oxidized form NAD+ is poorly fluorescent2,4. Thus, it was observed that oxidative stress results in a decrease in fluorescence due to the oxidation of NADH in human cells treated with hydrogen peroxide or menadione39,40. The opposite is the case for FAD, which is fluorescent in the oxidized form and not in the reduced form. Our data show that the spectra of ampicillin-treated cells are very similar to the spectra of oxidized FAD, while they did not fit with the spectra of reduced FAD41.
An increase in the oxidized/reduced ratio of flavins may result in increased fluorescence without necessar-ily increasing flavin concentration. This could be the case in the cells treated with sodium hypochlorite, which is a potent oxidizing agent. However, the neosynthesis of flavoproteins also contributes to an increase in AF in stressed cells. The flavoproteins play a crucial role in energy metabolism, drug and xenobiotic metabolism, immune defense, chromatin remodeling, DNA repair, and apoptosis14,42,43 (and references therein). Therefore, the increased AF of the eukaryotic cells corresponds to the induction of responses to cope with the deleterious effects of the life-threatening stress, like we observed in bacterial cells. For example, increased flavin concentrations were reported to be involved in the increased AF of the human and murine cells following ionizing radiation44.
In conclusion, this study shows that increased AF indicates that prokaryotic and eukaryotic cells are experi-encing severe life-threatening stress. The observed increase in AF may come from both oxidation and synthesis of flavins. The relative contribution of oxidation and/or flavin neosynthesis to the AF increase is likely determined by the nature and strength of the stressor. Therefore, measurement of AF variations in general and that of flavins
Figure 7. Expression of rib genes in ampicillin-treated E. coli cells. (a) The promoters of lacZ (dark blue), ribA
(green), ribB (violet), ribC (light blue) and ribE (orange) genes were fused to the gene coding for the fast-folding green fluorescent protein (GFP). The promoter of the lacZ gene was induced with IPTG (red). E. coli MG1655 strains (MIC ampicillin = 2 mg/L) carrying plasmids with these transcription reporter fusions were grown with a range of ampicillin concentrations. After 3 hours of incubation, GFP fluorescence (λex 488/9/λem 525/20 nm)
and OD600 nm of treated cells and non-treated control were measured using a fluorimeter. The fluorescence
increase was calculated using the non-treated control of each strain as reference. (b) Wild type BW25113 strain and its ∆yeeO derivative were treated with a range of ampicillin concentrations during exponential growth. Autofluorescence (λex 440/9/λem 525/20 nm) and OD600nm of treated cells and non-treated controls were
measured using a fluorimeter. To calculate the increase in the autofluorescence due to ampicillin treatment, autofluorescence of treated cells was first normalized by OD600nm and then by the normalized autofluorescence
of the non-treated controls of each strain. Each value represents the mean (+/−standard error) of the
fluorescence increase from six independent experiments. The asterisk represents significant differences with the
and flavoproteins in particular, can be used to study the cellular metabolic state and the molecular mechanisms involved in the response to stress, but also for various diagnostic applications in prokaryotic and eukaryotic cells.
Material and Methods
Strains, growth media and culture conditions.
Bacterial and yeast strains, as well as human cell lines used in this study, are described in Table S1. Overnight liquid bacterial cultures were grown aerobically in 50 mL Falcon tubes in Lysogeny broth (LB) medium, Difco LB broth, Miller (Becton Dickinson, Franklin Lakes, USA) at 37 °C with shaking. For experiments, overnight cultures were diluted 104-fold in appropriate media supplementedwith antibiotics or chemicals when needed, and grown aerobically at 37 °C with shaking in 50 mL Falcon tubes. Yeast strains were grown aerobically in 50 mL Falcon tubes at 30 °C for 48 hours in liquid Yeast Extract-Peptone-Dextrose (YPD) (Becton Dickinson) medium supplemented with 2% (final) glucose. For
Ampi 1/Ampi 0 Ampi 2 (MIC)/Ampi 0 Ampi 4/Ampi 0 Mean fold
increase Standard error p value Mean fold increase Standard error p-value Mean fold increase Standard error p-value Controls
lacZ 0.97 0.06 reference 1.19 0.08 reference 3.25 0.23 reference
lacZ IPTG 0.98 0.01 0.9694 1.23 0.03 0.9674 2.68 0.11 0.7101
Protection against ROS and reactive nitrogen species (RNS)
soxR 0.97 0.15 0.747 2.36 0.41 0.0062 11.29 1.46 0.0003
fpr 0.92 0.06 0.7568 2.14 0.13 0.0035 7.43 0.58 0.0158
nfnB 1 0.08 0.7189 2.29 0.31 0.0024 10.93 0.51 <0.0001
norV/norW 1.23 0.1 0.0908 3.77 1.04 0.0003 14.91 1.42 <0.0001
Genes coding for the respiratory chain components
poxB 0.86 0.22 0.4071 2.23 0.28 0.006 8.21 1.5 0.0096
ndh 1.02 0.06 0.4608 1.86 0.09 0.0368 10.66 0.78 0.0001
nuoA/nuoF 1.38 0.13 0.0192 3.29 0.64 0.0006 10.9 1.61 0.0006
ycaK 1.26 0.08 0.0221 2.41 0.35 0.0044 8.9 0.36 0.0029 Genes coding for proteins involved in different metabolic pathways
cysJ 1.92 0.73 0.0499 3.78 0.19 <0.0001 17.01 2.42 <0.0001 ssuD/ssuE 1.15 0.27 0.0704 5.96 1.18 <0.0001 16.33 2.01 <0.0001 aroC 1.14 0.3 0.2625 2.91 0.39 0.0004 19.1 2.43 <0.0001 ilvI 1.59 0.18 0.006 3.04 0.47 0.0003 11.07 0.94 0.0002 metF 0.77 0.05 0.1393 1.89 0.33 0.0443 7.02 1.12 0.0347 dfp 1 0.08 0.768 2.1 0.29 0.0088 9.55 0.58 0.0007 mqo 1.23 0.1 0.0699 3.15 0.38 <0.0001 9.76 1.95 0.0024 wrbA-1 1.11 0.04 0.0998 1.99 0.07 0.01 4.96 0.66 0.3019 wrbA-2 1.1 0.03 0.1287 1.78 0.06 0.0689 4.37 0.28 0.4863 wrbA-3 1.04 0.03 0.3303 2.3 0.09 0.0009 5.17 0.7 0.2311 frdA 1.18 0.15 0.2568 2.13 0.46 0.0062 6.12 0.86 0.1119 ycdH/ycdM 1.04 0.08 0.5753 2.78 0.42 0.0005 9.43 1.04 0.0017 Not induced fldA 1.01 0.02 0.6475 1.64 0.07 0.1935 7.74 0.39 0.0086 gcl 0.79 0.04 0.1099 0.77 0.08 0.5638 7.31 0.75 0.018 glpA 1.07 0.01 0.2036 1.59 0.04 0.2704 5.02 0.34 0.2777 glpD 1 0.01 0.7167 1.76 0.09 0.0802 4.19 0.24 0.5631 lpd 0.95 0.05 0.8387 1.61 0.06 0.2186 6.3 0.11 0.0683 pdxH 1.01 0.03 0.6753 1.5 0.04 0.4295 5.26 0.22 0.2582 sdhA/sdhC 0.85 0.03 0.2015 1.31 0.07 0.7818 3.4 0.32 0.9274 uxaC 1.08 0.05 0.2231 1.7 0.07 0.1295 6.34 0.35 0.072 yieF/yieE 0.76 0.03 0.0772 0.96 0.08 0.7004 2.81 0.29 0.777
Table 1. Expression of 28 genes coding for flavoproteins, the soxR and lacZ genes in ampicillin-treated E. coli
cells. Promoters of the tested genes were fused to the gene coding for the fast-folding green fluorescent protein (GFP; λex 488/9/λem 525/20 nm). E. coli MG1655 strains (MIC ampicillin = 2 mg/L) carrying plasmids with
these transcription reporter fusions were grown with a range of ampicillin concentrations. After 3 hours of incubation, GFP fluorescence (λex 488/9/λem 525/20 nm) and OD600nm of treated cells and non-treated control
were measured using a fluorimeter. Fluorescence was normalized by the OD600nm. Each value represents the
mean (+/−standard error) of the fluorescence increase compared with the non-treated condition of each strain from six independent experiments. Significant differences with the lacZ control according to the 1-way ANOVA Dunn’s test < 0.05 are presented in bold.
experiments, 48 hour yeast cultures were diluted 104-fold in liquid YPD medium and grown aerobically at 30 °C
with shaking.
HeLa cells were cultured in Dulbecco’s Modified Eagle’s medium (DMEM) (Thermo - Fisher Scientific, Waltham, USA) supplemented with 10% fetal bovine serum (Gibco sera, South American origin). The cells were grown in a humidified atmosphere of 5% CO2 at 37 °C and the medium was changed every 2 days.
Antibiotics and chemicals.
Ampicillin, ciprofloxacin, gentamicin, imipenem, meropenem and tetracycline were purchased from Sigma-Aldrich (Saint Louis, USA). 100× stock solutions of each antibiotic were prepared in water and then diluted in culture media to appropriate concentrations. Alexa Fluor™
633 Hydrazide (AF633H), TOPRO©-3 and 16% Paraformaldehyde (PFA) methanol free were purchased from Thermo - Fischer Scientificand diluted in Phosphate Buffer Saline (PBS) (Gibco, Thermo - Fischer Scientific). Flavin Mono Nucleotide (FMN), Flavin Adenine Dinucleotide (FAD) and Riboflavin were purchased from Sigma-Aldrich.
Flow cytometry and cell sorting.
We used a Gallios (Beckman Coulter, Brea, USA) analyzer 10 color, 4 laser system to analyze samples. FL1 channel (excitation at 488 nm with bandpass filters of 525/20 nm) was used for autofluorescence analysis. FL6 channel (excitation at 638 nm with bandpass filters of 660/20 nm) was used for AF633H and TOPRO®
- 3 analysis. Samples were run at a rate between 1,000 and 2,000 events/s; 20,000 to 50,000 events were collected depending on sample type (prokaryotic or eukaryotic cells). Data acquisition was performed using the Kaluza software.For ImageStream cytometry, samples were acquired on the ImageStreamX MarkII system (Amnis Corporation, Seattle, USA) using a 488 nm laser (Bandpass filter 505–560 nm). 20,000 events per condition were collected. The IDEAS software (Amnis) was used to analyze the measurements. Image acquisition and image analysis were performed using the IMAG’IC Facility (Institut Cochin, Paris, France).
For cell sorting, we used a S3e cell sorter (Bio-Rad, Hercules, USA). FL1 channel (excitation at 488 nm emis-sion at 525/30 nm). Samples were run at an event rate of 1,200 events/s and 200 cells per condition were sorted in 200 µL 1x PBS with the “single cell” sort mode. Data acquisition was performed using the ProSortTM software
(Bio-Rad).
Autofluorescence variation analysis.
Overnight bacterial and 48 hour yeast cultures were diluted in 20 mL LB or YPD medium respectively, to obtain a final 600 nm Optical Density (OD600nm) ≤ 0.05 with aBiophotometer plus (Eppendorf, Hamburg, Germany). Cultures were incubated aerobically at 37 °C for bacte-ria and 30 °C for yeast, in 50 mL Falcon tubes with orbital shaking until reaching an OD600nm of 0.2 (AU). At
this point, the bacterial cultures were subdivided into 50 mL Falcon tubes and sodium hypochlorite or different amounts of antibiotics were added to obtain a range of antibiotic concentrations. Incubation was performed at 37 °C for bacteria and 30 °C for yeast, with agitation. Samples of treated and untreated control cells were taken every hour, diluted in 500 µL 1x PBS to obtain around 1,000 to 2,000 events/s for bacteria and 500 to 1,000 events/s for yeast and immediately analyzed with the flow cytometer. For the Imagestream X analysis, aliquots of cells were fixed with 2% (final) methanol free paraformaldehyde for 10 minutes at room temperature, washed with PBS and kept on ice until analysis.
Figure 8. Autofluorescence as a predictor of the survival of ampicillin-treated E. coli cells. E. coli 7705035 cells
were incubated with 4 mg/L ampicillin (MIC). After 2 hours of incubation, the autofluorescence of treated and non-treated control cells was analyzed using the S3e cell sorter. 200 of the least and 200 of the most autofluorescent cells were sorted and plated on LB agar. After overnight growth, colony-forming units (CFU) were counted to assess the bacterial survival. (a) Box plot of the CFUs. (b) The mean ratio (+/−standard error) between the number of CFUs of the most and the least fluorescent cells of treated and non-treated control cells per experiment. Presented data are from six independent experiments. The asterisk represents significant difference according to paired T-test p value: 0.034.
HeLa cells were treated with sodium hypochlorite (0.08%; 0.16%, 0.32%). After 1 hour of incubation, cells were collected, washed with PBS, and analyzed by flow cytometry.
Cell viability assessment.
Samples of bacterial cells prepared for autofluorescence variation analysis (see above) were killed by incubation at 65 °C for 30 min, and stained with 2 µg/mL AF633H or 0.5 µM TOPRO®
-3 iodide dyes. Cells labeled with AF633H were incubated for 15 min on ice and in the dark, and then washed with cold PBS before flow cytometry analysis. Cells labeled with TOPRO®
-3 were incubated at room temperature for 15 min in the dark before flow cytometry analysis.Analysis of the fluorescence spectra.
Bacterial overnight cultures were diluted in LB or M9 - glu-cose medium (Becton Dickinson) (supplemented with 0.003% B1 vitamin and 1 mM MgSO4) to obtain anOD600nm ≤ 0.05. M9 medium was used to avoid background fluorescence from proteins and other natural
mole-cules usually found in complex media like LB. Diluted cultures were subsequently incubated aerobically at 37 °C in 50 mL Falcon tubes with orbital shaking until reaching an OD600nm of 0.2 (AU). At this point, bacterial cultures
or medium without bacteria as a control, were distributed in 5 Falcon tubes and different amounts of antibiotic were added to each tube to obtain a range of antibiotic concentrations. Tubes were subsequently incubated at 37 °C with agitation. Every hour, 100 µL of the bacterial cultures or the control medium were sampled and added to the wells of the 96-well black microplate containing 100 µL 1x PBS.
Purified flavonoid compounds were diluted in sterile water to obtain a stock concentration of 20 µM. 100 µL of the stock solution were added to 100 µL 1x PBS in the 96-well microplate. OD600nm measurements and
fluores-cence scans were performed using an Infinite M200 PRO and an Infinite M1000 (Tecan, Männedorf, Switzerland) reader.
Gene expression measurements.
To evaluate how antibiotic treatments affect gene expression, we used strains from a library of E. coli strains carrying transcriptional fusions of gfp to different promoters23. Overnight cultures containing 12.5 µg/mL kanamycin were diluted in LB medium to obtain an OD600nm of 0.1. 200 µLsam-ples were then dispensed in the 96-well microplates. After 2 hours of incubation at 37 °C with orbital shaking allowing to obtain bacteria in an exponential growth phase, 40 µL of culture were added to a 37 °C warmed microplate containing a range of ampicillin concentrations (0 to 16 mg/L). 25 µL of mineral oil were added to the top of each well to prevent evaporation. Using a programmable robotic system “Freedom Evo” (Tecan), plates were incubated at 37 °C. OD600nm and GFP fluorescence (λex 488/9 nm λem 525/20 nm) were measured using an
Infinite M200 PRO. lacZ promoter was used as a negative control. When the same promoter was used as a positive control, 0.2 mM IPTG were added to the growth medium. The medium background was subtracted and GFP flu-orescence was divided by the OD600nm. Gene expression was presented as the increase in fluorescence compared
to the non-treated condition.
Autofluorescence and cell survival experiment.
Overnight E. coli cultures were diluted in 20 mL LB in 50 mL Falcon tubes to a final OD600nm ≤ 0.05, and incubated aerobically at 37 °C with orbital shaking until anOD600nm of 0.2 (AU) was reached. Half of the obtained bacterial cultures were treated with 4 mg/L of ampicillin,
which corresponds to the MIC, while the other half was used as an untreated control. After 2 hours of incuba-tion, aliquots of the untreated and treated cultures were diluted in PBS and analyzed using the S3e cell sorter. Samples were run at 1,200 events/s, the FSC/FL1 dot plot was established and 2 gates were defined. The first gate corresponded to the least fluorescent cells and the second to the most fluorescent ones. 400 cells in each gate were sorted into 200 µL 1X PBS using the “single cell” sort mode. A 100 µL suspension of each sorted cell population was deposited on LB agar plates without ampicillin allowing cell recovery. Colony forming units were counted after overnight incubation at 37 °C.
Data analysis.
Flow cytometry data analysis and fluorescence normalization were performed using the Flowjo© V10.2 software (Flowjo, Ashland, USA). Data from the microplate reader and Imagestream X werepro-cessed using Magellan 7.2 (Tecan) and Excel© 2010 (Microsoft
®
, Redmond, USA). Statistical analyses wereper-formed using Prism V7.0 (GraphPadTM, La Jolla, USA). FCS Express V4 (De novo software, Los Angeles, USA)
was used to export raw data from the flow cytometer for correlation analysis.
References
1. Billinton, N. & Knight, A. W. Seeing the wood through the trees: A review of techniques for distinguishing green fluorescent protein from endogenous autofluorescence. Analytical Biochemistry 291, 175–197 (1984).
2. Croce, A. C. & Bottiroli, G. Autofluorescence spectroscopy and imaging: a tool for biomedical research and diagnosis. Eur J
Histochem 58, 2461 (2014).
3. Georgakoudi, I. & Quinn, K. P. Optical imaging using endogenous contrast to assess metabolic state. Annu Rev Biomed Eng 14, 351–367 (2012).
4. Monici, M. Cell and tissue autofluorescence research and diagnostic applications. Biotechnol Annu Rev 11, 227–256 (2005). 5. Buryakina, T. Y. et al. Metabolism of HeLa cells revealed through autofluorescence lifetime upon infection with enterohemorrhagic
Escherichia coli. J Biomed Opt 17, 101503 (2012).
6. Pincus, Z., Mazer, T. C. & Slack, F. J. Autofluorescence as a measure of senescence in C. elegans: look to red, not blue or green. Aging
(Albany NY) 8, 889–898 (2016).
7. Leblanc, L. & Dufour, E. Monitoring the identity of bacteria using their intrinsic fluorescence. FEMS microbiology letters 211, 147–153 (2002).
8. Patino, S. et al. Autofluorescence of mycobacteria as a tool for detection of Mycobacterium tuberculosis. J Clin Microbiol 46, 3296–3302 (2008).
9. Leriche, F. et al. Alteration of raw-milk cheese by Pseudomonas spp.: monitoring the sources of contamination using fluorescence spectroscopy and metabolic profiling. J Microbiol Methods 59, 33–41 (2004).
10. Bao, N., Jagadeesan, B., Bhunia, A. K., Yao, Y. & Lu, C. Quantification of bacterial cells based on autofluorescence on a microfluidic platform. J Chromatogr A 1181, 153–158 (2008).
11. Mihalcescu, I., Van-Melle Gateau, M., Chelli, B., Pinel, C. & Ravanat, J. L. Green autofluorescence, a double edged monitoring tool for bacterial growth and activity in micro-plates. Phys Biol 12, 066016 (2015).
12. Zimmermann, H. F., Trauthwein, H., Dingerdissen, U., Rieping, M. & Huthmacher, K. Monitoring aerobic Escherichia coli growth in shaken microplates by measurement of culture fluorescence. Biotechniques 36, 580–582 (2004).
13. Hyman, J. M. et al. Evaluation of a Fully Automated Research Prototype for the Immediate Identification of Microorganisms from Positive Blood Cultures under Clinical Conditions. mBio 7, e00491–16 (2016).
14. Macheroux, P., Kappes, B. & Ealick, S. E. Flavogenomics–a genomic and structural view of flavin-dependent proteins. FEBS J 278, 2625–2634 (2011).
15. Falconer, S. B., Czarny, T. L. & Brown, E. D. Antibiotics as probes of biological complexity. Nature chemical biology 7, 415–423 (2011).
16. Spratt, B. G. Distinct penicillin binding proteins involved in the division, elongation, and shape of Escherichia coli K12. Proceedings
of the National Academy of Sciences of the United States of America 72, 2999–3003 (1975).
17. Tipper, D. J. & Strominger, J. L. Mechanism of action of penicillins: a proposal based on their structural similarity to acyl-D-alanyl-D-alanine. Proceedings of the National Academy of Sciences of the United States of America 54, 1133–1141 (1965).
18. Yao, Z., Kahne, D. & Kishony, R. Distinct single-cell morphological dynamics under beta-lactam antibiotics. Molecular cell 48, 705–712 (2012).
19. Renggli, S., Keck, W., Jenal, U. & Ritz, D. Role of autofluorescence in flow cytometric analysis of Escherichia coli treated with bactericidal antibiotics. Journal of bacteriology 195, 4067–4073 (2013).
20. Volkmer, B. & Heinemann, M. Condition-dependent cell volume and concentration of Escherichia coli to facilitate data conversion for systems biology modeling. PloS one 6, e23126 (2011).
21. Winter, J., Ilbert, M., Graf, P. C., Ozcelik, D. & Jakob, U. Bleach activates a redox-regulated chaperone by oxidative protein unfolding.
Cell 135, 691–701 (2008).
22. Chopra, I. & Roberts, M. Tetracycline antibiotics: mode of action, applications, molecular biology, and epidemiology of bacterial resistance. Microbiol Mol Biol Rev 65, 232–260 (2001).
23. Zaslaver, A. et al. A comprehensive library of fluorescent transcriptional reporters for Escherichia coli. Nat Methods 3, 623–628 (2006).
24. Shapiro, E. & Baneyx, F. Stress-activated bioluminescent Escherichia coli sensors for antimicrobial agents detection. J Biotechnol 132, 487–493 (2007).
25. Etchegaray, J. P. & Inouye, M. CspA, CspB, and CspG, major cold shock proteins of Escherichia coli, are induced at low temperature under conditions that completely block protein synthesis. Journal of bacteriology 181, 1827–1830 (1999).
26. Saint-Ruf, C., Cordier, C., Megret, J. & Matic, I. Reliable detection of dead microbial cells by using fluorescent hydrazides. Applied
and environmental microbiology 76, 1674–1678 (2010).
27. Saint-Ruf, C. et al. Antibiotic Susceptibility Testing of the Gram-Negative Bacteria Based on Flow Cytometry. Frontiers in
microbiology 7, 1121 (2016).
28. Tangy, F., Moukkadem, M., Vindimian, E., Capmau, M. L. & Le Goffic, F. Mechanism of action of gentamicin components. Characteristics of their binding to Escherichia coli ribosomes. Eur J Biochem 147, 381–386 (1985).
29. Bacher, A., Eberhardt, S., Fischer, M., Kis, K. & Richter, G. Biosynthesis of vitamin B2 (riboflavin). Annu Rev Nutr 20, 153–167
(2000).
30. McAnulty, M. J. & Wood, T. K. YeeO from Escherichia coli exports flavins. Bioengineered 5, 386–392 (2014).
31. Langer, S., Hashimoto, M., Hobl, B., Mathes, T. & Mack, M. Flavoproteins are potential targets for the antibiotic roseoflavin in Escherichia coli. Journal of bacteriology 195, 4037–4045 (2013).
32. Koh, Y. S., Choih, J., Lee, J. H. & Roe, J. H. Regulation of the ribA gene encoding GTP cyclohydrolase II by the soxRS locus in
Escherichia coli. Molecular & general genetics: MGG 251, 591–598 (1996).
33. Kobayashi, M. et al. Potential of Escherichia coli GTP Cyclohydrolase II for Hydrolyzing 8- Oxo-dGTP, a Mutagenic Substrate for DNA Synthesis. The Journal of biological chemistry 273, 26394–26399 (1998).
34. Heikal, A. A. Intracellular coenzymes as natural biomarkers for metabolic activities and mitochondrial anomalies. Biomark Med 4, 241–263 (2010).
35. Bartolome, F. & Abramov, A. Y. Measurement of mitochondrial NADH and FAD autofluorescence in live cells. Methods Mol Biol
1264, 263–270 (2015).
36. Kunz, W. S. & Gellerich, F. N. Quantification of the content of fluorescent flavoproteins in mitochondria from liver, kidney cortex, skeletal muscle, and brain. Biochem Med Metab Biol 50, 103–110 (1993).
37. Kunz, W. S. & Kunz, W. Contribution of different enzymes to flavoprotein fluorescence of isolated rat liver mitochondria. Biochim
Biophys Acta 841, 237–246 (1985).
38. Kunz, W. S. Spectral properties of fluorescent flavoproteins of isolated rat liver mitochondria. FEBS Lett 195, 92–96 (1986). 39. Bondza-Kibangou, P., Millot, C., Dufer, J. & Millot, J. M. Microspectrofluorometry of autofluorescence emission from human
leukemic living cells under oxidative stress. Biol Cell 93, 273–280 (2001).
40. Bondza-Kibangou, P., Millot, C., Dufer, J. & Millot, J. M. Modifications of cellular autofluorescence emission spectra under oxidative stress induced by 1 α, 25dihydroxyvitamin D3 and its analog EB1089. Technol Cancer Res Treat 3, 383–391 (2004).
41. Galban, J., Sanz-Vicente, I., Navarro, J. & de Marcos, S. The intrinsic fluorescence of FAD and its application in analytical chemistry: a review. Methods Appl Fluoresc 4, 042005 (2016).
42. Joosten, V. & van Berkel, W. J. Flavoenzymes. Curr Opin Chem Biol 11, 195–202 (2007).
43. Piano, V., Palfey, B. A. & Mattevi, A. Flavins as Covalent Catalysts: New Mechanisms Emerge. Trends in biochemical sciences 42, 457–469 (2017).
44. Schaue, D., Ratikan, J. A. & Iwamoto, K. S. Cellular autofluorescence following ionizing radiation. PloS one 7, e32062 (2012).
Acknowledgements
We thank Claudine Navas, William Michael Dunne and Arnaud Gutierrez for critical reading of the manuscript. We thank Pierre Bourdoncle, IMAG’IC Facility, Institut Cochin, Paris, France, for technical assistance with the Imagestream X Mark II. HeLa cells were kindly provided by Dr. Benoît Miotto (Institut Cochin, INSERM U1016, Paris, France). Jérémy Surre was supported by a fellowship, from the French Association Nationale de la Recherche et de la Technologie (ANRT) number 2014/0300. This work was supported by grants from: Idex ANR-11-IDEX-0005-01/ANR-11-LABX-0071 and FRM Grant DBF20160635736.
Author Contributions
J.S., C.S.-R., S.O., M.R. and I.M. designed the study. J.S., V.C. and C.S.-R. performed experiments. J.S. and C.S.-R. analyzed data and prepared figures and tables. J.S., C.S.-R., S.O., M.R. and I.M. wrote the main manuscript. All authors reviewed the manuscript.
Additional Information
Supplementary information accompanies this paper at https://doi.org/10.1038/s41598-018-30623-2.
Competing Interests: The authors declare no competing interests.
Publisher's note: Springer Nature remains neutral with regard to jurisdictional claims in published maps and
institutional affiliations.
Open Access This article is licensed under a Creative Commons Attribution 4.0 International
License, which permits use, sharing, adaptation, distribution and reproduction in any medium or format, as long as you give appropriate credit to the original author(s) and the source, provide a link to the Cre-ative Commons license, and indicate if changes were made. The images or other third party material in this article are included in the article’s Creative Commons license, unless indicated otherwise in a credit line to the material. If material is not included in the article’s Creative Commons license and your intended use is not per-mitted by statutory regulation or exceeds the perper-mitted use, you will need to obtain permission directly from the copyright holder. To view a copy of this license, visit http://creativecommons.org/licenses/by/4.0/.