Decoding the Secret to Faster Drug Production through Simulation Modeling by
Mimi L. Tsai
Bachelor of Science, Hotel Administration, Cornell University
SUBMITTED TO THE PROGRAM IN SUPPLY CHAIN MANAGEMENT IN PARTIAL FULFILLMENT OF THE REQUIREMENTS FOR THE DEGREE OF
MASTER OF ENGINEERING IN LOGISTICS
MASSACHUSETTS INSTITUTE OF TECHNOLOGY June 2016
C2016 Mimi Tsai. All rights reserved.
MASSACHUSETTS 'NTTUTE
OF TECHNOLOGY
JUN 30 2016
LIBRARIES
ARCHIVES
The author hereby grants to MIT permission to reproduce and to distribute publicly paperand electronic copies of this thesis document in whole or in part in any medium now known or hereafter created.
Signature of Author ...
Certified by ...
Accepted by ...
Signature redacted
Master 'oEngireering in Logistics ProgramMay 6, 2016
Signature redacted
.=:fDr. Bruce C. Aritzen Executive Director, Supply Chain Management Program Thesis Supervisor
Sianature redacted
/V
Dr. Yossi SheffiDirector, Center r Transportation and Logistics Elisha Gray II Professor of Engineering Systems
Decoding the Secret to Faster Drug Production through Simulation Modeling by
Mimi L. Tsai
SUBMITTED TO THE PROGRAM IN SUPPLY CHAIN MANAGEMENT ON MAY 6,2016 IN PARTIAL FULFILLMENT OF THE
REQUIREMENTS FOR THE DEGREE OF
MASTER OF ENGINEERING IN LOGISTICS
Abstract
For many manufacturing facilities, process improvement efforts are a luxury when faced with heightened competitive pressures and a fast-paced work environment where fires are constantly being fought. This need for speed is even more important for startup companies who are racing against time to get their product to the market. Continuous improvement and Lean projects typically span from trial-and-error experiments to changes based on lengthy analyses. Biotech startup Company XYZ has felt the effects of these forces and launched a new effort to improve its operations via continuous improvement and Lean, ultimately reducing costs and improving productivity of operations. This thesis examines one example of a process improvement effort at Company XYZ's pre-clinical manufacturing facility. This project involved characterizing the cycle time and process flow, leading to targeted actions to increase the throughput and reduce the amount of time and effort to manufacture their drugs. Tools and ideas from Lean and Six Sigma were applied and a recommendation and next steps were presented to the company. This thesis also provides a broader demonstration of how such continuous improvement efforts can fit into the pharmaceutical and biotechnology industries.
Thesis Supervisor: Dr. Bruce Arntzen
Acknowledgements
To my family with love and gratitude
To my mentor and thesis advisor, Dr. Bruce Arntzen, for his vision and guidance
and to my thesis sponsor, John K., for his enthusiasm and support
Note on Proprietary Information
In order to protect proprietary Company XYZ information, the data presented throughout this thesis have been altered and do not represent the actual values used by Company XYZ. The product, process steps, operational efficiencies, and cycle times have been disguised in order to protect competitive information where necessary.
Table of Contents
Abstract ... 2
Acknowledgem ents ... 3
Note on Proprietary Inform ation ... 5
1 Introduction ... 7
1.1 Com pany XYZ ... 7
1.2 Problem Statem ent ... 7
1.3 Approach ... 8
1.4 Thesis Overview ... 9
1.5 Literature Review ... 9
2 Process Im provem ent ... 13
2.1 Initiate and Define Problem ... 15
2.2 Baseline Current State ... 16
2.3 Design Future State ... 23
3 Results and Discussion ... 29
3.1 Discussion ... 29
4 Conclusion and Recom m endations ... 38
4.1 Conclusion ... 38
4.2 Recom m endations for Future W ork ... 38
1 Introduction
1.1 Company XYZ
Company XYZ is a startup biotechnology company researching and developing protein therapies based on novel drug technology to treat a wide range of diseases. This includes those that cannot be effectively developed or manufactured with existing methods. Company XYZ's preclinical production supplies drugs to internal and external customers to facilitate research and drive drug development.
This thesis is the result of a six-month partnership with Company XYZ. Work was conducted in the company's Pre-Clinical Supply Chain Group. This group is tasked with the lean transformation of the pre-clinical manufacturing network in order to improve operating efficiency and ensure supply of high quality products for clients.
1.2 Problem Statement
The purpose of the project was to improve capacity and reduce turnaround time of the drug synthesis process. This was done through optimizing product flow and improving efficiency/utilization of both machinery and personnel. The project's key questions included:
1. Can the current production process be modeled accurately to predict actual throughput?
2. How can capacity and turnaround time be improved through more efficient use of resources?
3. What changes can be made in the current process to improve efficiency?
4. What is the current and future capacity of the production line and where should we invest to increase this capacity?
1.3 Approach
The approach taken during the project is similar to the DMAIC framework: Define, Measure, Analyze, Improve, and Control (Barney & McCarty, 2003). While the project timeline did not allow for suggestions to be implemented and controlled, the thesis did complete the first three steps of this framework. A handful of tools were selected from the Lean and Six Sigma toolkits. Lean tools included process mapping, cycle time analysis, and promoting employee involvement. Six Sigma tools included visualization of data, listening to the customer's voice, and structured brainstorming.
The thesis entailed weekly interaction with the managers, production leads, and operators. These key contacts were essential for providing valuable information and immediate feedback to ensure the quality of analysis. Their input was also critical to accurately model the baseline current state and to understand the feasibility of designing future states.
1.4 Thesis Overview
This thesis is organized into the following chapters: Chapter 1 provides an introduction to the thesis. Chapter 2 provides deeper discussion on the thesis project approach and results. Chapter 3 provides results and discussion. Chapter 4 offers conclusions and recommendations.
1.5 Literature Review
This thesis seeks to improve the cycle time and throughput of Company XYZ's drug production process. While there are numerous studies of the ideas of Lean, Six Sigma, and business process improvement, this research focused on those most relevant and applicable to Company XYZ's manufacturing process.
Six Sigma
Six Sigma seeks to improve manufacturing and business processes by identifying and removing the causes of defects and minimizing variability. One of Six Sigma's core methodologies is DMAIC, which stands for five phases: Define, Measure, Analyze, Improve, and Control. The purpose of the Define step is to clearly articulate the business problem, goal, potential resources, project scope and high-level project timeline. The Measure phase establishes current baselines as the basis for improvement. The purpose of the Analyze step is to identify, validate and select root cause for elimination. A large number of potential root causes of the project problem are identified via root cause analysis. During the Improve phase, the purpose is to identify, test and implement a
solution to the problem in part or in whole. Lastly, the Control phase tries to sustain the gains through monitoring improvements to ensure continued and sustainable success (Motorola, Inc.).
Value Stream Mapping
Value stream mapping is a lean-management method for analyzing the current state and designing a future state for the series of events that take a product or service from its beginning through to the customer. A value stream map is typically created as a one-page flow chart depicting the current production path or design path of a product from the customer's request to delivery. An important goal of value stream mapping is to identify processes that do not provide value so they can be improved. In lean production, value is anything the customer is willing to pay for. Processes that do not provide value are called waste. Value stream maps document the current state of the value stream as well as the future state of the value stream and define any gaps between the two (Womack & Jones, 2003).
Business Process Mapping
A business process map is a more simplified version of a value stream map. Also known as flow process charts, business process mapping is a picture of the separate steps of a process in sequential order. The following elements may be included: sequence of actions, materials or services entering or leaving the process, decisions that must be made, people who become involved, time involved at each step and/or process measurements. This tool can be adapted for a wide variety of purposes. The four major
steps of process mapping are: 1.) Process identification - understanding all the steps of a process, 2.) Information gathering - identifying objectives, risks, and key controls in a process, 3.) Interviewing and mapping - understanding how all the resources activities interact with each other in the process and designing actual maps, and 4.) Analysis -utilizing tools to enable the process to run more effectively and efficiently (Gilbreth & Gilbreth, 1921).
Drum-Buffer-Rope
The Drum-Buffer-Rope (DBR) production methodology was developed by Eliyahu Goldratt. The system is founded on Goldratt's work in the Theory of Constraints (TOC), which proposes that every system has a bottleneck, which limits the throughput of the entire system. Increasing the capacity of the bottleneck will increase the capacity of the system up to the point where another bottleneck arises. Increasing the capacity of a non-bottleneck operation will not add to the capacity of the system.
The bottleneck is usually the process in the production line that accumulates the longest queue. The machine that operates at low capacity or breaks down frequently is typically the bottleneck and limits the other machines or processes to a lower capacity utilization rate. Bottleneck Analysis improves the throughput by strengthening the weakest link in the manufacturing process. An objective of the DBR system is to hold a sufficient amount of WIP in front of the bottleneck operation to protect it from starvation. No inventory is justified in front of other stations, since their processing rate will not affect the rate of the system as a whole.
When the bottleneck station completes one unit, a signal is sent (Drum) to the work release control to start work on another unit. As a result, a consistent amount of work in process inventory is held in the system prior to the bottleneck (Rope). Much of this work is held in inventory directly in front of the bottleneck (Buffer). Work beyond the bottleneck station is completed as rapidly as possible (Goldratt & Cox, 1984).
The thesis drew upon these tools and applied them to Company XYZ's drug manufacturing process to help optimize product flow and improve resource efficiency and utilization.
2 Process Improvement
Biopharmaceutical processes are designed to produce batches of product for traceability and control purposes. Therapeutic cell manufacturing processes can be broken down in two major phases: Upstream and Downstream processing.
The Upstream process is the entire process from early cell isolation and cultivation to cell banking and culture expansion of the cells until final harvest (termination of the culture and collection of the live cell batch). Upstream includes the expansion, or proliferation, of the cells from a small starting volume and concentration to a much larger quantity of cells that can produce the protein of interest in sufficient quantities for the customer's needs. Therefore, Upstream can be considered production of the cells needed and also the final production of the protein of interest. Media containing nutrients are feedstock as well as the starting "seed" or volume of cells from a working cell bank. Expression of the genes to produce the product of interest occurs as the last step before isolation of the product in Downstream processing.
Downstream processing encompasses all of the processes needed to isolate and purify the cell mass from Upstream to meet purity and quality requirements. These processes include separation of biomass, cell disruption, concentration of broth, initial purification of metabolites, de-watering, and polishing of metabolites. Care must be taken to minimize damage to the product, maximize yield of the product, and prevent introduction
of any foreign unwanted substances. After the formulated product is produced, it is further processed into vials or syringes, labeled, and packaged for sale and distribution.
At the outset of the project, weekly meetings were held with managers, process leaders, and operators to conceptually understand the process flow from Downstream to Upstream. After interviewing these key stakeholders, it was determined that the Upstream process had significant resources dedicated to process improvement already and it would be more helpful for the thesis project to focus on the Downstream process. To gain a better understanding of how an order travelled through this latter process, a business process flow map was created. This type of map was opted over a value stream map since the goal was to visually depict the process flow in a simple manner that could lay the groundwork for developing a simulation model.
The process improvement project was broken down into three major phases that encompassed the four major steps of process mapping:
1. Initiating and Defining the Problem
a. This phase included understanding all the steps of a process and identifying objectives, risks, and key controls in a process flow through interviews with key individuals at Company XYZ,
2. Designing a Baseline Current State
a. This phase included understanding how all the resources and activities interact with each other in the process and designing actual maps. The process flow can be simulated through a model to understand average cycle times, bottlenecks, and asset utilization rates,
3. Designing a Future State
a. This phase included simulation modeling to enable the process to run more effectively and efficiently (Gilbreth & Gilbreth, 1921). Changing inputs and variables in the baseline model enables the ability to understand resulting costs and benefits. Variables that can be changed include the number of employees, machines, and work shifts employed by Company XYZ.
2.1 Initiate and Define Problem
Interviews with managers, production leads, and operators in the Downstream process were conducted weekly to understand the process flow and how activities were completed (e.g. orders processed individually or in batches). Furthermore, the production leads provided estimates of the average cycle times for each process step since historical cycle time data was not available. The goal was to collect enough information to create a baseline process flow map that would form the foundation for a simulation model.
2.2 Baseline Current State
In addition to the interviews and observations, other essential information was collected. This included gathering the below information from the thesis sponsor:
* How many operators worked on each shift,
- How the operators were assigned to different tasks,
e How machines were allocated to the operators, e How orders were moved between the steps, and e What was the capacity for each machine.
Currently, Company XYZ has five employees in the first shift and four employees in the second shift. First shift runs from 7 a.m. until 3 p.m. with a one-hour lunch break and second shift runs from 2 p.m. until 10 p.m. with a hour lunch break. There is a one-hour overlap between the shifts where leads provide updates to each other on the status of the orders. Furthermore, during first shift there are no employees staffed on steps C and E; during second shift, there are no employees staffed on steps B and D. Each shift also has a floater: during first shift, this employee assists with steps B and D, whereas the floater on second shift is solely dedicated to step C. Through experience, Company XYZ has determined that a total of 24 orders can be efficiently-processed on a daily basis (16 during first shift and 8 during second shift).
The first draft of the map was presented to the managers and leads for review. After incorporating their revisions into a second draft, the map was presented to operators for review. Operators from first and second shift provided feedback and revisions until a final map was created that accurately reflected the Downstream baseline current state. This is shown in Figure 1. This map shows each of the five major phases comprising the Downstream process and each of the sub-steps that fall under those five phases.
A ErO: ySI1 A Enmc eyesZ E Errq ye % te' . ) -eMat r.
L
-rr 4 !!eA tr-e 61BAL
- DO
E c CC >--9 C.2 D-0 ICA C Ce -L 2 ---")I 3- -- -- r4ee 1 .-sr- --- '--- --- ---E ---Era 1: cs' -0 E-1 .0 a:meE-I 'C? E-eFigure 1: Map of Existing Process Flow
The second part of creating the map entailed including actual cycle times for each of the steps. As mentioned previously, these cycle times were collected from estimates provided by the operators since historical data for all steps were not available from Company XYZ's database.
This map served two purposes: to create a visual representation of their existing process and to lay the groundwork for a model that could simulate their current process and potential solutions. This map is also useful for visually helping personnel to understand where their tasks fit into the overall production flow and how they can impact it.
A simulation model based on the finalized process flow map was created using a process simulation software created by ProcessModel, Inc. called ProcessModel. The baseline model simulated production over five weeks and was given a two-week warm-up period before it started collecting the data. The software generated a report providing information such as the throughput, average cycle time of an order, average number of hours an order would spend at each step and the percent utilization rate for each resource (personnel and equipment).
The report for this baseline model highlighted many key areas for improvement, namely underutilized employees who could be re-allocated elsewhere during their downtime and bottlenecks that needed to be explored to reduce lengthy in-queue wait time.
In the baseline current state, the throughput was 608 orders in a five-week period and the average cycle time for an order was 6.4 days. Table 1 presents the average cycle time per step in the baseline model. Overall, an order took an average of 5.3 to 6.4 days to complete the entire process. There were significant in-queue wait times for all steps. After the A-i step, an order can either be processed through Machine A-2a or Machine A-2b depending on the size of the order. Of all their orders, Company XYZ processes 90% of their orders through Machine A-2a. Similarly, after completing the C step, an order can begin the D step either through Machine D- 1 a or Machine D- lb depending on the size of the order. Of all their orders, Company XYZ processes 99% of their orders through the Machine D-lb. Thus, an order can travel through one of four routes to complete the process:
1. Machine A-2a in the A step and then Machine D-l a in the D step, 2. Machine A-2a in the A step and then Machine D-lb in the D step,
3. Machine A-2b in the A step and then Machine D- I a in the D step, or 4. Machine A-2b in the A step and then Machine D- lb in the D step.
Table 1: Average Cycle Time -Baseline Model (in Days)
Process In Queue Processing Total
A 0.5 0.3 0.8 Machine A-2a 0.2 0.0 0.2 Machine A-2b 0.0 0.1 0.1 B 0.3 0.8 1.0 C 1.0 0.2 1.3 D 0.3 0.0 0.3 Machine D-l a 0.0 0.5 0.5 Machine D-lb 0.5 1.0 1.5 E 0.5 0.7 1.2
Cycle Time for Each Route
Machine A-2a & Machine D-la 2.7 2.7 5.4 Machine A-2a & Machine D-lb 3.2 3.1 6.4 Machine A-2b & Machine D-la 2.6 2.7 5.3
Machine A-2b & Machine D-lb 3.1 3.2 6.3
An order going through any one of the four routes spent 50% of its time, on average, waiting in the queue to be processed. The in-queue wait times are an area with significant improvement opportunities, especially since the majority of the resources were idle more than 50% of the time as shown in Figures 2 and 3. Employee utilization rates were calculated by dividing the number of hours the resource was in use over the resource's number of scheduled hours:
Utilization Rate = (# Times Resource is Used * Avg. Hour per Usage)/Resource's Scheduled Hours
Figure 2: Employee Utilization Rates A Employee 1.1 A Employee1.2 B Employee 1 Floater I D Employee I A Employee2 C Employee I Floater 2 E Employee 1 0% 10% 20% 30% 0% in Use
Figure 3: Equipment Utilization Rates
40% 50% 60% 70% 80% 90% 100% % Idle Machine A-2a Machine A-2b Machine A-4 Machine A-6 Machine B-4 Machine B-2 Machine C-2 Machine D- I a Machine D-6 Machine D- lb Machine E-I Machine E-6 Machine C-3
-
~ I U :AL 0% 10% 20% 30% 40% 50% 60% 70% 80% 0% in Use 90% 100% % Idle .The in-queue wait times had several main causes: 1.) a machine could process only one order at a time, even though it could hold multiple orders at once, 2.) the cycle time for a subsequent step took longer than the previous step, creating a bottleneck, and 3.) there was a scheduling issue related to the availability of employees.
The longest in-queue wait time occurred at the C step, where an order waited on average for 1 day. Through discussions with Company XYZ, it was determined that the following were feasible changes that could be implemented to process orders more expeditiously: 1.) cross-training of employees, 2.) increasing the number of employees, and 3.) adding a 3rd shift. The results of these potential future state simulations are presented in the next section.
2.3 Design Future State
Company XYZ currently has implemented limited cross training of its employees to handle the various steps in the process. The expected number of daily orders fed into the process was maintained at the baseline level (a total of 24 orders). The first set of simulation models maintained the number of existing staff, but re-allocated them across the entire process so that every step had someone working on it, even if it was part time. The table below shows the distribution of employees and the simulation results. In the scenario "Re-Allocate 1," the floater on first shift was solely dedicated to process C and the second employee on process A now split his time between steps A and E. For the "Re-Allocate 2" scenario, the only additional change from "Re-Allocate 1" was
designating one employee to every step, instead of having a floater, since there were enough resources to be spread throughout the process.
Table 2: Simulation Results of Re-Allocating Existing Staff
Baseline Re-Allocate 1 Re-Allocate 2
Qty. Processed 608 608 592
Avg. Cycle Time (Days) 6.4 6.2 6.0
Total # Employees 9 9 9 1st Shifi Employees 5 5 5 A 2 1.5 1 B 1.5 1 1 C --
1
1
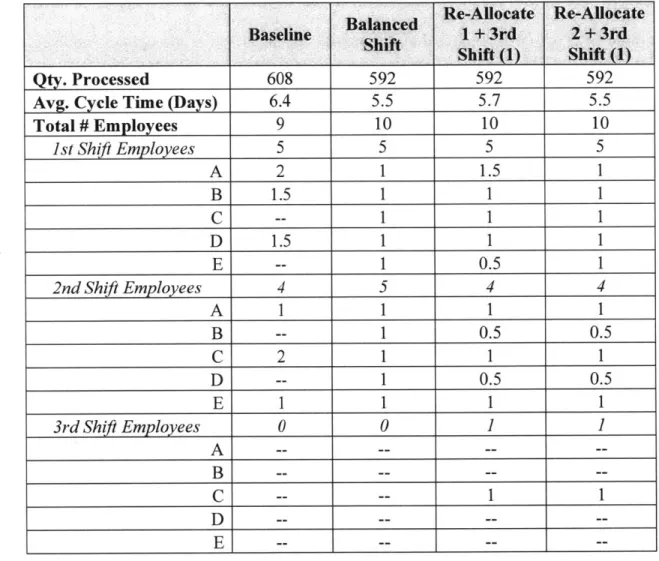
D 1.5 1 1 E -- 0.5 1 2nd Shift Employees 4 4 4 A 1 1 1 B -- 0.5 0.5 C 2 1 1 D -- 0.5 0.5 E 1 1 1The second simulation model set experimented with adding one employee and a third shift. The "Balanced Shift" scenario simply added an employee to the second shift so that both shifts could have one employee dedicated to each task. In the other two scenarios run under this set, the models built upon the earlier "Re-Allocate 1" and "Re-Allocate 2" scenarios and an employee was allocated to a third shift for step C, since this step had the longest average cycle time.
Table 3: Simulation Results of Adding 1 Employee and a 3rd Shift
Re-Allocate Re-Allocate Baseline Balanced 1 + 3rd 2 + 3rd
Shift Shift (1) Shift (1)
Qty. Processed 608 592 592 592
Avg. Cycle Time (Days) 6.4 5.5 5.7 5.5
Total # Employees 9 10 10 10 1st Shift Employees 5 5 5 5 A 2 1 1.5 1 B 1.5 1 1 1 C --
1
1
1
D 1.5 1 1 1 E -- 1 0.5 1 2nd Shift Employees 4 5 4 4 A 1 1 1 1 B -- 1 0.5 0.5 C 2 1 1 1 D -- 1 0.5 0.5 E 1 1 1 1 3rd Shift Employees 0 0 1 1A
-- -- ----B
-- -- ----C
-- --1
1
D
-- -- ----E
-- -- ----In the last simulation model, two additional employees and a third shift were added. Company XYZ expressed that they were unlikely to add more than two employees in the near future, so this last simulation set explored the potential benefits that could be gained under the scenarios of having a total of 11 employees. Both of the scenarios built off of the "Balanced Shift" scenario and experimented with adding an extra person in step C either in the first or third shifts. As mentioned earlier, the resource was dedicated here because it was the bottleneck. The "Balanced Shift + 3rd Shift" scenario provided the
most improvement in throughput and average cycle time of all the simulation scenarios run. The throughput was 624 orders in a five-week period and the average cycle time for an order was 4.9 days. Figures 4 and 5 provide a comparison of throughput and average
cycle time for all simulation models run.
0 Table 4: Simulation Results of Adding 2 Employees and a 3rd Shift
Balanced Balanced Baseline Shift + 1st Shift + 3rd
Shift (1) Shift (1)
Qty. Processed 608 608 624
Avg. Cycle Time (Days) 6.4 5.4 4.9
Total # Employees 9 11 11
Ist Shifi Employees 5 6 5
A 2 1 1 B 1.5 1 1 C -- 2 1 D 1.5 1 1 E -- 1 1 2nd Shift Employees 4 5 5 A 1 1 1 B -- 1 1 C 2 1 1 D -- 1 1 E 1 1 1 3rd Shit Employees 0 0 1
A
-- ----B
-- ----C
----D
-- -- --E -- ----Figure 4: Comparison of Throughput for all Simulation Models 3.00% 2.00% 1.00% 0.00% -1.00% -2.00% Re-Allocate Re-A I llocate Balanced 2 Shift
Re-Allocate Re-Allocate Balanced
1+ 3rd 2+ 3rd Shift+ st
Shift (1) Shift (1) Shift (1)
Figure 5: Comparison of Average Cycle Time for all Simulation Models
0.00% -5.00% -0.00% -15.00% -20.00% -25.00% -30.00%
Re-Allocate Re-Allocate Balanced
1 2 Shift Re-Allocate Re-Allocate 1 + 3rd 2 + 3rd Shift (1) Shift (1) -3.00% Balanced Shift + 3rd Shift (1) Balanced Shift+ 1st Shift (1) Balanced Shift + 3rd Shift (1)
Of all the scenarios run, only the "Balanced Shift + 3rd Shift" scenario resulted in an
increase in throughput. The number of orders processed increased by 2.6% from 608 orders in the baseline current state to 624 under this scenario. Additionally, the reduction in average cycle time was the highest under this scenario compared to all other scenarios. Orders experienced a decrease of 24.2% or 1.5 days in average cycle time going from 6.4 days in the baseline state to 4.9 days under this scenario. Assuming the two additional employees had similar salaries to the existing nine employees, Company XYZ's labor cost would increase by 22.2%. Depending on the financial values of a single order (increase in throughput) and single day (reduction in cycle time), Company XYZ would be able to determine if the benefits from this scenario would outweigh the increase in labor cost.
"Balanced Shift + 1't Shift" scenario provided the second best improvement in average
cycle time (a reduction of 15.6% or 1 day). It is interesting to note that the "Balanced Shift" scenario provided the third best improvement in average cycle time. This result is not surprising given that employees are a major contribution to the Downstream process' capacity. By spreading out the resources evenly across all steps and both shifts, the capacity can be more level and the impacts or presence of bottlenecks can be reduced. While the throughput was reduced by 15% in this "Balanced Shift" scenario, Company XYZ may want to consider further exploring this option if only one additional employee can be hired.
3 Results and Discussion
This thesis project recommends that Company XYZ consider hiring two additional staff members - one employee to be added on second shift so that every step has a dedicated
staff member across the first two shifts; the second employee to be added on third shift and solely dedicated to step C, since that is the main bottleneck. The throughput is increased by 2.6%, which means that on an annual basis, Company XYZ can process an additional 160 orders. This calculation assumes a year contains 50 working weeks with two weeks off for holidays. Additionally, the average cycle time is reduced by 10.1% from 6.4 days in the baseline current state to 4.9 days in the recommendation. Labor cost could increase by 22.2% and Company XYZ will need to determine if this additional expense will be outweighed by the financial benefits generated by an improvement in throughput and reduction in cycle time.
3.1 Discussion
After the A-1 step, an order can either be processed through Machine A-2a or Machine A-2b depending on the size of the order. Of all their orders, Company XYZ processes 90% of their orders through Machine A-2a. Similarly, after completing the C step, an order can begin the D step either through Machine D- 1 a or Machine D- lb depending on the size of the order. Of all their orders, Company XYZ processes 99% of their orders through Machine D-lb.
As shown in Figure 6, the average cycle time is improved by 23% to 28% in all the four routes that an order can travel in the Downstream process
Figure 6: Comparison of Average Cycle Time - Baseline vs. Recommendation
7.0 6.0 5.0 4.0 3.0 2.0 1.0 0.0
Machine A-2a & Machine A-2a & Machine A-2b & Machine A-2b & Machine D- 1 a Machine D- lb Machine D- 1 a Machine D- lb
Baseline *Recommendation
Figures 7 and 8 display the changes in average in-queue and processing cycle times for each of the five steps in the Downstream process. Overall, average in-queue cycle times were reduced for all steps except for step E. For our bottleneck, step C, the in-queue cycle time was improved by nearly 20% changing from 1 day in the baseline current state to 0.8 days in the recommended future state.
Similarly, the average processing cycle times (the time it actually took to process an order in that step) were improved for all steps, except for steps C and E.
Figure 7: Comparison of Avg. In-Queue Cycle Time -Baseline vs. Recommendation 1.2 1.0 10.8 S0.6 0.4 0.2 0.0 A B C D E Baseline U Recommendation
Figure 8: Comparison of Avg. Processing Cycle Time -Baseline vs. Recommendation 1.0 E 'C 0 0.9 0.8 0.7 0.6 0.5 0.4 0.3 0.2 0.1 0.0 A B C D E Baseline 0 Recommendation CIP
Figures 9 and 10 provide comparisons of the employee and equipment utilization rates. The average employee utilization rate in the baseline current state was 36.1% and declined to 23.2% in the recommendation state. Additionally, the average equipment utilization rate also showed a decline from 21.8% in the baseline state to 20.1% in the recommendation state. While throughput and average cycle time were improved by having more employees process orders, each employee had lower utilization because there was excess capacity. There was not as much work for each employee to do because they did not have to multi-task; rather, they could simply focus on the step to which they were assigned.
Figure 9: Comparison of Employee Utilization Rates -Baseline vs. Recommendation
80.0 70.0 60.0 C 0 50.0 40.0 -30.0 20.0 10.0 0.0 Baseline * Recommendation \OA 32
I
Figure 10: Comparison of Equipment Utilization Rates -Baseline vs. Recommendation ' 80.0 70.0 -- - __ _ _ 60.0 50.0 - -40.0 30.0 20.0 10.0 0.0 Baseline Recommendation
The thesis project also conducted a stress test for this recommendation scenario based on changing the number of orders fed into the process. Table 5 provides a comparison of resulting throughput and average cycle time in the recommendation scenario by changing this variable.
Table 5: Stress Test Results by Changing # of Input Orders
# Orders Throughput (% Change Avg. Cycle % Change
Time ______ 24 624 2.6% 4.9 -24.1% 26 624 2.6% 5.5 -13.7% 28 688 13.2% 4.6 -28.4% 30 736 21.1% 5.2 -19.6% 32 784 28.9% 5.5 -14.4% 34 832 36.8% 6.1 -5.5% 36 848 39.5% 5.9 -7.6% 40 880 44.7% 7.8 21.6%
By maintaining the same number of input orders as the baseline state (24 orders), Company XYZ could anticipate a 2.6% increase in throughput and 24.1% decrease in cycle time. With 2 additional employees, Company XYZ could theoretically increase the number of input orders since there are more employees to process the orders and the stress test provided evidence of this. Based on the results, Company XYZ could increase the orders to 30 per day and anticipate an even higher increase in throughput of 21.1% (an increase of 1,280 orders annually) compared to the Baseline. While the average cycle time would slightly increase from not changing this variable, Company XYZ could still realize a 19.6% reduction in average cycle time to 5.2 days.
The company will face decreasing efficiency and benefits through additional input orders as demonstrated with the increase in average cycle time with a daily input of 40 orders. It is important to keep in mind that the model should reflect reality as closely as possible. At some point, changing too many levers or altering variables too drastically can provide results that may seem appealing, but fail to reflect reality.
By only adding and changing staff count, Company XYZ can anticipate an improvement ceiling to be reached. Bottlenecks still exist in the process flow due to varying batching sizes. Goldratt's work in the Theory of Constraints (TOC) was applied in determining how employees could be more optimally spread across the process flow based on bottlenecks created by batching sizes. Increasing the capacity of the bottleneck will increase the capacity of the system up to the point where another bottleneck arises (Goldratt & Cox, 1984). The bottlenecks for each step were calculated and it was
determined that the optimized split of existing staff to smooth the bottlenecks would be dedicated as shown in Table 5.
Table 6: Optimized Re-Allocation of Existing Staff
Shift A B C D E Total
1st 0.6 1.6 1.4 1 0.4 5
2nd 0.5 1.3 1.1 0.7 0.4 4
In this example, during first shift, there would be one dedicated staff to steps B, C, and D; one floater who split 60% of his time in step A and 40% of his time in step E; and a second floater who split 60% of his time in step B and 40% of his time in step C. During second shift, there would be one dedicated staff to steps B and C; one floater who split
50% of his time in step A, 10% of his time in step C, and 40% of his time in step E; and a second floater who split 30% of his time in step B and 70% his time in step D.
However, since staff members working on step C are needed to walk orders through the entire step, it is necessary to have dedicated staff members in this step (not partial employees who can help part of the time). Under this restriction, it would be necessary to increase the number of staff on step C to two on both shifts, which would result in needing 7 employees on each of the two shifts shown in Table 6.
Table 7: Optimized Additional Staff Shift A B 1st 0.8 2.2 2nd 0.8 2.2 C D 2 1.3 2 1.3 E Total 0.7 7 0.7 7
In this scenario, both shifts would have two dedicated employees each for steps B and C; one dedicated employee for step D; one floater who split 80% of his time in step A and
20% of his time in step B; and a second floater who split 30% of his time in step D and
70% of his time in step E.
While there are benefits to cross training employees and the simulation models indicated improvements in throughput and cycle time, these results could be optimistic due to productivity loss in employees driven by multi-tasking. Psychologists who study what happens to mental processes when people try to perform more than one task at a time have found that the mind and brain were not designed for heavy-duty multitasking. Multitasking can take place when someone tries to perform two tasks simultaneously, switch from one task to another, or perform two or more tasks in rapid succession.
In the mid-1990s, Robert Rogers, PhD, and Stephen Monsell, D.Phil, found that even when people had to switch completely predictably between two tasks every two or four trials, they were still slower on task-switch than on task-repeat trials. Moreover, increasing the time available between trials for preparation reduced but did not eliminate the cost of switching. There thus appears to be two parts to the switch cost - one attributable to the time taken to adjust the mental control settings (which can be done in
advance it there is time), and another part due to competition due to carry-over of the control settings from the previous trial (Rogers & Monsell, 1995).
Although switch costs may be relatively small, sometimes just a few tenths of a second per switch, they can add up to large amounts when people switch repeatedly back and forth between tasks. Thus, multitasking may seem efficient on the surface but may actually take more time in the end and involve more error (Rubinstein & Meyer, 1994).
Company XYZ would need to further explore the costs and benefits of requiring employees to multi-task before implementing this potential solution. The thesis project provides a discussion in the next section of other areas that could be explored for further progress in throughput and cycle time.
4 Conclusion and Recommendations
4.1 Conclusion
The experiences, interactions, and conversations from the thesis project at Company XYZ have been very promising in terms of the chance that process improvement will be successful. Company XYZ has been making steady progress improving their Upstream process and undoubtedly will do the same for the Downstream process. The excitement, motivation, and dedication to improve their operations were palpable.
The simulation models demonstrated the impacts of the different potential solutions suggested by the company in an expedient, cost-effective, and analytical manner. This tool is applicable to other manufacturers who desire to improve their processes, but are limited by time and budget.
4.2 Recommendations for Future Work
While the thesis project provided the results of multiple simulation scenarios, there are additional opportunities to expand the model:
e Inclusion of feedback loops to model orders that experience failure throughout the
process. The thesis project modeled approximately 80% of Company XYZ's orders that made it through the Downstream process successfully in the first run.
e Modification of the batch sizes in each step to smooth the capacity across the
entire process and reduce bottlenecks.
- Modification of number of input orders in all scenarios run to determine the impact on throughput and average cycle time.
* Inclusion of an optimized employee re-allocation simulation model. - Inclusion of productivity loss in employees who have to multi-task.
Lastly, it would be recommended that Company XYZ conduct time studies to collect the actual cycle times for each step to ensure more accurate inputs into the simulation models.
The investigation into this predictive labor modeling and labor loading/balancing tool through simulation modeling proved to be an effective way for Company XYZ to visualize how they can adjust staff size more efficiently and effectively. Furthermore, taking into account additional factors (like batch size modification and feedback loops) will also help Company XYZ evaluate needs and improvement opportunities more broadly. These tools can readily be applied to not only other companies in the biotech industry, but also other manufacturing facilities in other industries.
References
Barney, M., & McCarty, T. (2003). The New Six Sigma. Upper Saddle River: Prentice Hall PTR.
Gilbreth, F., & Gilbreth, L. (1921). Process Charts. American Society of Mechanical Engineers.
Goldratt, E.M., & Cox, J. (1986). The Goal: A Process of Ongoing Improvement. Great Barrington, MA: North River Press.
Motorola, Inc. (n.d.). Motorola University What is Six Sigma? Retrieved April 5,
2016, from
https://web.archive.org/web/2005 110602573 3/http://www.motorola.com/content/0,,3 079,00.htnl.
Rogers, R. & Monsell, S. (1995). The costs of a predictable switch between simple
cognitive tasks. Journal of Experimental Psychology.
Rubinstein, J., Evans, J. & Meyer, D. E. (1994). Task switching in patients with
prefrontal cortex damage. Journal of Cognitive Neuroscience.