DESIGN AND IMPLEMENTATION OF CELLULAR MANUFACTURING IN A JOB SHOP ENVIRONMENT
by
Liana Maria Alvarez L6pez
B.S., Naval Architecture and Marine Engineering, Massachusetts Institute of Technology, 1987 M.S., Naval Architecture and Marine Engineering, Massachusetts Institute of Technology, 1993
Submitted to the Sloan School of Management and the Department of Mechanical Engineering
in Partial Fulfillment of the Requirements for the Degrees of Master of Business Administration
and
Master of Science in Mechanical Engineering
in Conjunction with the
Leaders for Manufacturing Program
at the
Massachusetts Institute of Technology
May 1997
© 1997 Massachusetts Institute of Technology, All rights reserved
Signature of Author
Sloan chool of Management Department of Mchanical Engineering May 23, 1997 Certified by
61
Professor Eugene E. Covert, Thesis Advisor Department of Aeronautics and AstronauticsCertified by
Professor Stephen C. Graves, Thesis Advisor Sloan School of Management
Accepted by
Professor Ain Sonin, Chairman, Graduate Committee Department of Mechanical Engineering
Certified by
Larry Abeln, Defiror of Master's Program Sloan School of Management
¾~ Vs~r
Design and Implementation of Cellular Manufacturing
in a Job Shop Environmentby
Liana Maria Alvarez L6pez
Submitted to the Sloan School of Management and the Department of Mechanical Engineering
in Partial Fulfillment of the Requirements for the Degrees of
Master of Business Administration
and
Master of Science in Mechanical Engineering
Abstract
The thesis proposes a method for introducing cellular manufacturing in an operating job shop. By applying cellular manufacturing to produce part families with similar manufacturing
processes and stable demand, plants expect to reduce costs and lead-times and improve quality and delivery performance. The thesis outlines a method for assessing, designing, and
implementing cellular manufacturing, and illustrates this process with an example. A
manufacturing cell that produces aluminum parts for commercial customers is implemented at Boeing's Defense and Space Group Machining Center. The conclusions of the thesis highlight the key lessons learned from this process.
Thesis Advisors:
Professor Eugene E. Covert, Department of Aeronautics and Astronautics Professor Stephen C. Graves, Sloan School of Management
Acknowledgments
The author gratefully acknowledges the support and resources made available to her through the MIT Leaders For Manufacturing Program, a partnership between MIT and major U.S.
manufacturing companies.
I would like to express my sincere thanks to Al Koszarek and all those at Boeing who helped and encouraged me through my internship, and made the "cell" come true.
The author is also grateful to her thesis supervisors, Prof. Graves and Prof. Covert, for their guidance through the internship and thesis process.
To my classmates and friends at MIT and away, thank you for being there for me, I could not have done it without you. Last but certainly not least, I thank my parents, my sister and Michael for their love and strength, the surest signs of God's kindness.
Table of Contents
1. Introduction ... 11
1.1 Linking Boeing's Defense and Space Group Business and Manufacturing Strategies ... 12
1.2 Background on the Machining Center ... 14
1.2.1 C ustom ers... ... ... 16
1.2.2 Business Process Flow ... ... .... ... 19
1.2.3 C apacity Planning System s ... 20
1.2 .4 M etrics ... .... . ... .. .. ... ... 2 3 1.2 .5 C urrent Situation ... .. ... . ... 24
1.3 Goal of Project ... 25
2. Assessment of Cellular M anufacturing ... 26
2.1 Product-Process Matrix ... 26
2.2 Functional and Product Flow Layouts: Benefits and Limitations ... 27
2.3 Cellular M anufacturing: Benefits and Limitations ... 29
2.4 Is There a M atch? ... .. . .. . . .. . . . .. . . . .. . . . .. . . . .. . . . 30
2.5 Cell Design and Implementation Process ... 31
3. Cell Planning Phase ... 36
3.1 Assessment ... 36
3.2 Assessment at the Machining Center ... 38
3.2.1 Machining Center's Current Situation ...39
3.2.2 Why a Cell at the Machining Center? ... . ... . . .. .. .. . .. .. . . . .40
3.3 Design ... ... 41
3.3.1 A ssem ble Leadership Team ... 42
3.3.2 Identify Feasible Part Families... ... ... 43
3.3.3 D esign C ell Process... ... ... ... 45
3.3.4 Launch the Performance Analysis... ... ... 46
3.3.5 Finalize Design Before Implementation... ... ... 46
3.4.1 Cell Vision Team ... 47
3.4.2 Defining Part Families ... 48
3.4.3 Defining Cell Process...51
3.5 Perform ance Analysis ... ... 53
3.5.1 Performance Analysis for M achining Center Cell ... ... 54
3.5.2 Finalizing the Design Phase ... 56
4. Cell Implem entation Phase ... 57
4.1 Im plem entation ... ... 57
4.2 Accelerated Improvement Workshop at Machining Center ... .... 59
4.2.1 Cell Layout...60
4.2.2 Set-Up Reduction ... ... ... 61
4.2.3 Inspection and Variability Reduction...62
4.2.4 Scheduling...62
4.2.5 Total Productive M aintenance ... 63
4.3 Perform ance M easurem ent ... ... 63
4.3.1 Performance M easurement of the M achining Center Cell ... ... 64
5. Conclusions ... ... 67
References 69
Appendix A 71
List of Figures
Figure 1.1 M achining Center Layout... ... 15
Figure 1.2 Typical Part Process Flow ... ... 16
Figure 1.3 Current Work Breakdown by Customer in the Machining Center as Percentages of Factory D irect Labor H ours ... ... 17
Figure 1.4 Boeing Defense and Space Business Process Flow... ... 19
Figure 2.1 The Product-Process Matrix ... ... 27
Figure 2.2 Effect of Repeating the PDCA and CAPD Cycles ... ... 33
Figure 2.3 Cell Design and Implementation Process ... ... 34
Figure 3.1 Part Family definition process in the Machining Center...49
Figure 3.2 Primary Routing Sequences of Candidate Cell Part Family ... 52
Figure 3.3 C ell Process ... ... 52
Figure 4.1 C ell L ayout ... 61
Figure 4.2 Average Variance to Standard for all Cell Machines for First Quarter of Operation..66
List of Tables
Table 1.1 Boeing Defense and Space Manufacturing Initiatives ... 13Table 1.2 Standard and Puget Sound Flow Times for a Fictitious Part... 22
Table 2.1 The PDCA and CAPD Cycles ... 32
Table 3.1 Current Situation at Shop using a Sample of Commercial Parts ... 39
Table 3.2 Current Situation at Shop through its Own Metrics ... ... 39
Table 3.3 Suggested Part Data for Cell Design Database...44
Table 3.4 Work Type Code Field Specifications ... ... 49
Table 3.5 Result of Part Family Definition First Iteration... 51
Table 3.6 Initial Required Capacity and Machine Availability Calculations ... 54
1. Introduction
The environment in which Boeing's Defense and Space Group operates today is very different from the one in which it has historically succeeded. The decline in defense spending has increased the importance of cost or affordability in a decision process which previously emphasized the incorporation of state-of-the-art technology into new military products. In addition, the defense industry consolidation is producing fewer companies competing fiercely for a piece of a decreasing pie. Therefore, Boeing's Defense and Space Group (D&SG) success depends on its ability to exceed customers' expectations through superior performance, by delivering high quality products in a timely manner, with shorter lead-times and lower costs.
This thesis explores whether or not cellular manufacturing can help D&SG's Machining Center, a highly flexible shop with many different customers and products, achieve improved
performance and customer satisfaction.
The remainder of Chapter 1 discusses in more detail D&SG's business and manufacturing strategy, and it describes the Machining Center's customers, business process and current situation. The goal of the thesis is explained in more detail at the end of the chapter. Chapter 2 summarizes the advantages and disadvantages of functional layouts and cellular manufacturing. It then explains why cellular manufacturing might benefit the Machining Center and its
customers. The chapter concludes with the five-step cell design process used to introduce cellular manufacturing in the Center. Chapter 3 describes the first three steps in this cell design process, corresponding to the planning phase. The analysis to determine the part families, cell process and machines is presented, as well as the methods used to ensure cell performance.
Chapter 4 discusses the implementation, immediate results and longer term expectations of the
1.1 Linking Boeing's Defense and Space Group Business and Manufacturing Strategies
Boeing's Defense and Space Group has been one of the lead suppliers to the Department of Defense and NASA. From the Minuteman missile to the Lunar Rover Vehicle, and more recently the F-22 Fighter and NASA's Space Station, D&SG has a solid and distinguished
history of innovation and technological edge in designing and building advanced products for the military and space program.' Even though most of D&SG traditional customers are cutting back on spending, they continue to have real needs requiring the technical excellence that Boeing can supply. In addition, there is an ongoing commercialization of many of the technologies that historically have been pursued only by government concerns. For example, the opportunities in space ventures are increasingly of a commercial nature given the growth in the
telecommunications industry. However, success not only depends on Boeing's superior technical expertise, but also in its ability to remain customer focused and competitive. This is why one of the thrusts of D&SG's business strategy is to become a preferred supplier for the Boeing Commercial Airplane Group (BCAG). Support to BCAG is expected to help D&SG improve competitiveness in its traditional and potential markets, as the same capabilities in the existing product/service categories overlap between the military and commercial customers.
The D&SG Manufacturing mission statement incorporates the strategic intent of the group as a
whole: To be the supplier of choice to military and commercial customers in terms ofquality,
profitability, and growth as measured by customer, employee and community satisfaction.2 To
that end, Manufacturing's strategy focuses on customer satisfaction, growth and best practices. Using best practices, Manufacturing can provide superior customer satisfaction at lower costs, producing increased business from its existing customers and attracting new customers. An interesting manifestation of this strategy is the way in which major functions and manufacturing centers interact. While BCAG has created manufacturing business units at each of its
manufacturing centers by having functions report to the management of the business unit, D&SG has maintained functions, operating at a Division level, and supporting the manufacturing centers
Serling, R.J., Legend and Legacy The Story ofBoeing and Its People, 1992, St. Martin's Press, New York.
through representatives. By doing so, D&SG has created a matrix approach with the intent of not only holding on to functional knowledge, but also eliminating the additional costs of duplicating responsibilities or management within each manufacturing center.
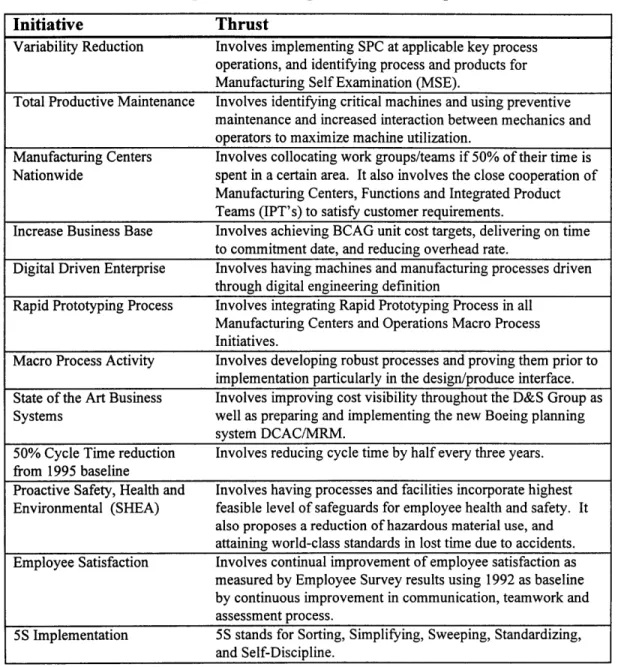
Table 1.1 Boeing Defense and Space Manufacturing Initiatives
Initiative Thrust
Variability Reduction Involves implementing SPC at applicable key process operations, and identifying process and products for Manufacturing Self Examination (MSE).
Total Productive Maintenance Involves identifying critical machines and using preventive maintenance and increased interaction between mechanics and operators to maximize machine utilization.
Manufacturing Centers Involves collocating work groups/teams if 50% of their time is Nationwide spent in a certain area. It also involves the close cooperation of
Manufacturing Centers, Functions and Integrated Product Teams (IPT's) to satisfy customer requirements.
Increase Business Base Involves achieving BCAG unit cost targets, delivering on time to commitment date, and reducing overhead rate.
Digital Driven Enterprise Involves having machines and manufacturing processes driven through digital engineering definition
Rapid Prototyping Process Involves integrating Rapid Prototyping Process in all Manufacturing Centers and Operations Macro Process Initiatives.
Macro Process Activity Involves developing robust processes and proving them prior to implementation particularly in the design/produce interface. State of the Art Business Involves improving cost visibility throughout the D&S Group as
Systems well as preparing and implementing the new Boeing planning system DCAC/MRM.
50% Cycle Time reduction Involves reducing cycle time by half every three years. from 1995 baseline
Proactive Safety, Health and Involves having processes and facilities incorporate highest Environmental (SHEA) feasible level of safeguards for employee health and safety. It
also proposes a reduction of hazardous material use, and attaining world-class standards in lost time due to accidents. Employee Satisfaction Involves continual improvement of employee satisfaction as
measured by Employee Survey results using 1992 as baseline by continuous improvement in communication, teamwork and assessment process.
5S Implementation 5S stands for Sorting, Simplifying, Sweeping, Standardizing, and Self-Discipline.
D&SG has launched many initiatives across all of its manufacturing centers. Table 1.1 offers a
summary of these initiatives and their thrust, which articulate the goals or measurable elements defined as critical to become the dominant world-class supplier in the aerospace industry. All of them represent important steps needed to bring about improvements in Manufacturing.
However, it is worth pointing out that sustaining focus and dedication to each initiative may be very difficult as their number increases. There may be a danger of diluting employee attention by separating efforts without prioritizing them. While all of the initiatives are important, some have a more immediate operational focus, and others a more strategic nature. Given the company's finite financial and manpower resources, establishing time horizons, as well as identifying synergy's between initiatives could prove very useful. By doing so, projects that
advance the goals of several initiatives would be more easily identified and diligently pursued.
1.2 Background on the Machining Center
The Machining Center is one of the five D&SG Manufacturing Centers located in the Puget Sound area. It produces structural details and/or assemblies for military and commercial customers. A layout of the Machining Center is presented in Figure 1.1.
Machines are grouped by function, which provides the shop a great deal of flexibility. There are
50 numerically controlled (NC) machines with 3, 4 and 5 axis capabilities. There are also
manually operated mills, drills, lathes, as well as precision machines and deburring stations.
Presently, the shop runs a 5 days/3 shifts operation, fully manned on first shift with manpower
decreasing approximately by half in each consecutive shift. All the personnel involved in actual production reports through supervisors to the Center Leader. The functions supporting
production such as Inventory Management, Manufacturing, Industrial, and Process Engineering have representatives in the shop but report to their respective functional managers.
4 Hor. Mills, 3 Axis, 1 Spi ndl eEach Dispatch Cffice Staging Racks Incoming and Vendor Gif load Cfice Convent i onal Mills Area Gfice Preci sion Machi ni ng Ares Convent ional Drills Area Convent ional M/ills Area
Figure 1.1 Machining Center Layout
Small Parts
The process flow for a typical part is presented in Figure 1.2. As shown, after the machining operations and the first QA step, which verifies the accuracy of the machining, parts go through a Chemical Processing step. This step occurs in another D&SG manufacturing center, albeit adjacent to the Machining Center. As a different center, the Chemical Process Line has its own management and dedicated support personnel. Approximately 70% of the parts return to the Machining Center or go to another manufacturing center after Chemical Processing for further precision machining and/or subassembly work before completion. Therefore, at least two centers are involved in the production of a finished product.
Figure 1.2 Typical Part Process Flow
The Center processes between 350 to 400 orders a week. The shop floor control program does not make a distinction between new orders, i.e. orders that are just starting the manufacturing process as raw material, and orders that have been in the pipeline for some time and return to the Machining Center for further processing. It only acknowledges orders "clocked" to one of the areas in the Center. Therefore, of the total orders processed weekly, approximately 75% are new
orders; the rest are orders that return to the Machining Center after Chemical Process or another Center or supplier for further machining or subassembly. The average backlog is five weeks worth of work, i.e. between 1400 and 1600 orders.
1.2.1 Customers
The Machining Center supports two main customers: military and commercial programs. Figure 1.3 presents the current breakdown of the work in the Machining Center by customer as
percentages of the total direct labor hours. These two major customers are quite different in nature, and the differences are explained below.
Figure 1.3 Current Work Breakdown by Customer in the Machining Center as Percentages of Factory Direct Labor Hours
Military programs have a finite life cycle. After the engineering design phase, one or more prototypes are built before the approval for final production is obtained. The prototype stage is generally very labor intensive, as the Center's work force is learning how to make highly precise and complicated parts. The F-22 program, now at the end of the prototyping stage, is a case in point. First, the Center's machinist and operators had to learn how to precision machine complicated titanium parts. In the past, most of the machining had been done in steel or
aluminum, and titanium has different properties making it a difficult material to machine. Next, the Center's work force was faced with working through many engineering design changes. Although necessary, these changes are very time consuming. Before making a final prototype part on the desired material, the machinists run trials on less expensive material to show that the numerically controlled machines are rendering the correct part geometry. This is an iterative process, often requiring several trials before producing the desired part. When design changes
are introduced, the try-out process begins all over again. Thus for complex parts requiring long machining times the prove-out process is very resource and time intensive. Once the production stage begins, the Center is contracted to spend several years producing parts for a military
program, yet the production could still be characterized as low to medium volume . When all the
contract units are completed, no more parts are manufactured. It is worth noting that at any given time, the Machining Center is generally dealing with several military programs at different points in their life cycle. When a large program like the F-22 is in its prototype stage, the work load at the Center is very high during this period, as a result of the learning curve effect and the number of design changes required. Since there are parts for other customers in production at the same time, the learning and design change activities affect the capacity of the Center
significantly, and therefore its ability to serve all of its customers.
According to Figure 1.3, almost half of the work at the Machining Center is performed for commercial customers, i.e. the 737 through 777 programs. The majority of these parts are made out of aluminum and have been in production for many years. Currently, commercial customers place orders for parts up to two years in advance. Since the production of commercial planes is continuous and at a known rate, there is little uncertainty in the demand. In the future, with the introduction of DCAC/MRM, Boeing's new resource planning system, orders may not be known as far in advance and shorter lead-times may be required, but BCAG will continue to issue medium to long term contracts with suppliers, which still reduces uncertainty from forecasting and planning at the supplier level.
However, the Center is also expected to produce parts for AOG's (Airplane On Ground) and replenishment spares. Boeing's service policy is to deliver parts for its planes as soon as a customer, generally an airline, reports a grounded plane. When this happens, the needed part is generally expedited through the shop, causing some disruption in production. The Machining Center also supports some emergent production for commercial customers. Emergent work refers to work that is generally done by BCAG's fabrication division or BCAG suppliers, but due to lack of capacity or some other reason, it cannot be performed by them in a timely fashion. This work comes into the Machining Center on a one time basis. By accepting emergent work, the Center supports its commercial customers by providing capacity and expertise to manufacture parts. Emergent work causes uncertainty in the production schedule, but it is accepted in spite of this fact, as the Center traditionally has valued supporting its commercial customer. To a certain
extent, the Center also expects that BCAG will return the favor during "slow" times by providing the shop with emergent or long term work to efficiently utilize available capacity.
1.2.2 Business Process Flow
Figure 1.4 illustrates a simplified business process flow for Boeing's D&SG. This flow is composed of five major steps, which are described below, and it applies to both military and commercial customers. The process is controlled at the Group level, and supported by a myriad of computer applications, some of which have been in use for many years.
Receiving, Procurement and Stores and Requirements Requirement s Requirement s Manufact uring Cont ract
Authorization Development Planning Order Release Completion
I --- --- T --- --- --- I
II I I I I
Figure 1.4 Boeing Defense and Space Business Process Flow
During the first step, Requirements Authorization, the scope and schedule of the work is defined by the customer, and by Boeing's Program Office and Engineering. Engineering is completed during this stage, and an account to pay for all the work concerning the contract is established. Next, in the Requirements Development step, the part plans specifying where and how the parts are to be built are completed by the planners, and the date in which the part is needed is
determined. The D&SG shop or supplier involved in the manufacturing of the part is chosen and specified in the part plan. In the case of machined parts, NC programming is also completed at this stage. The Inventory Management Organization marries the schedule requirement with the
part plan in the MP&R (Material Planning and Release) system to create an order. In the third step, Requirements Planning, the orders are basically in a holding tank prior to release. At this time any discrepancies or problems with the order are reviewed. In addition, the MP&R system checks for availability of raw material and/or purchased parts and notifies materiel of needs, so that they are procured prior to order release.
In the Procurement and Manufacturing Order Release stage, orders are released in the MP&R system six days before the order is due at the first step of its manufacturing process as prescribed by the plan to ensure that the engineering drawings and manufacturing plans are ready on the order start day. For example, if the order flow time is 40 days, the order will be released 46 days prior to its due date. Flow times are explained in more detail in the next section. This allows for all the paperwork associated with an order to be created and ready in a timely manner. In the case of purchased parts the same process is followed, and the supplier lead time is used. The final step involves Receiving, Stores and Contract Completion. Once the orders are completed, they are sent to D&SG stores from where they are shipped to the customers. Stores performs a final inspection and completes the paper work to invoice the customer.
1.2.3 Capacity Planning Systems
It is important to understand the underlying assumptions driving D&SG capacity decisions. The MP&R system currently being used has no capacity planning capability; it assumes that capacity is infinite. Since this is not the case, capacity charts are developed to avoid accepting work in excess of the capacity of the shop, and Puget Sound Flows are used to plan this work. Puget Sound Flows are basically planned lead times; the concept is explained in more detail later in this section. In other words, there are methods in place to accommodate long and short term capacity planning decisions.
The shop load committee, whose members are primarily industrial and manufacturing engineers directed by the Center's business manager, determines the amount of work in hours awaiting each Factory Work Code (one or one group of machines with similar capabilities) in the shop
twice a year by a manual process based on the master schedule, known orders, shop
commitments and expected work. For each Factory Work Code (FWC) the shop load committee
charts the known/expected work (in hours) against the capacity curves of the FWC according to 5
working days and 1-3 shifts (in hours) versus time. Each operation has a standard allowed time at a given Factory Work Code. This standard is considered to be the amount of time necessary to complete a task in a perfect world, i.e. all tools and materials available, no mistakes, no machine breakdowns, etc. However, all the Factory Work Codes have a variance to standard, which based on historical data represents the ratio between actual time spent to complete the operation and standard time allowed by the manufacturing plans. Thus in order to calculate correctly the amount of known and expected work for the capacity charts, the standard allowed times must be multiplied by the machine variances to obtain realistic estimates.
These capacity charts generally cover a 5 year time horizon and are used by the shop load
committee to determine how much work can be accepted or rejected, and whether or not to look for work for the shop. Notice that the business manager for the shop must look for work to fit the Factory Work Codes that are not working at capacity. For example, if a Factory Work Code that groups 4 axis machines is being under utilized, the business manager will try to obtain work to fill those machines to capacity. Since the numerically driven machines are the most expensive assets in the shop, it is considered imperative that their idle time, i.e. down time for lack of work, is minimized. Although the shop load committee tries to reflect as accurately as possible all the information concerning future work in these charts, this process is only a snapshot, i.e. it cannot reflect changes as they become known until the next capacity planning exercise is performed.
The Puget Sound Flows are used to create a window of time to produce the part by the desired delivery date. Each FWC has an associated Puget Sound Flow time, i.e. a planned lead time. The Puget Sound Flow time is the maximum expected amount of time that will take for a part to await and complete processing at a given FWC. Puget Sound Flow times for FWC's have been used for over two decades, and a Boeing issued document assigns a flow time to every FWC in the company. Thus total Puget Sound Flow time for a part is the sum of all the individual flow times at each of the FWC's called for in the manufacturing plan. The following table illustrates
this explanation by listing the steps required to complete fictitious part, and the time allowances according to standards and Puget Sound flows.
The ratio between actual machining time and Puget Sound Flow time, if we allow a variance to standard of 2 for each of the FWC's associated with the manufacturing step, is approximately 1%. This means that of the 40 days that the part spends in the shop, 99% of the time the part will be in queue waiting to be processed, and only during 1% of the time there is actual value added to the part. In general, the simpler parts which require shorter machining times exhibit ratios
between 1 and 3%, for the more complex ratios are in the 5 to 7% range. As an average, a ratio
of 5% is used when estimating the queuing vs. machining time ratio.
Table 1.2 Standard and Puget Sound Flow Times for a Fictitious Part
Manufacturing Step Puget Sound Standard Set-Up Standard Run
Flow Time Time
3 Axis Machining 9 days 44 minutes 30 minutes
Manual Saw 2 days 10 minutes 4 minutes
Manual Drill 2 days 39 minutes 9 minutes
5 Axis Machining 10 days 40 minutes 33 minutes
Manual Deburr and Blending 2 days 14 minutes 40 minutes
QA Inspection 5 days N/A N/A
Total 40 days 147 minutes 116 minutes
The shop floor control program used in the Machining Center has no look-ahead ability. Therefore, only orders that are received by the Center and clocked to one of its Factory Work Codes are seen by the Industrial Engineers, who make daily production plans. There are five Industrial Engineers who plan the work throughout the Center and each is responsible for a group of Factory Work Codes. By using the shop floor control data to plan the work, there is no
visibility of incoming orders. Being aware of incoming orders could be useful in planning production and ensuring that orders are not ignored if for some reason, such as lack of raw
1.2.4 Metrics
The main performance categories across The Boeing Company are quality, cost, delivery, safety and morale. The Machining Center uses the categories as well; however it is necessary to understand how they are measured and their relative priority.
Delivery is the driving metric at the shop. A great deal of emphasis is placed on delivering the parts as per customer schedule. To this end, an expediting group within the Inventory
Management Group produces lists of orders to be delivered within 15 manufacturing days for military customers or 10 manufacturing days for commercial customers. (A manufacturing day is a regular business work day excluding weekends and holidays.) The status on the 10 or 15 days to Load Lists is reviewed every morning at a meeting attended by Production and Industrial Engineering personnel who, along with the expediters, work to get the parts out before a
Thursday midnight imposed deadline. In other words, every Thursday night at midnight, there is a count by program/customer of how many orders have not been delivered that day as per schedule. This number is known as the Thursday counters; it is tracked to show the weekly delivery performance of the Center. The acceptable number of counters is less or equal to 2 late orders per customer per week.
Since there is such an emphasis in delivery, there are several schedule metrics that are also measured. For instance, there are weekly charts indicating the number of orders that have
exceeded their Puget Sound flow at each Factory Work Code. This is generally taken as a way to determine how "backed-up" are some areas in the shop. Statistics are also kept on orders that are released late to the shop for lack of material, engineering drawings or NC programming by customer.
Quality is assumed to be excellent, since every part goes through many inspection stages before being shipped. The cost of quality is measured by Scrap, Rework and Repair (SRR) in dollars. SRR costs are calculated as follows. Scrap cost includes cost of material plus value added before scrapping. For example, if the material is worth $20 and 3 direct labor hours have been invested in the part up to the point that it is scrapped, the cost is $80. Repair and rework costs are
calculated by multiplying the additional direct labor hours needed to repair or rework the part by the hourly manufacturing rate. For instance, if 3 additional hours are spent repairing or
reworking a part, and the manufacturing rate is $20/hour, the cost of the repair is $60. Note that the impact on delivery and customer satisfaction is not quantified, and that the cost of inspectors and the Quality Assurance Department falls under overhead costs.
Most other costs, like the cost of machine breakdown prevention and facilities support is measured in terms of man hours or variances to standard. For example, the Center keeps statistics on the variance to standard for each Factory Work Code, as a way to gauge the productivity and reliability of a machine group. Average man hours per part for each order is available, and can be used to calculate how much a customer "paid" for each part by multiplying this average by the Center's manufacturing rate.
1.2.5 Current Situation
In the summer of 1996, the Machining Center was experiencing difficulties with delivering on schedule. The F-22 contract contributed in part to this problem because of the many engineering changes that were submitted. In addition, the Master schedule for that program changed, but the new load dates were not updated in the MP&R system. Therefore, the statistics which were based on MP&R data, reflected many late orders that in fact were not late. Further, delivery performance for commercial customers was deteriorating. This increased the quantity of orders reflected in the 10 day to load lists. These lists were being used more and more to plan daily production; in other words, hot jobs were prioritized. Most of the focus and energy were being spent in the 10 manufacturing days prior to delivering parts. To alleviate the load in the Center, work was off-loaded to other suppliers. Hence, the Center is producing less and therefore earning less than expected. At a time when growth of the customer base is increasingly
important, the Center was actually having to turn away work that it had committed to do in the past, as well as potential customers. Thus, there was a sense of urgency about taking steps to correct this situation.
1.3 Goal of Project
This project has dual purposes: learning and improvement. The situation of the Machining Center in the fall of 1996 called for action towards improvement. Any avenue leading toward increasing throughput, lowering costs and improving delivery was welcome. Cellular
manufacturing was seen not only as a way to increase the efficiency of the Center, but also as a potential new way to "do business." However, before considering cellular manufacturing for the Machining Center, it was necessary to answer several questions: are the desired conditions for justifying cellular manufacturing present? What would be the performance requirements of a cell in the Center? How could cellular manufacturing be implemented successfully? The rest of this thesis aims to answer these questions in detail.
2. Assessment of Cellular Manufacturing
Understanding the nature of the product life cycle is very useful in determining the appropriate
production strategy.3 This chapter discusses this concept in greater length by introducing the
product-process matrix. Then, it discusses the benefits and limitations of the different processes structures, making it easier to appreciate the advantages of cellular manufacturing and the situations in which its implementation is desirable. Next, it explains the reasons that justified pursuing the design and implementation of a manufacturing cell in the Machining Center. Finally, the process used to introduce the cell is outlined.
2.1 Product-Process Matrix
The product-process matrix links the product and process life-cycles with the intent of providing a means to assess whether or not a firm has properly matched its production process to the product structure. As shown in Figure 2.1, the matrix suggests that as the sales volume of the product increases, the process flow should become more continuous. This is what one would
expect, as when volumes grow, automation may be introduced and lines may be dedicated to the product. Since traditionally the aerospace industry has considered itself a low-volume producer, until recently the majority of its operations had opted for a flexible process layout, to permit them to handle small quantities of a large variety of products. As a result, machines are grouped by function to minimize machine idle time and maximize machine utilization in what is often
called a job shop layout.4
It is useful to consider the Machining Center products in the context of the product-process matrix. The Center builds parts for several military programs that may be at different stages of their product life cycle. It also builds parts for commercial programs most of which are in the mature phase of their product life cycle. Yet, the production process is the same for all
programs, i.e. there is no process structure differentiation depending on the process life cycle of
3Nahmias, S., Production and Operation Analysis, 1983, Richard D. Irwin, Inc., Boston, MA.
4 Dul, P.W., Application of Cellular Manufacturing to Low-volume Industries, 1994, MIT-LFM Master Thesis.
the product or part, and its relative volume to other parts built in the factory. In the next section, the benefits and disadvantages of each of the process stages are explained in more detail. This discussion highlights the reasons why choosing just one process structure limits the Machining Center's ability to decrease cost and lead-times. It also emphasizes the benefits of a more product driven layout, and how it can increase the efficiency of a factory when applied under the right conditions.
Figure 2.1 The Product-Process Matrix'
2.2 Functional and Product Flow Layouts: Benefits and Limitations
The jumbled flow and disconnected line flow of the product-process matrix correspond to what is often known as a functional layout or job shop. In a functional layout equipment with the same
5 Hayes, R.H and Wheelwright, S. C., Link Manufacturing Process and Product Life Cycle, 1979, Harvard Business
Review, January-February.
II III IV
High volume, high Low Volume, low Few major standardization, Process Structure standardization, Multiple Products, products, commodity Process life-cycle stage one of a kind Low Volume higher volume products
Jumbled flow Commercial Void
(job shop) printer
II
Disconnected line Heavy
flow (batch) equipment
Ill
Connected line Auto
flow (assembly line) assembly
IV
Continuous flow Void Sugar
function is located together, providing a great deal of flexibility; therefore a wide variety of products can be manufactured at a low volume. It also allows for easier training of workers as
they have the opportunity to learn from each other when they are collocated.
However, the functional layout has several disadvantages. For example, as the number of products and machine types increase, scheduling complexity increases substantially. Since the products travel a lot around the factory, lead-times are higher and it becomes difficult to track
down the work-in-progress (WIP). Also, batching products before they move to the next step in the process increases WIP and hides quality problems. Thus defects are found late in the process
and are generally costlier to correct, as there is already a large number of products in the pipeline
that have to be reworked or scrapped.6 Since maximizing machine utilization is an important
metric in this environment, larger batch sizes are preferable to minimize change-over and set-up costs. This incentive of increasing machine utilization causes an increase in inventory costs, in terms of both work-in-progress and finished goods and perpetuates long lead times and
decreasing throughput. Goldratt in his book The Goal7, has warned managers from using
machine utilization as a driving metric, but in a functional layout it is hard to resist this temptation and succumb to large inefficiencies for the sake of keeping all the machines busy.
Product-flow layouts correspond to the connected line flow in the product process matrix. These layouts are used when the product volumes are large enough to justify a dedicated line to support a sequence of operations, i.e. machines located according to the line of flow of the product. The main advantages of this layout are the reduction of WIP as batching is eliminated, and no WIP is accumulated between process steps. Since waiting times are reduced considerably, cycle times decrease and throughput is higher.
One of the main disadvantages of the product-flow layouts is lack of flexibility, as only one or a very small number of products may be manufactured in one line, and accommodating product
6 Arnold, D. H., Husman, M. S., and Guo, Y., Cellular Manufacturing in Contract Manufacturing Area, 1996,
Manuscript.
7 Goldratt, E. and Cox, J., The Goal, 1984, North River Press, Croton-on-Hudson, New York. 28
changes or new products can be difficult and costly. Product-flow layouts also require high initial capital investment to purchase dedicated manufacturing and handling equipment which are connected "in series." However, when one of the pieces of equipment breaks it can cause the whole line to stop, or at least considerable disruptions in production.
2.3 Cellular Manufacturing: Benefits and Limitations
Cellular Manufacturing offers an opportunity to combine the efficiency of product flow layouts with the flexibility of functional layouts. In cellular manufacturing, products with similar process requirements are placed into families and manufactured in a cell consisting of
functionally dissimilar machines dedicated to the production of one or more part families.8 By
grouping similar products into families, the volume increases justifying the dedication of equipment. But since this volume is justified by process and product similarity, cellular
manufacturing warrants much more flexibility than a pure product-flow layout. In terms of the Product-Process matrix, cellular manufacturing allows movement down the vertical axis, i.e. it allows increasing the continuity of the manufacturing process flow without demanding that the products be made in large volumes.
The benefits of cellular manufacturing include faster throughput times, improved product quality,
lower work-in-process (WIP) levels and reduced set-up times.9 These gains are achieved because
the batch sizes can be significantly reduced. As set-up times decrease through the use common tools or the collaboration of cell workers during set-up times, batch size can be reduced. The shorter the set-up time the smaller the batch size, and as a goal a batch size of one is feasible when set-up time is zero. Within a cell, small batch sizes do not travel very far as machines are collocated, resulting in less work-in-progress, shorter lead times and much less complexity in production scheduling and shop floor control.
8 Shafer, S.M. and Charnes, J.M., A simulation analyses offactors influencing loading practices in cellular
manufacturing, 1995, International Journal of Production Research, Vol. 33, No. 1, 279-290.
9 Wemmerlov, U. and Hyer, N. L., Cellular Manufacturing in the US industry: a survey of users, 1989, International Journal of Production Research, 27, 1511-1530.
Unfortunately, in a cellular layout as in the product-flow layout, a machine break down may still cause a work stoppage in the cell. Another limitation of this approach is that to ensure cell profitability and low unit costs, a large enough volume of products must be processed within the cell so that capital expense of buying the dedicated equipment to each product is low. Managers who disregard this fact when pursuing the improvements that cellular manufacturing promises, may end up with less benefits than expected.
2.4 Is There a Match?
The functional layout is effective when extreme flexibility is required in a factory to manufacture one-of-a-kind or very low product volumes, and there is no certainty in the nature of the demand. However, applying this approach in low-volume, semi-repetitive environments has been the accepted way to do business, and it has burdened companies with its large inefficiencies. In today's competitive environment, using a cell manufacturing approach can help factories like the Machining Center to shed costs, reduce lead-times and increase throughput while maintaining production flexibility to satisfy different customers.
Using a computer simulation, Morris and Tersine'o identified the 'ideal' environment for cellular
manufacturing as one where:
1. there is a high ratio of set-up to processing time, 2. demand is stable,
3. the work has unidirectional flow, and
4. there is significant time delay in moving parts between departments.
This criteria certainly justifies the introduction of cellular manufacturing at the Machining Center. First, military and commercial parts have similar characteristics in that they both exhibit a set-up to processing time ratio of 1 to 3. Second, given the current layout of the shop and the scheduling system, there are significant time delays in moving the parts around the shop. Third,
'o Morris, J.S. and Tersine R. J., A simulation analysis offactors influencing the attractiveness ofgroup technology
both types of parts have, in the vast majority of cases, unidirectional work flow, particularly during the part definition stage, i.e. prior to the Chemical Process step.
The main difference between parts from military and commercial programs is the nature of the demand. As explained earlier, the current military programs in the Center are either at the beginning or end or their life cycles. The F-22 program is at the end of the prototyping stage and start of the production ramp-up stage is still uncertain, while the B2 program, for which the Center built a large number of components, is at the end of its life. On the other hand, demand for parts from commercial customers is stable and well known ahead of time. Given these circumstances, cellular manufacturing can be best implemented right away in the production of commercial parts, where the Machining Center faces competition from outside suppliers and it must satisfy stringent cost and delivery customer requirements. Cellular manufacturing can also be applied in the production of military parts, once the military programs enter the production phase.
2.5 Cell Design and Implementation Process
Since the goal of the internship was improvement and learning, it was important that the method used to design and implement the cell would satisfy both of these objectives. In the book A New
American TQM"1, Shiba et al. refer to two different ways to effect improvement within an
organization while incorporating learning: the PDCA cycle (Plan-Do-Check-Act) and the CAPD cycle. The authors explain that the PDCA cycle is most useful in continuous improvement, where the process is already existing and the PDCA cycle is run over and over again to eliminate the next most important problem, and thus further reduce the variance of the process and its
results. The CAPD cycle on the other hand, is more applicable to planning situations where the target for the next planning cycle is different from the target for the previous one. The letters are transposed to emphasize the control and feedback aspects of the loop and to focus attention on
" Shiba, S., Graham A. and Walden, D., A New American TQM, Four Practical Revolutions in Management, 1993,
their importance in the planning of the improvement process. Table 2.1 enumerates the steps of the two different cycles and Figure 2.2 shows the effect of applying and repeating them.
Table 2.1 The PDCA and CAPD Cycles
It is worth noting that regardless of what type of cycle is used to drive improvement, there is great challenge in "picking the problem to solve." Since solutions are rooted on what problems are presented and how, "picking the problem that is most responsible for the variation in results" or "discovering how the process prevents achievement of desired results" are often difficult steps in the continuous improvement process because "the problem" is seldom obvious.
Nevertheless, in a fundamental way "picking the problem" determines the direction, quality and effectiveness of the improvement.
According to Table 2.1 and Figure 2.2, the CAPD cycle was the model used to develop the cell design and implementation process. The CAPD cycle lends itself to achieve more radical changes as it actually calls for looking at the big picture and reassessing the goals and processes used to obtain them. In addition, by following the CAPD model, there is room for rectifying the process and establishing new targets, rather than just refining them. Again, one important feature of both cycles is that they both used feedback to move forward. This is a necessary feature of
The PDCA Cycle
P Pick the problem that is most responsible for the variation in results, analyze the root
causes of the problem, and plan counter measures to fix the root causes.
D Do the improvement.
C Check that the improvement was effective.
A Standardize it as appropriate, and go to the next improvement.
The CAPD Cycle
CA Discover what is wrong with the previous process that prevents achievement of the
desired results; what are the key things to improve for the next cycle.
P Determine what is desired for the future (e.g. what is the next target).
D Carry out the plan for the year.
any process seeking improvement, and it was purposefully included in the cell development process.
Figure 2.2 Effect of Repeating the PDCA and CAPD Cycles
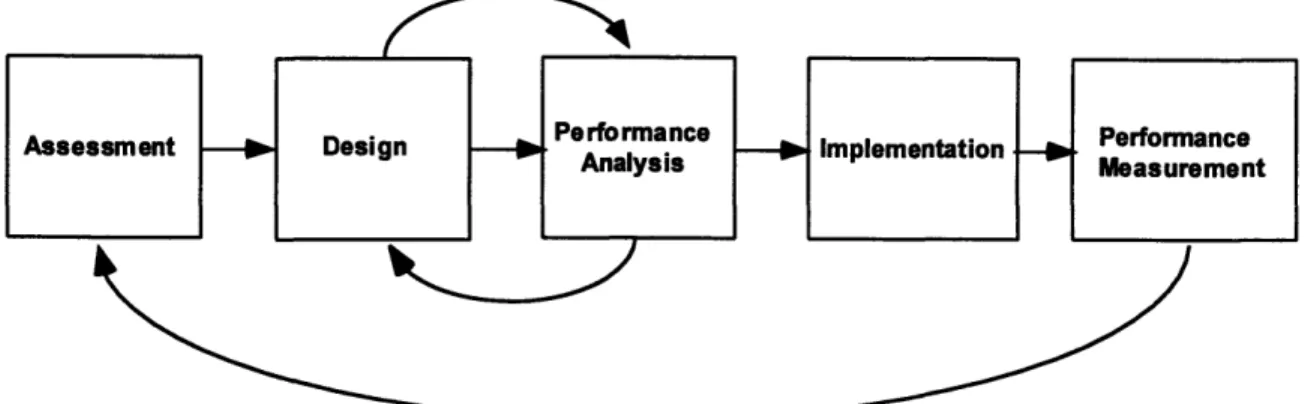
Figure 2.3 presents the cell design and implementation process proposed as a method to
introduce cell manufacturing in an environment where previously a job shop (functional) layout was used. This process allows for discovering reasons for not achieving desired results and key areas for improvement during the assessment stage (CA step). Next, what is desired for the future can be determined in the Design and Performance Analysis steps (P step). Carrying out the plan involves implementation of the design and monitoring of the results throughout a period
of time to finally (D step) check whether or not the target was achieved, and restart the CA step.
The main tasks of each of each step of the process is briefly explained below. The remainder of the thesis, discusses in more detail the issues concerning the actual doing of the steps, the
U
( U O TargetPDCA1 PDCA2 PDCA3
CAPD
1
challenges in taking them, and summarizes the experiences from the Machining Center in following this process.
Figure 2.3 Cell Design and Implementation Process
In the Assessment stage it is very important to obtain an in-depth understanding of current process and metrics. This assessment should be thorough in covering the different aspects that affect the process, including but not limited to personnel alignment and incentives,
manufacturing process, driving metrics, etc. By doing so a baseline can be established which clearly defines "where we are today" and thus facilitates defining "where we want to be
tomorrow" and how to get there. In this way, identifying the cell requirements and expectations is a more rational and realistic exercise.
The Design step requires that information and feedback are solicited from all the functions and or individuals that are part of the process. In addition, it requires that effective methods are used to derive part families and their process. Sometimes an expert is very helpful during this stage of the process to guide the group wisely in determining and demonstrating the attributes of a
successful design before a big investment is made in implementing it. During this step, care should be taken to balance the need to minimize the costs of introducing the new cell process in the production environment with the need for using the most effective processes or equipment to do the job. If this balance is not established, the changes proposed may be too small to achieve the desired results or too big to obtain the results at a justifiable cost.
The success of cellular manufacturing is heavily dependent on correct capacity planning to ensure that dedicating the equipment is justified and feasible, and that the work is balanced, so that the cell can perform as expected. The Performance Analysis step is a necessary one to check the assumptions and proposals of the design step and to finalize the performance measurements of the cell. Figure 2.3 highlights the iterative relationship between the Design and the
Performance Analysis steps.
The Implementation step requires mobilizing the people that "do the work" to implement the changes. Many companies that have tried to implement continuous improvement programs have their own recipe for "kaizen events" that lend themselves to mobilizing people and resources to make changes. The author suggests that these kinds of activities that are already in place may offer the vehicle to mobilize the resources. Whereas the previous steps required support from management, the Implementation step requires commitment from management, as
implementation requires having those involved in the process take time from production to participate in changing the process. Therefore, there are costs attached to the training and mobilization of employees as well as costs for not producing during that time. Preparation, identification of key players and clear goals will go a long way to ensure the success of the implementation.
Finally, the Performance Measurement step is an ongoing process, where performance
measurements are monitored to determine the impact of the change in achieving the expected goals. This step is very important because it establishes the feedback loop needed to identify areas of success and areas where requirements need to be readdressed. In doing so, the CAPD cycle is restarted and continuous improvement is perpetuated.
3. Cell Planning Phase
The successful implementation of cellular manufacturing in an already established production shop depends on thorough planning, involvement of employees and management, and their staunch commitment to the change. The first three steps of the design and implementation process are included in this phase: assessment, design and performance analysis. By following these steps, accurate data on the current situation is gathered and used to establish a baseline, to identify the benefits from cellular manufacturing, and to obtain the support of management and employees. Then, key personnel are involved in the cell design to determine the scope, process, expectations, i.e. main manufacturing process of the cell, part families to be processed inside the cell, allocation of human and capital resources, and performance goals. The performance
analysis is closely linked to the design in that it is used to refine the design and clarify its scope and expectations. There is an implied iterative process during the performance analysis,
necessary to ensure that the desired outcome is feasible. The cell planning phase involves the CAP part of the CAPD cycle. The main goal of this phase is to understand reality and to create a plan which will support transitioning and sustaining the cell.
3.1 Assessment
In the assessment stage, the primary goal is to gather accurate data on lead-times, costs, quality, and other important metrics to obtain a true picture of the way in which the production
environment functions. Then using analysis this data is converted into information which in turn is used to support the decision of moving on to the cell design step. The assessment stage is the foundation of the whole process. This stage has a different focus if the cell is introduced in a new facility where the main manufacturing process/layout is not yet defined. In this case, the main objective of this stage is to determine whether or not the purpose of the facility and the expected product stream match the conditions which make cellular manufacturing a beneficial production method. However, this thesis will limit its scope to developing an approach to cellular manufacturing in already existing production environments.
When introducing cellular manufacturing in a shop like the Machining Center, which has been operating as a job shop for many years, the assessment stage not only must answer the matching
question. It must also explain why cellular manufacturing has the potential to yield
improvements over the existing manufacturing process, and create support from management to proceed with the design stage. The following list presents a short summary of the main activities to be accomplished during the assessment step:
1. Answer the match question. Is the nature of the product stream (demand and process) suited
for cellular manufacturing?
2. Gather accurate data on present situation. Data in every aspect of production is useful to understand the reality of the shop and how cellular manufacturing may impact it. Data on costs, production rates, scrap rates, lead-times, metrics, level of customer satisfaction, and culture of the organization should be included, but by no means this is a complete list.
3. Make the case for cellular manufacturing. Building on the two previous points, the advocate for cellular manufacturing must put together a strong and honest case to justify and build enthusiasm in the management for cellular manufacturing. The honesty and strength of the case for cellular manufacturing must be emphasized; introducing a new method of "doing things" is risky and involves costs. Management must have solid reasons to justify taking the risk and making the investment to support the new approach.
Given the culture of an organization, the ability to move on to the next step of the planning phase will depend at least to some extent on the credibility and motives driving the party advocating cellular manufacturing. If cellular manufacturing is mandated by top management, production and functional personnel may comply but not commit to the change. If the idea is originated at the grassroots, i.e. from the bottom up by either production of functional workers, the advocates may not have enough access to data or credibility to make an informed recommendation to get the attention of management. If the idea comes from functions supporting production,
production personnel may be suspicious of the motives of the function advocating the change. Obviously, the nature of the relationship between the function(s) and production is important in
this case. Finally, if the idea originates in the production area, it may or may not be acted upon depending on the amount or resources needed to study its validity.
The assessment step requires that the advocate has an overall, non partisan approach, access to data, credibility and commitment. Regardless of who comes up with the idea for introducing cellular manufacturing, it is wise for that person to decide whether or not he is the best advocate, and identify an advocate in the case that the originator is not the best choice. Otherwise, the idea may not even make it to the assessment stage.
3.2 Assessment at the Machining Center
The question of establishing a match between the nature of the products and the application of cellular manufacturing was finally confirmed during the summer of 1996. A small group of production and support personnel from the factory had studied the idea of establishing a
commercial cell within the center, i.e. a cell to manufacture only commercial parts. This group conceived the commercial cell to be a "shop within the shop" by collocating the NC machines where many of the commercial parts were machined, but not including the other support
operations that took place within the shop and were required before the parts were ready for the Chemical process step. A computer simulation was run to determine the impact of this "cell" on throughput and schedule performance. The simulation yielded some improvement, but
bottlenecks remained and the benefits of this cell were not clear. However, most agreed that there would be benefits from cellular manufacturing given that so many of the parts had a steady demand and were similar in process.
Building on this already established consensus and the findings concerning fit between the Center's work and cellular manufacturing (Section 2.4), the author became the advocate for the cell. Since the culture in the organization is highly functional, choosing a neutral outsider helped put all the parties involved in the assessment at ease. Later on, it was beneficial to have a
documented the reasons for and against the change. The balance of these reasons were used to justify introducing cellular manufacturing in the shop, and are presented in the next section.
3.2.1 Machining Center's Current Situation
To understand the present situation at the shop, a sample of commercial parts was studied and
shop wide metrics were examined. The commercial parts sample consisted of 160 parts, which were the ones used in the simulation mentioned above, and represent approximately one fourth of the total number of commercial parts manufactured in the Center. Tables 3.1 and 3.2 present these results, and establish the baseline for improvements.
Table 3.1 Current Situation at Shop using a Sample of Commercial Parts
Average Part Travel 1730 feet within the Machining Center, from first machining step to step prior to Chemical Process. Average Flow-time 67 days total (5% touch/95% queue), and
27 days, from first machining step to step prior to Chemical Process.
Scrap, Rework and Repair (SRR) The sample accounts for 30% of total SRR cost at the Costs Machining Center for the first three quarters of 1996. Average Set-up to Run Time Ratio 1.4 (on average 1.4 hours of set-up was spent per 1 hour of per Part run time when building in lot size of 1 part).
Table 3.2 Current Situation at Shop through its Own Metrics
Nature of Demand Commercial Parts: 45% of hours worked Military Parts: 55% of hours worked
Delivery Performance Average of 10 counters/week for first three quarters of 1996, 50% due to mfg. center, and 50% customer caused. (Goal is 2 counters/week for D&SG.)
Schedule Performance 31% of orders exceed expected Puget Sound Flow times. Machine Variance to Standard 2 is the average variance to standard in the shop. (Goal is
to have machines operating at standard, i.e. a machine variance to standard of 1.)
Inventory Approx. 5 weeks of inventory/Work-In-Progress in the Machining Center. (Goal is to reduce to 2 weeks of WIP.) Order Process Customer driven initial stage, but function driven later.
Not one group responsible for order cradle to grave cycle. Supported by many business systems.
Shop Floor Culture Work hot-list, and disregard for schedule. Operators working to conflicting priorities. Batch orders to minimize set-ups. Finger pointing, and use of formal channels only.
Although not easy to capture in the metrics, there was a certain air of urgency in the shop calling for immediate action. In particular the delivery performance was getting a lot of attention from upper management because of customer complaints. In addition, much work had to be off-loaded, i.e. work intended for the Center was sent to suppliers, because the shop could not handle the work. While the off-loading solution alleviates the capacity problems short term, customers do not "appreciate" having their work sent to another supplier. Thus in the future they may decide to use a different supplier rather than use the Machining Center; the shop then can lose customers if it uses off-loading regularly as a pressure relief mechanism.
3.2.2 Why a Cell at the Machining Center?
The assessment findings were presented to the Machining Center Leader and a group of
production and functional managers, who agreed that "something had to be done." The author urged this group of managers to support the possibility of introducing cellular manufacturing as a way to increase throughput while reducing total costs and satisfying the customer quality and schedule requirements. The presentation also restated the advantages of cellular manufacturing, which were explained in greater detail and in the context of the Machining Center. For instance, by reducing set-up times and utilizing smaller lot sizes, cell capacity would increase and the Center would have the ability to "do more work," and eliminate any off-loading of cell parts. The scheduling complexity would also be considerably reduced by dedicating machines to parts with a stable and known demand, which facilitates the Center's ability to forecast, capacity plan and respond to schedule changes or emergencies like AOG's. The collocation of the
manufacturing process steps would result in reduction of part travel distance and queuing time, which in turn would decrease costs because of less WIP and shorter flow-times. In addition, by having cell operators working in close proximity quality problems would be identified and corrected much faster than before. By being responsible for several operations in the production of a part, cell operators not only are more aware of the root causes of defects, they also develop a sense of ownership facilitating quality improvements, self-discipline and trust in the process.