DESIGN FOR INFECTIOUS DISEASE CONTROL IN THE DEVELOPING WORLD:
THE POWER OF NATURAL VENTILATION by
Abigail M. Anderson
Submitted to the Department of Architecture
in Partial Fulfillment of the Requirements for the Degree of
Bachelor of Science at the
Massachusetts Institute of Technology June 2018
2018 Abigail M. Anderson All rights reserved
The author hereby grants to MIT permission to reproduce and to
distribute publicly paper and electronic copies of this thesis document in whole or in part in any medium now known or hereafter created.
Signature of A uthor ... Certified by ...
S ig n
George Maco A ccepted by ... MASSACHUSETS INSTnTUTE OF TECHNOLOGYJUN 2
2
2018
LIBRARIES
Signature redacted
/ Abigail Anderson Department of Architecture May 24, 2018ature redacted
Leslie Norford mber (1948) Professor in Construction Management Professor of Building Technology Thesis SupervisorSignature redacted
// Leslie Norford Undergraduate Officer, Department of Architecture
Thesis Committee
Advisor: Professor Leslie Norford, MIT Department of Architecture
Reader: Cherie Miot Abbanat, Lecturer of International Development and Urban Studies, MIT Department of Urban Studies and Planning; CEO of Haiti Projects
Design for Infectious Disease Control in the Developing World: The Power of Natural Ventilation
by
Abigail M. Anderson
Submitted to the Department of Architecture on May 24, 2018 in Partial Fulfillment of the Requirements for the Degree of
Bachelor of Science in Architecture
Abstract
Contaminated particles in hospitals can spread from infected patients to those who are hospitalized for non-disease-related reasons. The reputation of hospitals, especially in the developing world, as places where diseases are spread rather than cured necessitates design strategies focused on stopping or controlling disease spread among patients. In this thesis, I examine the potential of architectural layout, among other factors, to reduce the spread of contaminants through passive ventilation strategies. Using Computational Fluid Dynamics, I propose a system of hospital rooms which minimizes contaminant spread among patients while maintaining comfortable airflow rates.
Thesis Supervisor: Leslie Norford Title: Professor of Building Technology
Acknowledgments
This thesis would not have been possible without the advice and support of several important people. I thank my advisor, Professor Les Norford, for his consistent feedback and his willingness to meet with me weekly and walk with me through this process. From idealizing in January about finishing before spring break, to frustration with computer programs for several weeks and panic about ever producing results, to the excitement of producing CFD diagrams and a complete thesis paper, he has been my dependable mentor. He pointed me to relevant literature and computer programs, and without his guidance this thesis would not be what it is today.
I thank my readers, Lisa Ward and Cherie Abbanat, for their feedback and experience-rich insight. Lisa drew on her experiences working in Haiti to help me in the initial stages of my thesis, as I was determining a subject of research, and she gave useful edits as I drafted my final thesis. Cherie helped me, along with my classmates, to explore potential research areas and discover our passions last fall. This semester, she has provided us with motivation, support, and feedback on our writing and presentations.
I appreciate the phone and email conversations I had with affiliates of Build Health International, including Rob Freni, an architect; David Walton, MD; and Ryan Jones, a site supervisor. Their on-site expertise contributed to the authenticity of my test cases and solutions.
I am grateful to my academic advisor, Professor Caitlin Mueller, for her advice as I attempt to bridge the gap between architecture and civil engineering, not only in my thesis, but in my life and future plans as well.
Finally, I am thankful to those who have emotionally supported me throughout this process, and without whose support I would not be at MIT in the first place, let alone having the opportunity to explore my passions in personal research. I thank my parents and sister, as well as my extended family, for their love and consistent care for the past two decades. I thank my friends, who have rejoiced with me over triumphs and wept with me over failures. And, most importantly, I thank God, without whom I would not have had the strength, mental capacity, or stamina to graduate from MIT and accomplish all that I have.
Table of Contents
Chapter 1: Introduction... 7
Chapter 2: Literature Review...9
Chapter 3: Precedent Study...15
Chapter 4: Methodology...19
Chapter 5: Results of CFD Analyses...25
Chapter 6: Iterations on System 2...31
Chapter 7: Discussion... 35
Chapter 8: Conclusions... 37
Appendix A: Climate Information...39
Appendix B: System Layout Documentation...41
Appendix C: Full CFD Results...43
Appendix D: 3D-Printed Model...53
B ibliography... 55
Chapter 1: Introduction
The agents that cause deadly diseases are transmitted in simple, preventable manners. Many people
in the developing world are afraid to go to the hospital for, say, a broken leg, because they have
heard stories of others acquiring deadly diseases and infections at the hospital. How can the design of a building be used to control airflow in a way that prevents the spread of airborne diseases? In hospitals, where low ventilation rates positively correlate with disease outbreaks and the spread of infection', it is crucial for airflow patterns to stop and/or control infectious disease spread.
Tuberculosis (TB) is a powerful airborne bacterium that causes more deaths worldwide annually than any other infectious disease. In 2016, over 10 million people became infected with TB, and 1.7 million died". In countries where major populations are already infected with HIV/AIDS, the spread of TB can be even more deadly. In this thesis, I study the link between airflow and airborne disease transmission, in order to discover new ways that ventilation system design practices could be or are being improved.
Hospitals in the developed world are addressing the issue of infection and infectious disease control with high- and low-tech prevention techniques. Research is revealing revolutionary design solutions, and richer countries are adopting such solutions. Which of these solutions could be applied in the developing world? Which are implausible? Which are too expensive? Which would hurt? The literature surrounding inventive prevention techniques in resource-constrained settings is sparse.
Designing hospitals with the goal of healing patients from infectious disease without transmitting their diseases to others is no small task. It is crucial to find a balance between welcoming the public and patients' families, and controlling hospital traffic and disease transmission. Isolation of infected patients and adequate ventilation are two important features that help hospitals achieve this goal'. It is not always possible to isolate every infected patient, and patients may unknowingly carry certain contaminants. In this thesis, I explore the potential of architecture to prevent disease spread in two-person hospital wards. I begin with a review of existing literature on hospital design and methods of airflow assessment, followed by a precedent study. Next, I outline the methodology of my
experiments and run a number of Computational Fluid Dynamics (CFD) simulations to test the merits of different layouts in curbing airborne contaminant spread. Finally, I iterate on the most promising layout and discuss the benefits and limitations of such a computationally-grounded design approach.
Chapter 2: Literature Review
In this chapter, I explore the current role of ventilation-focused design in preventing infectious disease transmission. Because the most prominent pollutant source is patients' respiratory
exhalations, ventilation systems in hospitals need to be designed differently than those in offices or schools"'. I describe some research into ventilation systems that is being conducted in the developed world. Then, I summarize existing work in Computational Fluid Dynamics (CFD) and its potential application to infectious disease control. Finally, I describe holes in the attempted solutions and propose paths for further research and application of such solutions in the developing world context.
Cuirent Ventilation Research and Design
I first review ventilation-related research in the health care field. Although the majority of the hospital design and ventilation research is conducted in the developed world, several groups are attempting to harness new design concepts and apply them in the developing world.
In designing for infectious disease, sources of pathogens, contact with potential hosts, and plausible means of transmission all must be controlled. Microorganisms can enter hospitals through people (such as workers and visitors) who enter and exit, or on inanimate objects that come in contact with patients. Different people have different levels of immunity, which means that many times, human hosts are unaware that they carry a certain pathogen. This ignorance causes them to unwittingly contaminate patients. Pathogens can be transmitted in a variety of ways, all of which should be addressed when designing hospitals. The most common means of transmission are contact, droplet, and airborne".
A 2015 research study at the University of Chicago Medical Center followed the movement of bacteria from patients, to beds, to nurses, to handrails, to doorknobs, and so on. The study's conclusion was unexpected: existing, harmless pathogens that are in the hospital before occupation may have actually helped to restrict the spread of harmful bacteria that were later brought in by the patients. Therefore, it may be beneficial to allow some good bacteria to survive in carefully-monitored locations. This study also peripherally suggests the importance of patient-controlled environments. Many hospitals provide patients with the ability to control their own room temperatures; however, individually-controlled relative humidity systems are rare".
In the developed world today, the biggest contributor to in-hospital disease transmission is contact with caregivers: as they move from patient to patient and room to room, nurses and doctors often carry germs on their bodies and their medical instruments". In the past, hospitals were designed to minimize floor area by keeping patients close together. This minimized the number of steps nurses had to take between patients; however, today more single- and double-patient rooms are
incorporated into hospital plans, since these add another barrier to infection transmission. Although this may be less time-efficient for caregivers, it reduces the likelihood that infections will spread on personnel or equipment.
In addition to any ventilation solutions to reduce the spread of airborne diseases, it is important to focus on stopping disease spread at the source. According to Modern Hospital Designfor Infection
Control, "hand hygiene is the single most important way to prevent hospital infections"'". Placing
sinks outside of each room and requiring staff to wash their hands upon entering and exiting reduces infection transmission dramatically. In this sense, the building design has a direct impact on
caregiver practices, which in turn influence patient well-being". Placing sinks outside of individual rooms and even group wards has been shown to reduce disease transmission. Along with improved building design, positive staff team attitudes towards handwashing also strongly contribute to improved hygiene levels and reduced disease spread.
The Partners in Health Hospital in Haiti applies a number of techniques to stop contaminant spread at the source. Placing germicidal ultraviolet (UV) lights in infection wards kills airborne organisms, viruses, and bacteria such as tuberculosis (TB). However, these lights must be placed at a height of seven feet or higher to avoid interfering with patient and doctor activities. The hospital also has a system of triage, which separates patients into the general ward, the TB pavilion, and isolation rooms. The TB pavilion has louvered windows, high ceilings, and a UV lamp, and the other two
locations have UV lamps as welix.
The World Health Organization (WHO) has found that "adequate ventilation can reduce the transmission of infection in health-care settings" ". In a 2009 report, it outlines design requirements for natural ventilation systems that aim to control the spread of airborne infections. It requires at least 80 liters per second per patient of fresh air in existing facilities, and 160 liters/second/patient in airborne precaution rooms in new facilities or major renovations. It also stipulates 60
recommends using hybrid or fully mechanical ventilation systems in such cases. Air should flow unidirectionally, from pathogen sources to areas with sufficient dilution to an exhaust (ideally the outdoors). The report also admits that, although natural ventilation may be more economical than other ventilation systems, it has a number of drawbacks: for example, it is highly dependent on climatic conditions, and it can be difficult to maintain a pressurized system that encourages unidirectional flow. However, mechanical ventilation systems also often struggle to maintain
negative pressure in patient rooms, sometimes even creating a positive pressure in which infected air flows out of the rooms into common corridors. This ineffectiveness, along with the fact that
mechanical ventilation system installation and upkeep can be expensive, point to the desirability of natural ventilation systems where climatic conditions allow them". In circulation areas especially, infectious disease transmission must be curtailed. According to the World Health Organization (WHO), corridors and transient spaces should have at minimum 2.5
liters/second
of air flow for each cubic meter of space.According to the Centers for Disease Control and Prevention (CDC), single-pass ventilation is recommended for hospital rooms with infected patients to prevent the transmission of airborne diseasesx". Qian et al (2008) perform a study in which they assess airflow patterns to test the merits of downward ventilation systems when compared with traditional systems in both isolation and general hospital wards. In general, the goal is to achieve a laminar (uninterrupted; less turbulent)
airflow which carries pollutants directly to designated exhaust openings. Using CFD and an
experimental setup to map the airflow pattern and the dispersion of pollutants from infected patient respiration, Qian et al discover that it is impossible for a unidirectional downward airflow to be maintained with four air changes per hour (ACH). This is mostly due to thermal plumes above the patients' bodies, as well as the difficulty of placing supply and exhaust outlets in optimal locations\I. Myrup et al (2008) study different ventilation strategies and their potential in ventilating hospital isolation rooms. Their report offers an in-depth overview of single-sided ventilation, stack ventilation, cross ventilation, hybrid ventilation, and ventilation with earth cooling or heating. Single-sided ventilation systems are highly dependent on thermal buoyancy and wind. The former is determined by height and size of windows, and the latter is depended on weather conditions and exterior and interior air pressures. They are not a good solution if the width of the room is greater
than two times the height. Stack ventilation, which takes advantage of air pressure differences in height, has similar benefits and drawbacks. Cross ventilation, in which air travels through two openings in a room on different walls, can
be advantageous if wind speed and
direction are relatively constant year-round, but it can be difficult to control. Myrup et al discuss three different principles for hybrid ventilation (pictured at right):
separation of mechanical and natural, which Figure 1: Principles of Hybrid Ventilation"
allows for switching between the two depending on weather conditions; fan-assisted ventilation; and stack- and wind-assisted ventilation. They investigate several hybrid ventilation strategies for an isolation room. These strategies are advantageous because they allow for requisite air changes per hour to be maintained even in inconsistent outdoor wind conditions, but they also rely on electricity. Earth heating and cooling principles heat or cool outside air before it enters the room by passing it underground, 5 meters below the surface, where it stays the same temperature year-roundx"sl.
In this section, I examined the spread of disease through contact with caregivers and infected surfaces; the importance of hygiene and keeping patients separate from one another; and the potential of ventilation systems to control the spread of disease. A well-designed infectious disease ward should thoughtfully incorporate as many of these design techniques as possible. Although sinks are an important architectural feature to stop disease spread at the source, I do not include them in my designs; I focus instead on manipulation of airflow to reduce contaminant spread.
Testing Airflow - Review of Computational Fluid Dynamics as a ToolforAssessing the Spread of Contaminants CFD is a powerful tool which allows for the simulation and assessment of airflow patterns through
different spaces. It can map particle and trace gas movement to show the effectiveness of air changes and contaminant removal. Sadrizadeh (2016) discovers high variability in airflow patterns, regardless of the design of the ventilation system; it is important to assess each design strategy independently. Sadrizadeh focuses on preventing surgical site infections, which occur in 7% of
surgeries. He asserts that pathogens can originate from "human skin flora" and can spread through contact or air. His work focuses on the effects that ventilation systems have on thermal comfort, amount of contaminants, and air quality. Different types of surgeries require different ventilation
methods), he concludes that horizontal laminar airflow systems are preferable to vertical for many reasons. Hybrid systems using a combination of vertical laminar air flow and mixing ventilation systems, however, are optimal\.
In their 2008 publication, Qian et al describe their use of CFD simulations to map airflow within a test system and observe pollutant spread throughout the room, to compare results to their
experimental setup. One of their goals is to track the spread of contaminants from an infected to an uninfected patient. In their simulations, they focus on refining the geometry of the CAD-produced models of the manikins, so as to precisely track the movement of the heat and air produced by patients under different
a
ventilation systems, holding room size and patient placement
constant. Some examples of their
results are shown at right". In
T
this thesis, I use their CFDresearch methodology to track Figure 2: Aiiflow Patten and Concentration Contour'
airflow and pollutant dispersion in several different room and ventilation system layouts. Bowen et al (2018) assess airflow as a function of room geometry, window louvers, and fan
direction. Using CFD to map velocity in a number of systems, they determine which are best under different conditions for maintaining the requisite ACH for infectious disease wards. They aim to optimize airflow with minimum mechanical intervention. They highlight that much of their analysis is site-specific, but some important architectural features in contributing to airflow are central courtyards, outdoor corridors, and sloped roofsxx". I will test the effects of a sloped roof on contaminant spread patterns in Chapter 6.
Roomfor Future Work
Research has been conducted in the field of ventilation control for health-care settings. Most of this work studies the control of ventilation for thermal comfort, including comfortable indoor
temperatures and wind speeds, in high-tech hospitals in the developed world. My research instead focuses on design with natural ventilation for the control of contaminant spread, specifically as applied in developing world settings. I will build on the work that has been conducted by studying
simple natural ventilation systems and assessing their effects on contaminant spread in a hypothetical hospital ward in Ethiopia.
Chapter 3: Precedent Study
In this chapter, I present hospitals in both developed and developing countries whose designs embody current research on the importance of thoughtful architectural design for the prevention of disease spread in healthcare facilities.
In the Emergency and Infectious Diseases Unit at Malmo University Hospital in Sweden (Figure 3), infected patients and supplies are transported in
airlocked walkways and elevators, while nurses, doctors, and sterile supplies move through a
different circulation system. In case of an epidemic, certain units and floors can be sealed off to prevent disease transmission""'. These features reduce
patients' risk of leaving the hospital sicker than when Figure 3: Ma/mo Universiy Hopita, Sweden
they entered, which is a genuine concern around the world.
The Ng Teng Fong General Hospital in Singapore (Figure 4) opened in 2015. The architect, San
Francisco-based firm HOK, focused on a number of passive cooling strategies to help patients feel comfortable, applying several strategies that have been developed in hospital design research. An open floor plan with small wings for each patient, visually resembling a bird taking flight, allows each patient to have their own corner
with an operable window. This allows for a breeze any day. Research has
shown that humans are more
comfortable in tropical climates when
j
they are exposed to higher temperatures with a breeze than artificially-created cooler temperatures. Even the
temperature of incoming breezes is Figure 4: Ng Teng Fong General Hospital, Singapor"'
controlled: many exterior shading elements, including precast concrete overhangs with plantings and vertical sunshades, lower the temperature of incoming air before it reaches the patients. Each
fa~ade's shading system is different, depending on its amount of sunlight exposure. The many plantings also provide evaporative coohing".
Aabenraa Hospital in Denmark was renovated in 2002 as part of a European Union (EU)-funded project to renovate five European hospitals and explore new hospital design techniques. A goal of the project was to prove that existing rooms can be transformed by natural ventilation without intrusive construction work. A transition from a fully mechanical to a hybrid ventilation system in Aabenraa Hospital reduced electricity demand by
93%. Myrup et al (2008) focus on optimizing airflow through controlled natural ventilation, while taking advantage of local climate conditions: an average
ambient temperature of 8 degrees Celsius, 82%
-relative humidity, and 1.37 meters/second average wind speed. The effect of greater wind speeds is powerful in natural ventilation systems because the airflow velocity through an opening is proportional
to wind speed. Aabenraa Hospital has several glazed Fgure 5: Gla ed Cour ard Location
courtyards, marked by dots in Figure 5. In these courtyards, hybrid ventilation systems that use displacement ventilation were installed as part of the 2002 renovation. As documented in Figure 6, there are fresh air inlets at the bottoms of
exterior walls, so that outdoor air passes through Figure 6: Fresh Air Inlet
the basement and acquires a constant
temperature of 16 degrees Celsius on its way I
to the common areas. It then passes
through a particle filter and a convector I element before entering the room. Cowls on
the roof draw up exhaust air by creating an Figure 7: Roof Outlets'
"under pressure" from wind passing over the roof and, if the wind is insufficient, fans. This lower pressure pulls air through the entire system and ensures an air change rate of 1.0-1.5 air changes per hour. Bed wards make use of hybrid ventilation as well. At inlets in the bottom of the fa~ade, air is
heated to 18 degrees Celsius to avoid draught. It then passes through the ward, exiting through outlets on the roof with wind-driven fans and mechanical backup (see Figure 7). Temperature and carbon dioxide levels are controlled with a new Building Management System, which allows for more precise control of indoor climate and better monitoring of technical systems"x.
Although never constructed, the Shenzhen Infectious Disease Hospital (pictured at left) in southeastern China embodies many
principles of design for infectious disease. It maintains the traditional concept of housing infectious disease patients downwind from uninfected patients and staff. The floors are zoned into infectious, semi-infectious, and non-infectious wings, with physical barriers
Figure 8: Shen
hen
Infectious Disease Hospital" blocking contamination that might occur through contact with staff or instruments, and the public is restricted to certain areas. The hospital uses advanced mechanical systems to maintain proper ventilation in all wings. The fingerlike wing layout also channels wind through the building to maximize natural ventilation and minimize the need for the external mechanical systems. Because of the layout, patients all have views to the outside and most have exposure to direct sunlight xx.Build Heath International architects built a new isolation ward and emergency room (ER) for St. Boniface Hospital in Haiti. It is known as the Center for Infectious Disease and Emergency Care
(CIDEC), and it officially opened in March 2018. The ER uses natural ventilation, mainly for
control of temperature and moisture. The system itself is comprised of many offset low and high fixed louvered windows to maintain a constant airflow, jalousie windows to adjust circulation, and a large pitched roof. Some rooms within the emergency ward have mechanical circulation systems including roof exhaust fans to control heat and moisture"i. The isolation wards utilize upblast roof exhaust fans in almost every room to maintain 12 air changes per hour (the recommendation by the World Health Organization for rooms with an "airborne isolation precaution" xxx"1). Rooms here are negatively pressurized by roof-mounted exhaust fans to keep air flowing away from sterile areas and the clinical staff. The central Nurse Station is positively pressurized by a wall supply fan
Many of the important design elements identified in the literature are exhibited in the case studies described. In one of my systems, I test the effectiveness of placing patients in their own corners
with adjacent windows, as was applied at Ng Teng Fong General Hospital in Singapore. I examine the contaminant concentrations in hallways to assess the benefits of having open-air corridors. I do not study the effectiveness of physically separating contaminated from clean patients, as I assume that many hospitals in the developing world do not have the luxury of detecting all diseases with which patients come in. My design choices will be detailed more in the following chapter.
Chapter 4: Methodology
In this section, I outline parameters of the rooms and simulations, including regional climate constraints. I then present the rudimentary designs of three possible ventilation systems for layouts of two-patient hospital rooms in which airborne infectious diseases could be an issue.
Climate
For the purposes of this evaluation, I study a generic, representative site near Addis Ababa,
Ethiopia. Relatively high, consistent wind speeds on the plateau that is Ethiopia make this location an ideal candidate for the utilization of natural ventilation. Using Climate Consultant 6.0 and an epw file obtained from EnergyPlus for Addis Ababa (8.98 degrees North, 38.8 degrees East), I determine average wind speed and direction for this area. I use the ASHRAE Standard 55 in determining thermal comfort, which accounts for dry bulb temperature, air velocity, humidity, and metabolic activity, among other metrics"""". The elevation of Addis is 2355 meters. Typical temperatures in Addis range from 7 degrees Celsius to 24 degrees Celsius, with year-round monthly averages
between 15 and 20 degrees Celsius. Wind speeds are relatively consistent year-round, with monthly averages between 2.5-5 meters/second and extremes ranging from 0.5 m/s to 9 m/s. In my analyses, I use 2 meters/second as a conservative estimate of winds speed. We see from the wind rose that, for most of the year, wind comes from the East or Southeast, although there is some variability. In my initial simulations, I test performance under wind coming from due East. I later expand these for one simulation to assess airflow during other times of the year. See Appendix A for more in-depth climate information and associated charts.
Simulation Setup and Parameters
In the simulation setup, I make several important assumptions about parameters. Each system encompasses 3-4 rooms in a system which could be part of a larger hospital wing. Doors are taken to be 1 meter x 2 meters, and hallways are 1.5 meters wide. Window dimensions vary for each system, based on calculations described below. Similar to the rooms in Qian et alx"-Vji, each room is approximately 15 m2
and contains two patients, one infected ("source" patient) and one
non-infected ("receiving" patient). Although it would be ideal for rooms to only contain one patient, this is often unrealistic in healthcare facilities in the developing world. It would be more realistic to model rooms with ten or more patients, but the results of contaminant spread mapping in such rooms would be difficult to predict and highly dependent on the locations of infected patients.
According to David Walton, MD, of Build Health International, it is common for patients to come into a hospital not knowing what diseases they carry, and for diseases to spread to other patients unbeknownst to the patients or the staff --""'. I assume that, regardless of the conditions for which
they are being treated, patients may be carrying other diseases which are not immediately visible. Upon qualitative preliminary assessment of each system, I place the infected patients in the least optimal beds, under the assumption that it is unknown which contaminants each patient is carrying. Windows were sized according to World Health Organization (WHO) guidelines for infectious disease wards"x, which present the following equation for achieving the required twelve air changes per hour (ACH):
0.65 wind speed (m s) -smallest openng area (m) 3600 s h
ACII
room volume (MA)
In my calculations, I make the following assumptions:
Wind speed at window opening
=
2 m/s, a conservative estimate from my climate analysis Room volume 37.8 mA3, 4.2m x 3.6m x 2.5mRequired ACH 18, 12 required by the WHO for an infectious disease ward*t 1.5 safety
factor
This produces the following formula for finding the required smallest opening area:
18 = 0.65*2*A*3600/37.8
A=0.15 m
2The smallest opening through which air must travel in any system must be at least 0.15 square meters in area, or about 0.38 m x 0.38 m. In each proposed system, the smallest opening is at least 1
m2 in area, so, with this wind speed and direction and according to this formula, it should be able to
achieve the required 12 ACH with a comfortable safety factor of 1.5.
Each proposed layout was uploaded to scSTREAM, a Computational Fluid Dynamics (CFD) software, as an xt file. Openings were defined in scSTREAM as windows, doors, and corridors connecting to other wings. The bounding box I use is the size of each system, plus an additional one meter in each of the x and y directions. This allows for an examination of the supply and exhaust airflow outside of the rooms, while maintaining a constant ceiling height in the rooms and corridors. In further analyses, this empty volume will be valuable in assessing the impacts of this wing on adjacent existing or new construction. I orient each system based on predicted airflow
direction; I take advantage of prevailing wind direction in the Addis Ababa area. At first, I assume that wind is coming from due East at 2 meters per second, at a reference height of 2 meters. I use the parameter "urban area formed by small buildings" as the environment in scSTREAM. In assessing each system, I use scSTREAM to map airflow and contaminant spread from the source patient to the rest of the system.
For the sake of consistency, my simulations all assess the spread of tuberculosis (TB) particles in particular. Ethiopia is the eighth-highest TB-burdened country in the world-". For TB particles to effectively infect patients, they must be between one and five micrometers in diameter; this allows them to be aerosolized and reach the alveolar level in the lungs, past the upper respiratory tract. At this size, particles remain suspended in the air, rather than falling due to gravity. However, it is also necessary to remember that only 10% of TB particles survive aerosolization, 5% survive six hours after leaving the body, and only 0.25-0.5% successfully lodge in the lungli; not everyone exposed to the particles will develop symptoms.
I perform a series of diffusion-mapping simulations to trace the way that a contaminant particle such
as TB would spread. I use a diffusion coefficient of 1x10^-5 m2/s, and set the "amount of smoke"
in scSTREAM to 2x10^-5 particles. The condition regions from which the particles are emitted (source regions) are the "cuboid" heads of the infected patients. I run a diffusion steady-state analysis for each system, which means that the analysis converges in ~150-200 cycles. I then use the Postprocessor in scSTREAM to map contaminant spread and air velocity throughout the rooms. Velocity is measured in meters per second, and contaminant concentration is displayed as
10^7*contaminant count, in order to make the particle concentration differences visible when the colorbar scale is from 0 to 1.
Analyzed Systems
I perform CFD analyses for three different room systems,
described below. See Appendix B for further documentation and dimensions of each system. System 1: Single-Loaded Corridor
This model includes three adjacent rooms along a
larger block, so the corridor continues in each direction. Large windows in each room face east, the direction from which, according to my climate analysis, prevailing winds come for the majority of the year. Doors from each room open into the corridor.
System 2: Double-Loaded Corridor
This four-room model studies airflow through rooms on both sides of a double-loaded east-west corridor. It assumes that other similar room blocks sandwich this section, so windows can only be placed on the north and south sides. Therefore, air will flow parallel to the window openings.
The end of the corridor is treated as an opening that faces Figure 10: System 2 Isometric
due east, to investigate the effects of less than ideal building orientation and the potential of hallways to carry both fresh and stale air.
System 3: Translated Double-Loaded Corridor
Similar to System 2, System 3 contains four rooms flanking a double-loaded east-west corridor. In this system, I assume the room block is on the end of the hospital building, so windows facing due east are possible in the eastmost two rooms. The diagonal corridor allows there to be windows on at least two walls in every room to provide higher wind velocities and air changes per hour. Some patients are
adjacent to up to three walls with windows. In the Ng Teng Figure 11: System 3 Isometric
Fong General Hospital in Singapore, designers gave all patients their own windows directly adjacent to their beds, to allow for fresh air and views to the outside. In System 3, I test the effects of this design decision on airflow and contaminant spread.
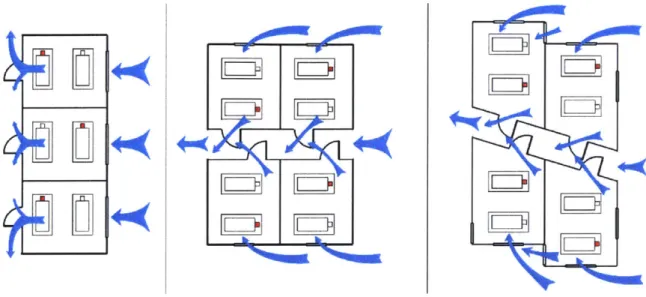
I hypothesize that air will flow as documented in Figure 12 if there is a constant east wind for each
system. In the next chapter, I present the results of a CFD analysis of airflow and contaminant spread.
9
Figure 12: HlypothesizedAi flow
loooo
N F=7
Chapter 5: Results of CFD Analyses
I perform a CFD analysis of each system, including diagrams of airflow and contaminant spread. I
remark on each, and compare the three systems with one another. See Appendix C for a more comprehensive list of simulation output figures. In the next chapter, I further expand upon System 2, assessing its performance under different wind conditions and with different roof geometries.
Basic Box
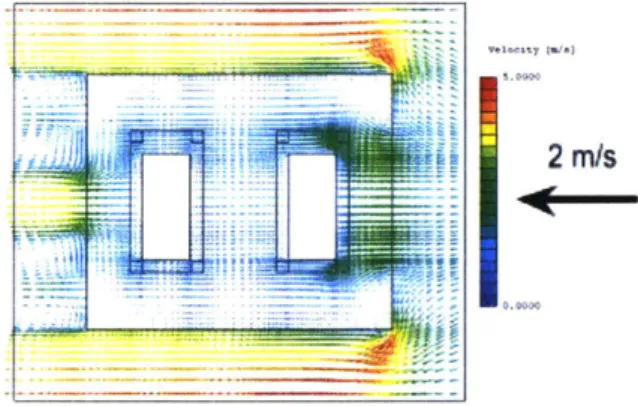
To confirm the parameters and workflow in scSTREAM, I begin by assessing a single room similar to the rooms in each system. It has the same dimensions (4.2 m x 3.6 m x 2.5 m) as a room in Systems 1 and 2, and I assess it under the conditions described in the Methodology section. I find that, if the patient closest to the window is infected, the other patient is likely to receive air that has almost the same concentration of particles as the air around the source patient's head. Particle counts (*10^7) are marked in several locations. The velocity field is as expected for a 2 m/s wind
coming from due East.
Figure 13: Number of Contaminant Particles (*/0^7)
2 m/s
Fzgure 14: Velocit Field (meters/second) By looking at isometric drawings, I see the contaminant spread as a
function of height, in relation to the location of the beds, patients, and window openings. Although it is difficult to display the three
dimensions of contaminant spread on a two-dimensional medium, stacked isometric drawings display some of the depth and dimensionality of particle diffusion in a given space. By placing cut planes in different locations, we can see the influence that height and location have on particle spread. There are more particles closer to the floor, and slightly downwind of the contaminated patient. The downwind effect is greater
IJ f L
r~.
higher in the room; closer to the floor, the particles do not surround the receiving patient as heavily. Particle sinking is due to the effects of gravity.
Contaminants spread from a source patient in a single-room system in a
fairly predictable pattern, carried by a straightforward airflow velocity Figure 15: Particle Count
pattern. at Different Heights
System 1
I evaluate System 1 in a similar way. The velocity mapping is less straightforward because
scSTREAM requires a wind velocity point location: in my case, that location was 2 meters above the ground at the center of the east side of the system. This is why the velocity vectors are slightly different in each room, but symmetric about the middle horizontal axis.
From the contaminant distribution mapping, I see that much more of the air is contaminated in the middle room because the infected patient is closer to the window. In cases where the receiving patient is closer to the window, the particle concentration at his/her head is close to 0, and the particles remain more localized around the source patient. For all three rooms, the expulsion of particles into the hallway occurs in a similar pattern.
23
2 m/s
0.0000
From the isometric stacked drawings at right, I observe that, at all heights, the middle room has the greatest area of contaminated air, although in the southernmost room, the concentration of contaminants is higher (in meters) on average. Contaminant concentration is about 0.1 in much of the hallway, especially closer to the ground. This difference in height is likely due to gravity and particle settlement.
Contaminated air clearly diffuses throughout a room when the wind comes directly into the windows, rather than flowing parallel to the window openings. Air flows in a fairly consistent direction, past the infected patients and into the hallway. In these rooms, it is very important for the source patient to be farther from the window to prevent contaminant spread to the other patient, but many times it is
difficult to know whether a patient is carrying certain diseases because they are often asymptomatic".
S)stem 2
Figure 18: Paricle Conit
at Different Heights
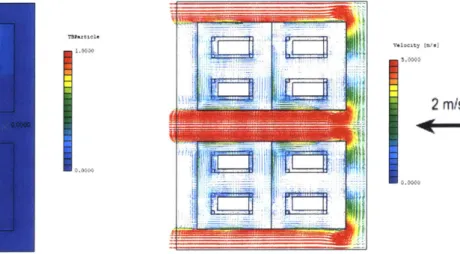
System 2 is a modified version of System 1, rotated ninety degrees so that air flows parallel to the major room openings. I find extremely high-velocity airflows in the hallways and around the north and south sides of the building, but much lower airflows within the rooms. Inside the rooms, airflow ranges from 0.2 m/s to 2.5 m/s. Such low airflows could be uncomfortable if the temperature and relative humidity are high.
To ensure that rooms in System 2 retain the requisite 12 ACH without a 2 meters/second wind flowing directly perpendicular into the windows, I recalculate the WHO formula for air changes per hour, using 0.1 m/s as the wind speed. This is the vertical component (in Figure 19) of the velocity at the center of the window of the room in the northeast corner. The area of this window is 1 n2.
0.1-
*
1m2
3600s
ACH= S _* =9. ACH
37.8m3 hr
This is slightly lower than is required by the WHO for infectious disease wards. The windows should be expanded; if their area was 1.5 m2 instead of 1 m2
Contaminants are much more contained in this configuration than in System 1. In all four rooms, the receiving patient is exposed to a low or zero concentration of particles emitted from the source patient. The particles spread slightly more in the downwind rooms, but not to the extent that they
spread in System 1. In all four rooms, contaminants slightly tend to diffuse towards the center of the room, rather than unidirectionally, because there is not a clear inlet and outlet for outside air.
5.9413
AlFJii1l)
v~it2 /s
2 rn/s
Figure 19: Number of Contaminant Particles ('*1Q^7) Figure 20: Velocity Field (meters/second)
From the isometric drawings, I see that particle spread occurs in a nearly spherical pattern; concentric circles of contaminants
emanate from source patients in all three directions. At the floor level, furniture complicates this pattern, but at head level (for both patients and caregivers), concentration of contaminants is a simple function of distance from the source patient's head, with slight modifications because of room size and the walls as a limiting factor.
Many of these results were unexpected. The hallway air is almost entirely clean, and the particles spread much less than was
expected. Primarily because of the cardinal orientation of System 2, it seems to be a better option than System 1 in reducing
contaminant spread.
System 3
System 3 presents a unique design challenge. While the windward rooms receive high indoor air velocities and low contaminant spread from source to receiving patient, the leeward rooms have little airflow and thus very high contaminant concentrations. Airflow of up to 4 m/s in the windward rooms may be uncomfortable for patients and caregivers, especially in a climate with relatively low temperatures such as Addis'.
The contaminant concentration is far more in the two leeward rooms. In both, the receiving patients receive a significant amount of particles emitted from the source patients. The exhaust of these contaminants is slow, so particles get trapped in the rooms. On the other hand, the windward rooms with east-facing windows have very low contaminant spread, and the receiving patients receive almost no particles from the infected patients. As in the Ng Teng Fong General Hospital in Singapore, the infected patients are directly adjacent to their own windows, and thus contaminated air leaves quickly.
~~
2ni
0.0000
Figure 22: Number of Contaminant Par/icles (*10^7) Fgure 23: Veloity Field (meters/second)
At all heights, these patterns remain. This system works well for the rooms whose infected patients are situated in the corner between
two windows, but not if the infected patients are closer to the interior hallway. In an ideal system, all infected patients would be adjacent to one or two walls with windows; in System 3, this is not the case for the two leeward rooms.
Simulation Conclusions
For the primary goal of reducing contaminant spread among patients, System 2 works best. Contaminant particles remain concentrated around infected patients and do not spread to other patients or the corridor. Airflow in most parts of System 2 is lower than in most parts of the other systems, but this is actually a benefit because of the cooler climate of Addis Ababa, where it reaches a maximum of about 25 degrees Celsius year-round (see Appendix A). From these simulations, I see that there is a
tradeoff between airflow velocity and contaminant spread. In the
next chapter, I will examine that tradeoff in System 2 by testing its Figure 24: Particle Couni
performance under different wind conditions and with slightly al Df/#rent Heights
Chapter 6: Iterations on System 2
In this chapter, I examine potential design iterations and challenges that could factor into airflow patterns and contaminant spread. I discover that moving beds against walls is slightly beneficial, and changing roof slope, wind speed, and orientation has detrimental effects on contaminant spread because of their positive effects on airflow. In addition, changing the locations of source and receiving patients does little.
In my first two iterations, I change features of System 2 that I predict should not have a large effect on the results of my simulation. Instead of extending the computational domain one meter in two directions, I extend it five meters in all three dimensions. This should reveal any major wind or contaminant spread effects that the building may have on surrounding buildings. Although the wind velocity effects reach far both downstream and upstream of the building, as shown in Figure 25, contaminant spread is for the most part relegated to within a meter of the perimeter of the building. This validates my use of a smaller domain in all other simulations.
Figure 25: Results of Iteration 1 - Velocity and Contaminant Spread Diagrams
Next, I reverse the locations of the source and receiving patients. This produces results approximately as expected: particle
concentration distributions are the reverse of the distributions from my initial tests. Particles spread more in the windward (eastern) rooms, and rooms with infected patients closer to the windows are more ideal in expelling contaminated air.
Figure 26: Particle Distribution,
0.0000 gig UP-= it 16, " lil"I 'Jill 41
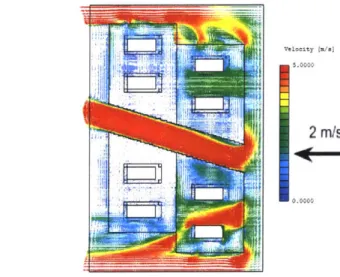
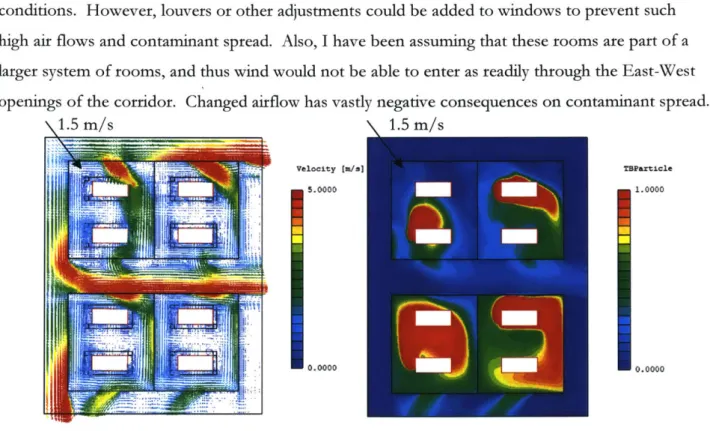
My initial tests all assume that air flows from due East at a rate of 2 meters/second year-round. Under these simple, unidirectional wind conditions, System 2 worked well. However, as shown in the wind roses in Appendix A, wind speeds and directions vary. For my next test, I assess System 2 under a North-Northwest wind flow of 1.5 m/s, as is common in the month of July. Velocity pattern changes drastically. Airflow is higher in the rooms, in some cases over 5 m/s, and in the hallway, wind rapidly flows from West to East. Particles spread much more prolifically from source patients, especially in the southern rooms. Large amounts of the particle are expelled into the hallway and through the southern windows. All
Figure 27: Particle Distribution,
receiving patients receive air with a significant amount of the Changed
Wind
Directionparticles. The system clearly will not work well under NNW wind
conditions. However, louvers or other adjustments could be added to windows to prevent such high air flows and contaminant spread. Also, I have been assuming that these rooms are part of a larger system of rooms, and thus wind would not be able to enter as readily through the East-West openings of the corridor. Changed airflow has vastly negative consequences on contaminant spread.
N1.5 m/s
\
1.5 m/svelocity [u/l TBPrticle
5.0000 1. 0000
0.0000 -30.0000
Figure 28: Results of Iteration 3 - Velociy and Contaminant Spread Diagrams
I next move the patients so that their heads are directly adjacent to the west-facing walls. This would allow caregivers to move more freely in the rest of the room, as well as reduce the number of
Z7,
degrees in the x-y plane (out of 360) in which particles
TBParticle
can be emitted from source patient heads. The simulation 1.0000
provides results similar to my initial tests, with a continued pattern of isolation of receiving patients from
contaminants. The difference between contaminant spread patterns in windward and leeward rooms is less
drastic here than it was in the original simulation, although 0.0000
not by much. Placing the beds directly against the walls seems to be a positive improvement on System 2's
original design. Fgure 29: Contaminant Spread, Beds Moved
Finally, I change the slope of the roof to
approximately 1:12, a standard slope for buildings in warmer regions. For my simulations thus far, I have been assuming that these patient rooms are either part of a larger stack or have a flat roof. However, Jensen et al (2005) found that varying roof slope has
a powerful effect on indoor airflow", and this Figure 30: Sloped Roof hypothesis was supported by Bowen et al (2018) '. In
that vein, I test how changed velocity patterns due to roof shape affect contaminant spread, assuming the building is one story tall (see Figure 30). This has significant effects on velocity patterns in all dimensions (see Figure 31). This increase in interior velocity affects contaminant
spread patterns. Particles spread far and
unpredictably. They rise more than they fall, as velocity [.
I
I .~)j5.0000is shown in the three isometric diagrams on the -.***
next page. Building with a sloped roof
Figure 31.: Velodo~ Fields, Sloped Roof
Hil0
2 Wns
undoubtedly increases airflow, but it also increases contaminant spread.
TBParticle
1.0000
.'T ..i.
Uigllre
32: Conz/alnvhanz/Spread
Sloped
RoofChapter 7: Discussion
In my first set of tests, I discovered a number of important patterns in airflow and contaminant spread for the chosen site in Addis Ababa, Ethiopia. There is a positive correlation between airflow velocity and particle spread; as air flows through rooms more quickly, particles diffuse more and are more likely to reach the healthy patient and the circulation areas. I found that, as airflow velocities increase and source patients are placed in regions with more airflow, contaminant spread increases. Source patient proximity to windows is a major factor in contributing to contaminant spread.
I iterated on System 2 because initial testing revealed it to be the least conducive to contaminant spread of the three systems. I discovered that its performance is poor under wind coming from North-Northwest. Louvers on North-facing windows may be able to help address this issue. Designing with a sloped roof increased contaminant spread because of its drastic effects on increasing interior wind velocities. Placing patient heads adjacent to walls slightly reduced contaminant spread.
In this thesis, I used a computational design approach to test the merits and drawbacks of different room systems. Because of this quantitative analysis, I can be relatively confident in the contaminant
spread patterns. There are, however, several drawbacks to a computational approach. Qian et al (2008) study airflow and contaminant spread in both physical experimental systems and the
computer environment"'. My work is limited by the inability to construct full-scale hospital wards equipped with airflow and contaminant concentration sensors to test the accuracy of the CFD tool that I use. My CFD analyses may also be missing important environmental factors, such predicted rainfall and weather eccentricities, which are difficult to replicate in the simulation environment. Depending on the site type (sloped hill, open plain, etc.) of any hospital, actual wind inflow may vary drastically. A hospital's proximity to other buildings and other wings and floors of the hospital itself may also lessen the accuracy of findings within the CFD environment. Such specificities are difficult to model within scSTREAM; they call for more intensive modelling techniques and simulation programs.
My simulations fail to account for cross-contamination among wards. I assume that intake air is clean, but this may not be the reality if windows and doors are exposed to exhaust air from another wing of the hospital or an outside source of pollutants. Similarly, I ignore the detrimental effects that exhaust air from contaminated patients may have downstream. In my work, the goal is to
preclude the receiving patient from encountering airborne contaminants, but I do not deal with the responsible exhaust of such particles out of the building system. This could cause particle spread in wards or buildings downstream.
In most cases, doors and windows can be opened and closed. Depending on outdoor weather conditions, patients and caregivers may adjust exposure to corridors and the outside by opening or closing windows or doors to different degrees. According to Lisa Ward, at St. Boniface Hospital, staff members are aware of the importance of protocol in maintaining the negative pressure airflow
system""'. Ceiling fans and other mechanical ventilators that may supplement passive ventilation can
be turned on and off. Further work could investigate the alignment of thermal comfort adaptations with the goal of infection spread control.
In my simulations, I investigate the diffusion of particles of a certain size (described in Chapter 4: Methodology). However, heavier or lighter particles may travel differently. In addition to disease particles, there are other types of contaminants such as pollution and dust that do not originate in simple point sources but rather enter with inlet air. ASHRAE 62 has guidelines for acceptable levels of pollutants such as carbon dioxide and sulfur dioxide"'. For the sake of simplicity, in my
simulations, I only study particles of a certain size, specifically particles with a diffusion coefficient of 1x1O^-5 m2
/s. In the future, the relationship between (i) particle type and origination source and
Chapter 8: Conclusions
My final proposed design is a double-loaded
east-west corridor with windows on the north and south faces. This four-room plan could be
repeated multiple times consecutively, as shown in Figure 33. Beds are placed directly against the west-facing walls. See Appendix D for additional photos of the final 3D-printed model.
I explored several design iterations and assessed
the impacts of each on contaminant spread and airflow. However, there are still numerous other design choices that could be investigated: placing beds on the opposite wall, working with ten-patient rather than two-ten-patient rooms, and testing multi-story hospitals, to name a few. The
prospect of adding louvers on windows also needs to be explored.
For climate parameters, I studied an open site in Figure 33: Final Design, Rhino
Mode!
and Addis Ababa, Ethiopia. How could my work be PhysicalModelapplied elsewhere? On the grander scale, application
in rainy, hot, humid, and elevated climates should be explored. The design principles I discovered regarding the correlation between contaminant spread and airflow could theoretically be applied in many hospital design projects, although site features such as varied climates, proximity to other buildings, or landscape features such as mountains and plains many affect the inter- and intra-room contaminant spread patterns.
In this thesis, I began by surveying existing literature and the use of CFD to assess airflow and contaminant spread in hospitals, especially in developed countries. I then ran a series of CFD tests to assess three different hospital ward layouts. Finally, I tested a few possible iterations on the most promising design, System 2. I discovered a tradeoff between airflow and contaminant spread which
must be reconciled based on climate conditions. Many questions are left unanswered, and there are numerous opportunities for further research.
Appendix A: Climate Information
TEMPERATURE RANGE IN: ADDISABABABOLE, -, ETH
ASHRAE Slandard 66-2004 uabig PMV.te: S. * Nown. 38.8- East. Tie Zone from Greenwich 3 ce: SWERA 6348 WMO Station Number, Eevaton 23 n
LEGEND -E00 HM -o DESSOEH --AVERAMNK11. EMEM- ECkWLM-VE ERW MM EHN A 0 1%ofmtmisbi o .5%oaf-ku Ah o 0%afPma'sMfgve
DESM LOW: Renbri o 1%omab~smw
o.5%ofHa.BloUw 0% ofmn-.t.
* -IoW400c
o tInt
WED VELOCFTY RANGE
LEGEND AVO HC% IECOIEEDLOW-@0 b27 WA O.tbo> 40
The average monthly temperature in Addis Ababa is between 15-20 degrees Celsius year-round. For most of the year, high
temperatures are in the thermal comfort zone, but low and mean temperatures are below it.
30 - - -- - - - _ _
1o
5 --- -- - --
W-LOCAON: ADDABAAOLE, -, ETH
L uaI- m.Ibe.VJS No&st. 3S.6 Eat. ime Zone from Greenwich 3
Deaftue: SWERA 634500 WMO Staon Number. Wevadon 235 m
30- 29---26- - - - - - - 24--- 22---12 -J - -- -Ia n -4- N- -W Ji Ad -4- Se -- NW -D--c
The lowest average monthly windspeed is just over 2
meters/second. The highest winds occur in the fall and spring,
ranging from 1.5 m/s to 8.5 m/s.
A-at
.
.
.
. .
.
.
AYuWN
-~ LOCAIOK: WSU.*AA&OMIMU1
Lb.A"W""tf.. o SMt xUS NEML TAO &W "0eiI Dow IV~s. VAMP G350AOSBM~M 3S525a
LEOUNO isin mesa * US N UN N UN U * o * eses 0 A year-round wind rose is pictured at left. Below are average wind speeds and directions, broken down by month. -IF~ 2 CM U U U
47
Appendix B: System Layout Documentation
Infected patients are highlighted in red. System 1: Single-Loaded Corridor
1.5m 4.2m 0 0 0
~2.Omn
z -gj z M PLAN N t 3.6m2F
2.Om 10.8mSystem 2: Double-Loaded Corridor
J 1.0m L 3.6m 4.2m .SRRIDOR CON . 4.2m 2PmA PLAN I I
Fr-n
L2.0mJ . 1.0m L SECTION 10.8m -1.0m 2.0m EAST ELEVATION 2.5m J 1.sm 4.2m SOUTH ELEVATION omflmaila
1.0m SECTION 4.2m 1.5m 4.2m 2m EAST ELEVATIONT
1.0M 2.5m '. 1.0m 2. SOUTH ELEVATION -2.m7 _
.0mg,19
11
H
System 3: Translated Double-Loaded Corridor
H-3.6mn
Ji.5M LA J1..M 1..5m _ _ iNI
SECTION EAST ELEVATION 7.2mT
1.Om_ 2.5m SOUTH ELEVATIONAppendix C: Full CFD Results
Basic Box
4
Mesh conditions
Z plane cut, 3 different levels
TDParticle
1 1. 0000
0.0000
LI
Y plane cut, 3 different levels
vol Lty [A/2)
5. moo
'.000C,
j
System 1
Mesh conditions
TBParticle
1.0000
0.0000
Z plane cut, 3 different levels
A~ti~w
I
~r1J~itL
Y plane, 3 different levels (looking from south-all cuts are through southmost room)
Velocity [m/el
5.0000
0.0000
Sysern 2
Mesh Conditions
L21"~
Y plane, 3 different levels (all within one room)
LZZIIEZ~lzzi~
{pi
X plane, 3 different levels (all within one room) (looking from east)
-Velocity [m/s]
5.0000
0.0000
System 3
Mesh Conditions
Y plane, 3 different levels (all within one room, looking from south)
Velocity [m/s)
5.0000
0.0000