Design of a Microbreather for Two-Phase Microchannel Devices by
Brentan R. Alexander
SUBMITTED TO THE DEPARTMENT OF MECHANICAL ENGINEERING IN PARTIAL FULFILLMENT OF THE REQUIREMENTS FOR THE DEGREE OF
MASTER OF SCIENCE IN MECHANICAL ENGINEERING AT THE
MASSACHUSETTS INSTITUTE OF TECHNOLOGY
JUNE 2008
©2008 Massachusetts Institute of Technology. All rights reserved.
Signature of Author:_______________________________________________________ Department of Mechanical Engineering
May 21, 2008 Certified by:_____________________________________________________________
Evelyn N. Wang Assistant Professor of Mechanical Engineering
Thesis Supervisor Accepted by:_____________________________________________________________
Lallit Anand Professor of Mechanical Engineering Chairman, Graduate Thesis Committee
3
Design of a Microbreather for Two-Phase Microchannel Devices By
Brentan R. Alexander
Submitted to the Department of Mechanical Engineering On May 21, 2008 in partial fulfillment of the Requirements for the Degree of Master of Science in
Mechanical Engineering
Abstract
Multiphase flows in microchannels are encountered in a variety of microfluidic applications. Two-phase microchannel heat sinks leverage the latent heat of
vaporization to offer an efficient method of dissipating large heat fluxes in a compact device. In microscale methanol-based fuel cells, the chemical reactions produce a two-phase flow of methanol solution and carbon dioxide gas. Differences in the underlying physics between microscale and macroscale systems, however, provide a new set of challenges for multiphase microscale devices. In thermal management devices, large pressure fluctuations caused by the rapid expansion of vapor are prevalent in the flow channels. In fuel cells, the gaseous carbon dioxide blocks reaction sites. In both of these cases, dry-out is a problem that limits device performance.
We propose a design for a microscale breather that uses surface chemistry and microstructures to separate gas from a liquid flow to improve two-phase microchannel performance. To better understand the physics and governing parameters of the proposed breather, we have designed and fabricated test devices that allow cross-sectional visualization of the breathing events. We have conducted various experiments to examine the effects of device channel hydraulic diameters ranging from 72 μm to 340 μm and liquid inlet flow rates ranging from 0.5 cm/s to 4 cm/s on the maximum gas removal rate. We demonstrated a maximum breather removal rate of 48.1 μl/min through breather ports with a hydraulic diameter of 4.6 μm connected to a
microchannel with a hydraulic diameter of 72 μm, and a liquid inlet flow velocity of 0.5 cm/s. A model was developed that accurately predicts the exponential dependence of the maximum gas removal rate on a non-dimensional ratio of the pressure across the breather ports compared to the pressure drop in the main channel caused by the venting bubble. These results serve as design guidelines to aid in the development of more efficient and sophisticated breathing devices.
The successful implementation of a microchannel with an efficient breather will allow for new technologies with higher heat removal capacities or chemical reaction rates that can be effectively used by industry.
Thesis Supervisor: Evelyn N. Wang
5
Contents
Abstract ... 3 Contents ... 5 Background ... 6 Micro-Electro-Mechanical Systems ... 6 Microfluidics ... 6 Two-Phase Flow ... 7 Thermal Management ... 7Micro Fuel Cells ... 8
Challenges ... 9
The Microfluidic Breather ... 10
Breather Complexities ... 12
Designs for a Microfluidic Breather ... 13
The Downstream Breather ... 14
The Bubble-Pass Breather ... 15
Final Design ... 15
Testing the Breather ... 17
Fabrication Process ... 17
Experimental Setup ... 24
Uncertainties ... 26
Calibrating Flow Regimes ... 27
Results ... 29
The Downstream Breather ... 29
The Bubble-Pass Breather ... 31
Discussion... 44
Directions for the future ... 47
Conclusion ... 49
Acknowledgements ... 50
Bibliography ... 50
Appendix A ... 53
6
Background
Micro-Electro-Mechanical Systems
Richard Feynman, in his 1959 talk titled There’s Plenty of Room at the Bottom, predicted that the technologies of the future would push deeper and deeper into the invisible frontier of the very small [1]. Feynman’s talk proved prophetic; since the speech, the Micro-Electro-Mechanical Systems (MEMS) industry has experienced significant growth as the potential of microscale systems has been revealed. Arrays of millions of MEMS-based micromirrors, on a chip the size of a dime and each
independently addressable and drivable, reflect light to produce the images projected on TV screens or classroom walls [2]. MEMS accelerometers provide the possibility of intuitive motion controls for mobile devices or gaming platforms [3]. MEMS open the doors to sophisticated, low cost devices with myriad applications, all in a single
integrated device with a very small footprint. Indeed, there is plenty of room, and plenty of possibility, at the bottom.
Microfluidics
One subclass of MEMS is microfluidics. Microfluidic devices use fluids in microscale channels to perform a number of tasks. Due to a very high surface area to volume ratio, forces and surface effects ignored or trivialized in macroscale models become dominant in the microscale world, while body forces important in macroscale models lose significance. The Weber number, a non-dimensional ratio examining the importance of fluid inertia compared to surface tension, is often small. The Reynolds number, a ratio between inertial forces and viscous forces, is usually small and is always within the laminar flow regime. Surface tension and viscous forces are of high
importance, while inertial forces play a less dominant role. Gravitational forces can be neglected entirely, as they are usually of little consequence. These effects can be exploited to produce new devices with useful characteristics, such as biological
7
pathogens, all in a disposable handheld platform [4]. It is this fundamental change in the governing physics that makes microfluidics an intriguing and complex field.
Two-Phase Flow
Two-phase flows are a specific subclass of flows used in microfluidic channels where both the gas and liquid phases are present. In some applications, two-phase flows can be leveraged to increase efficiencies and improve performance, such as in thermal management devices. In other applications, two-phase flows are the byproduct, such as in the two-phase flow produced from the chemical reactions in a micro fuel cell.
Thermal Management
The desire for ever increasing processing capacity within the size confines of modern microprocessors has made thermal management a key barrier to the continued development and progress of new processer chips. Original Pentium CPUs required a power dissipation of 30 W/cm2 and achieved this through forced air cooling [5]. Modern chips running in today’s desktops and servers still rely on forced air cooling in conjunction with integrated heat pipes to remove nearly 300 W/cm2, and the
International Roadmap for Semiconductors is anticipating chips that require nearly 500 W/cm2 of power removal in two years [5; 6]. Indeed, the current line of microprocessors from Intel attempts to lower the power density by using multiple processor cores [7]. In addition, the thermal management demands of specialty projects such as space travel applications or military electronics are even more severe, demanding power densities of over 1000 W/cm2 [8]. Cooling technologies such as pool boiling, which has a critical heat flux of 100 W/cm2, and jet impingement will not be able to scale up with this challenge. To help realize the desired performance of future
commercial and military electronics, new and innovative technologies for heat dissipation need to be developed.
Microfluidics provides a potential solution. Forced flow boiling in microchannels allows for extremely high heat removal rates by utilizing the latent heat of vaporization
8
of a liquid. The result is that a significantly lower mass flow rate is needed to cool a chip when compared to forced liquid-phase flow, and a more constant temperature can be maintained across the entirety of the chip [9]. Microfluidics offer significant advantages over macroscale solutions because the high surface area to volume ratios in these devices allows for more efficient heat removal rates at low vapor qualities, which is contrary to results seen in the macroscale case [10-12]. Thermal resistances of less than 0.1 K/W can be achieved using two-phase flows within microchannels and their small footprint makes their use ideal [13].
Micro Fuel Cells
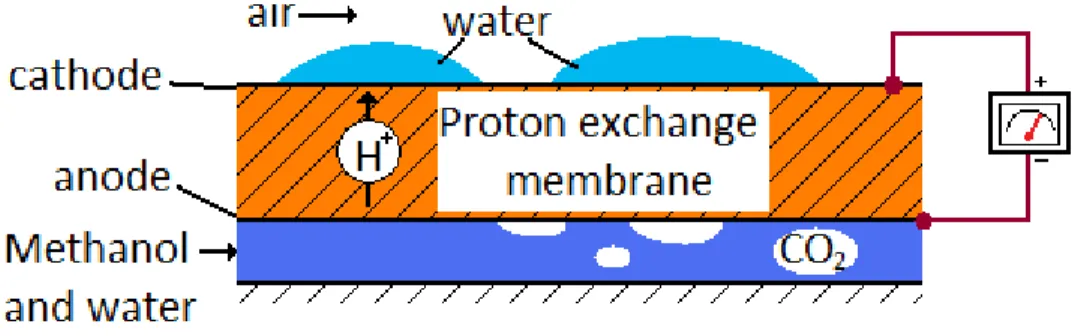
Micro fuel cells are an application of microfluidics where two-phase flows are a byproduct of the device’s function. In the micro direct methanol fuel cell, a methanol solution is used as a fuel source to power a micro fuel cell, as shown in Figure 1.
Figure 1: A micro direct methanol fuel cell.
Through the fuel interaction with the anode of the fuel cell device, hydrogen atoms are split off from the methanol and water molecules in solution via the chemical reaction
CH3OH + H2O → 6e- + 6H+ + CO2. (1)
The six protons, which diffuse across the fuel cell membrane, and six electrons, which pass around a circuit to reach the cathode of the fuel cell, react with air on the cathode to produce water. The carbon dioxide formed at the anode remains in the methanol fuel stream as a gas [14]. In macroscale methanol-based fuel cells, this carbon dioxide can be removed from the fuel stream and managed. When the fuel cell is scaled down
9
and a microchannel is used on the anode side to deliver methanol fuel, however, removal of this carbon dioxide produces a new set of problems.
Challenges
Two-phase flow in microchannels presents additional challenges and hurdles when compared to the macroscale. In microfluidic two-phase flows, the buoyancy and lift forces are insignificant, while surface tension forces can dominate inertial effects. This change in the underlying physics causes differences in observed flow regimes between microscale and macroscale devices.
For example, the regimes associated with boiling in macroscale pipes have been extensively studied and are relatively well understood. As the vapor fraction within the pipe increases, the system moves from bubbly flow to slug flow to an annular or
stratified flow, as shown in Figure 2 [15]. Surface tension forces are insignificant
compared to inertial forces, and buoyancy and lift forces can be used by the designer to stabilize these multiphase flow systems [16].
Figure 2: Flow regimes in a macroscale pipe. As the liquid flows from left to right boiling occurs,
it moves from bubbly flow to slug flow to annular flow.
Figure 3: Flow regimes in a microscale pipe. As the liquid flows from left to right and boils, it
moves quickly from slug flow to annular flow to dry-out.
In microfluidic boiling, the buoyancy and lift forces are insignificant, while surface tension forces can dominate inertial effects. As a result, the flows within these microchannels reach the slug flow regime very quickly, and annular flow and dry-out occur rapidly, as shown in Figure 3 [17]. The bubble expansion is also rapid. This growth causes flow reversals to develop in the channel, and large pressure fluctuations and flow instabilities are prevalent [16-23]. Special constrictors can be integrated into the
10
channel entrance to help control the backflow and reduce the pressure fluctuations, but they increase the overall system pressure drop [24; 25]. Maintaining flow down the channel requires a very large pressure head, and a very high pumping power compared to a liquid-phase case [24; 25].
Similarly, carbon dioxide bubbles formed in the anode microchannel of a micro fuel cell grow to fill the entire channel [14]. The density of the liquid in the channel is orders of magnitude larger than the density of the gas formed. As a result, the gas bubble grows very quickly compared to the volume of liquid consumed. Due to the small diameters of the microchannels, these slugs fill the channels and propagate in both channel directions as they expand, causing a large pressure drop along the channel.
Another challenge that directly impedes the desired operation of two-phase flow microdevices is the loss of liquid to surface contact area. In thermal management devices, the loss of liquid to wall contact means that liquid dry-out has occurred at these portions of the channel. When dry-out occurs, the thermal resistance between the wall and the fluid carrying away the heat increases drastically, and as a result the heat removal capability of the device in these areas drops by orders of magnitude. Over the entire device, the drop in heat removal can be significant, and hot spots can develop on the chip that can damage certain components [17]. In micro fuel cells, the methanol solution must be in contact with the proton exchange membrane for the chemical reaction that generates electricity to occur. As carbon dioxide gas displaces methanol in the microchannel, there is less surface area for the methanol to interact with, and the overall power that the fuel cell can deliver decreases [26].
The Microfluidic Breather
One promising method to resolve these challenges is to prevent dry-out and large pressure drops by removing gas from channels as it forms, while keeping the liquid-phase confined to the channel.
11
Gas can be separated from the liquid flow using a structure consisting of thousands of ports integrated into the walls of a microchannel. Figure 4 and Figure 5 show schematics of how these structures would allow gas to vent from a channel.
Figure 4: Schematic of a microchannel with an
integrated breather and a liquid undergoing boiling. The breather structure allows vapor produced on the heated surface to escape before slugs and dry-out conditions occur.
Figure 5: Schematic of a microchannel in a
methanol micro fuel cell with an integrated breather. The breather structure allows carbon
dioxide produced on the membrane to escape before slugs and dry-out conditions occur. The ports work on the principle of surface tension. When liquid in a channel reaches a breather port on the wall, as shown in Figure 6, the pressure difference across the port is directly related to the liquid surface
tension by the Laplace-Young equation [14] 𝑃𝑖 − 𝑃𝑜 =4 𝜎𝑓cos 𝜙
𝐷 (2)
where Pi is the pressure inside the channel, Po
is the pressure outside the channel, D is the port hydraulic diameter, and σf is the surface
tension of the liquid. When the contact angle, 𝜙, is less than 90 degrees, the surface is hydrophobic and the liquid will remain within
the main channel if the pressure difference Pi – Po, is below a critical value, ΔPmax. The
value of ΔPmax depends upon the hydrophobicity of the breather port surface
∆𝑃𝑚𝑎𝑥 =
4 𝜎𝑓 cos(𝜙𝑚𝑖𝑛)
𝐷 (3)
where 𝜙 min is the minimum contact angle that can be achieved. This value is related to
the dynamic advancing contact angle of the surface, 𝜃, by
𝜙𝑚𝑖𝑛 = 180 − 𝜃 (4)
Figure 6: Liquid interface at a hydrophobic
breathing port. Surface tension forces trap the liquid in the channel when the
12
Therefore, a finite pressure drop can be maintained over the hydrophobic capillary breather port that will allow any gas that reaches the port to escape while containing all liquid within the channel. Only when this pressure drop overcomes the maximum pressure drop, ΔPmax, will liquid leakage through the breather port occur.
A microbreather has been successfully demonstrated by Meng et al., where hydrophobic meshes, made of porous polypropylene with a pore size of 0.2 μm, were integrated into a microchannel device to vent carbon dioxide from a stream of methanol solution [14]. The results showed that large gas slugs in a microchannel, upon reaching the hydrophobic mesh, were successfully expelled from the microchannel after several seconds while the methanol solution remained within the channel. Similarly,
experiments using a microreservoir with 200 μm diameter hydrophobic pits demonstrated that large gas bubbles formed in a flow could be trapped on the hydrophobic pits and vented through breather ports [27]. These studies, however, involved the use of a breather that was integrated downstream of an air injection site, and did not study the feasibility of using a breather structure to vent bubbles near their formation site. With this setup, slugs and dry-out conditions can still form in the
microchannel before the flow reaches the breather structure.
Breather Complexities
The previous work on microscale gas breathers demonstrated excellent breather efficiency, with nearly 100% of the gas in a flow being vented and nearly 100% of the liquid being retained [14]. However, these devices were able to realize these impressive results by allowing large bubbles and slugs to form in the devices themselves, drastically lowering the wetted surface area to total surface area ratio. To maximize the usefulness of a breathing device for two-phase microchannels, the ratio of wetted channel area to total channel area would be ideally near one. Any non-wetted area in the channel detracts from the efficiency of the device, whether it is lost heat removal area in a thermal management system or lost chemical reaction area in a fuel cell system.
Increasing this ratio while maintaining the excellent performance of the breathing structure, however, is not a trivial task. Small bubbles, with diameters less
13
than the diameter of the channel itself, act as deformable particles and tend to move in the flow towards the center of the channel through a phenomenon similar to the Fahraeus-Lindquist effect [16]. If the bubble is entrained in the channel center, it will never interact with breathing structures on the channel walls.
Designs for a Microfluidic Breather
A design must be realized that can successfully remove bubbles that have diameters on the order of the width of the main microfluidic channel. To achieve the most efficient design, it is important to understand fundamentally how the bubble and the breather structure interact. In previous studies, devices were fabricated such that the imaging plane was parallel to the plane of the breather structure, as shown in Figure 7 [14; 27]. As a result, the changing sizes of bubbles, imaged through a transparent breather structure, can clearly be observed as the bubbles vent. The interaction
Figure 7: Experimental setup where the plane
containing the vapor breather is parallel to the imaging plane (flow is into the page). The breathing structure can cover an entire wall of
the main channel.
Figure 8: Experimental setup where the plane
containing the vapor breather is perpendicular to the imaging plane (flow is into the page). The breather ports are situated in the corner
of the channel due to limitations in the fabrication process.
Figure 9: Image produced by the experimental
setup shown in Figure 7 (flow is left to right). This image is taken through the breather structure, and the interaction between the
bubbles and the breather cannot be seen.
Figure 10: Image produced by the
experimental setup shown in Figure 8 (flow is left to right). This image is taken through a
glass cover, and the interaction between bubbles and the breather structure can clearly
14
between the bubble and the breather structure cannot be observed, however, because it occurs in a plane perpendicular to the imaging plane, as shown in Figure 9.
A setup can be realized that allows the breather structure to be in a plane perpendicular to the image plane by fabricating the breather port channels directly into a silicon wafer on the side of a larger microchannel and sealing the channels with a Pyrex wafer, as shown in Figure 8. With this design, imaging of the interaction between the bubble and the breathing structure as the bubble is vented from the channel can be achieved, as shown in Figure 10. This design, however, has the disadvantage that the breather ports are constrained to a corner of the main channel, as shown in Figure 8. This limitation arises because the fabrication process requires that channels be etched into silicon from the top of a wafer down. It is not possible to etch or remove material to create channels in any other direction. However, we designed and fabricated test devices based on the horizontal design shown in Figure 8 to gain a better understanding of the interaction between the bubble and the breather. To help identify the
mechanisms that control the breathing behavior for any microbreather device, we chose to focus on thermal management devices as a representative case. Two different
methods for performing vapor removal on these devices were considered. The Downstream Breather
In the downstream breather design, a hydrophobic pad connected to the breather ports is placed in the main channel
downstream of the bubble nucleation sites, as shown in Figure 11. Flow conditions are controlled such that the bubble diameters at departure are equal to the width of the main channel, W. These bubbles move downstream
in the flow until they reach the hydrophobic pad, at which point the bubble attaches to the wall and is breathed out of the channel through the breathing ports. A channel could be set up with multiple nucleation sites, followed by breather structures, in series.
Figure 11: The downstream breather. W
represents the width of the main channel, and Lb is the distance from the nucleation
15 The Bubble-Pass Breather
In the bubble-pass breather design, the hydrophobic breather structure is placed directly across the channel from the bubble nucleation sites, as shown in Figure 12. The bubble will grow on the nucleation site until its width is equal to the size of the channel, W. At this point, the bubble will come into contact with the hydrophobic breather
structure and will be passed onto the wall across from the nucleation site. The bubble can then be vented from the channel through the breather ports. In this design, the hydrophobic breather structure can be fabricated down the length of the main channel, with nucleation sites fabricated on the opposite side of the channel.
Final Design
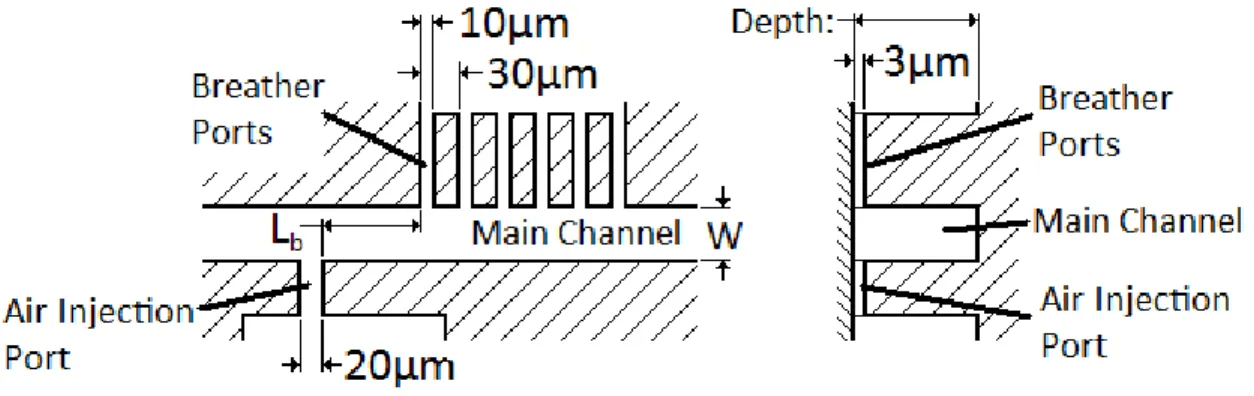
To test these two breather designs, gather data on breather performance, and determine the variables that govern the breathing process, multiple devices with different channel configurations were produced. Figure 13 shows an overall diagram of the devices.
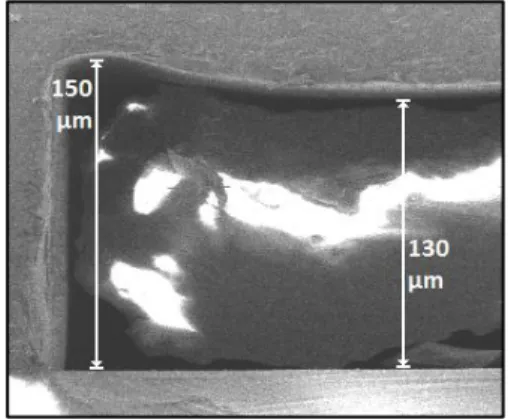
Figure 13: Layout of device, showing relevant dimensions. The depth was 300 μm for the
downstream breather design and 130 μm for the bubble-pass breather.
To simulate bubble growth on a nucleation site under boiling conditions, air was injected into the channels from a small air injection port. The width of this port was chosen to be 20 μm so that the opening into the main channel would be small
Figure 12: The bubble-pass breather.
W represents the width of the main channel.
16
compared to the main channel hydraulic diameter. The depth of the air injection port was chosen to be the same depth as the breather ports in order to simplify device fabrication.
In downstream breather devices, the main channel was designed to be
rectangular. The width (W in Figure 13) and depth were chosen such that a 1 cm/s flow of deionized (DI) water would have a Reynolds number between one and five, while the ratio between the channel width and depth would be near one. The channel depth was chosen to be 300 μm based on this criteria, while the channel width was systematically altered. The distance from the air injection site to the breather ports (Lb in Figure 13)
was also altered between devices. Its value was based on multiples of the channel width. One device was made for each possible combination of the following
parameters: the width, W, was set at 100 μm, 200 μm, 300 μm, and 400 μm, while the distance to the breather, Lb, was set at 400 μm, 600 μm, 800 μm, 1000 μm, 1200 μm,
and 1400 μm.
For the bubble-pass breather design, the main channel was also designed to be rectangular. The design criteria for the channel were changed, however, from the criteria used for the downstream breather to allow bubbles to more easily cross the channel. The width (W in Figure 13) and depth were chosen such that a 1 cm/s flow of DI water would have a Reynolds number near one, while the ratio between the channel width and depth would be near one. The channel depth was chosen to be 130 μm. Devices were made for each of the following channel widths: 50 μm, 100 μm, 150 μm , and 200 μm. The number of breather ports was also altered, with two, four, or six breather ports fabricated into the device. The first breather port on all devices was always at the point in the channel directly across from the air injection site (Lb taken as
zero in Figure 13), and all other ports were placed downstream. Enough devices were produced so that two were made for each combination of channel width and number of breathing ports.
For all the devices, the width and depth of the breather port was minimized in order to maximize the pressure drop the breather port withstands before leaking. The
17
width was chosen to be 10 μm due to limitations in feature size that resulted from using a transparency mask with contact lithography. The depth was chosen to be 3 μm, the smallest value that could be reliably produced using deep reactive-ion etching (DRIE). The pressure drop that the breather port withstands before leaking, ΔPmax, was
calculated using the Laplace-Young equation for a rectangular opening Δ𝑃𝑚𝑎𝑥 = 𝑃𝑖 − 𝑃𝑜 = 2 𝜎𝑓 cos(180 − 𝜃) 1
𝑊𝑏 + 1
𝐻𝑏 (5)
where Wb is the width of the breather
port opening (10 μm), Hb is the height of
the breather port opening (3 μm), σf is the
surface tension of the air-water interface (72.8 dynes/cm), Po is the pressure
outside the channel, Pi is the pressure
inside the channel at the breather, which is approximated as atmospheric pressure, and 𝜃 is the contact angle for water on a
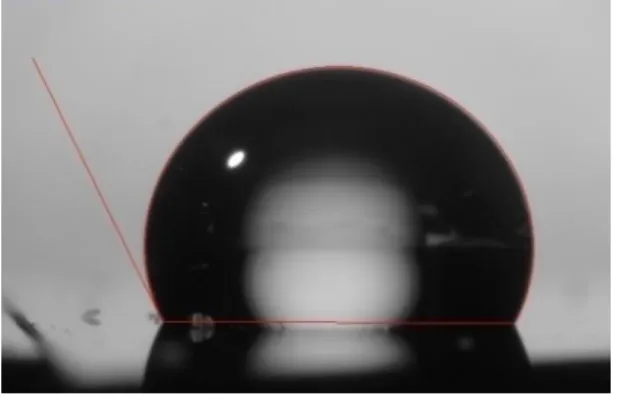
silane covered surface. 𝜃 was estimated by coating a flat silicon wafer in the silane-based self assembling monolayer (SAM) used to create the hydrophobic surface and then measuring the static contact angle on a goniometer. The measurement yielded a contact angle of 116.30°, as shown in Figure 14. Performing the calculation for ΔPmax
using this contact angle yielded a result of 27.95 kPa.
The spacing between the breather channels was chosen to be 20 μm to ensure a solid separation between each breather port.
Testing the Breather
Fabrication Process
The devices were fabricated on six-inch (100) silicon wafers at the Microsystems Technology Laboratories at the Massachusetts Institute of Technology. Each device
Figure 14: Contact angle of water on a flat
silicon surface coated with a silane SAM. The measured contact angle is 116.30°.
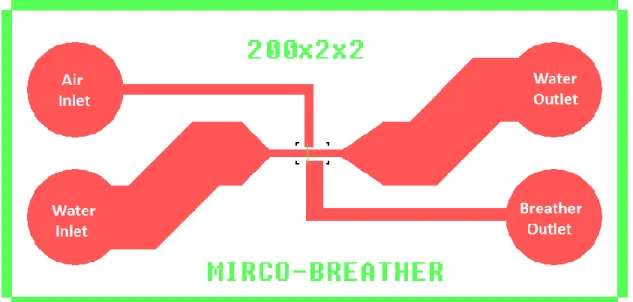
18
used the same inlet and outlet flow design, as shown in Figure 15, and measured 2 cm by 1 cm in size. Each device consisted of four inlet and outlet ports, in each corner of the device. The ports interfaced with holes drilled in the Pyrex cover wafers that were positioned directly on top of the devices. The top left inlet port, as shown in Figure 15, was the air inlet. The bottom right port was the breather outlet. The bottom left port was the liquid inlet, and the top right port was where the liquid exits the device. Figure 16 and Figure 17 show magnified views of the center of the device (the portion of the device contained in the black square window in Figure 15). In this portion, the shallow
Figure 16: Mask layout for downstream
breather (Magnification of window shown in Figure 15). Key dimensions are shown in
Figure 13.
Figure 17: Mask layout for bubble-pass
breather (Magnification of window shown in Figure 15). Key dimensions are shown in
Figure 13.
Figure 15: Device layout. The red portion represents the deep etch features, while the green
19
feature locations and the width of the main deep channel were altered depending upon the device, as described above. Sixty-four devices were fabricated on each silicon wafer, and separate wafers were used for the downstream breather design and the bubble-pass design to allow different recipes to be used for each design. Fabrication was performed in the following sequence (a detailed description of the fabrication process can be found in Appendix A):
1. The silicon wafers were coated in photoresist.
Figure 18: A photoresist coated
silicon wafer.
2. The coated wafers were then exposed and developed to reveal the image of the shallow etch features.
Figure 19: A silicon wafer with the
shallow features exposed and developed.
3. The masked wafers were etched to a depth of 3 μm.
Figure 20: A silicon wafer after the
shallow etch step. 4. The photoresist was stripped from the device.
Figure 21: A silicon wafer after the
20
5. The silicon wafers were again coated in photoresist.
Figure 22: A silicon wafer after the
shallow etch steps, coated in photoresist.
6. The coated wafers were exposed and developed to reveal the image of the deep etch features.
Figure 23: A silicon wafer with the
deep etch features exposed and developed.
7. The masked wafers were etched to a depth of 300 μm for the downstream breather design, and 130 μm for the
bubble-pass breather design.
Figure 24: A silicon wafer after the
deep etch step.
8. A 6-inch Pyrex wafer was coated with photoresist on both sides.
Figure 26: A Pyrex wafer coated in
photoresist.
9. A laser drill was used to etch through-holes in the Pryex.
Figure 27: A Pyrex wafer with holes
drilled by a laser.
Figure 25: SEM of a cross-section of
the main channel in a bubble-pass breather device, a deep feature.
21
10. The excess photoresist was removed from both the silicon wafer and the Pyrex.
Figure 28: An etched silicon wafer
and drilled Pyrex wafer ready for bonding.
11. The Pyrex and silicon were joined using an anodic bonding process.
Figure 29: A completed wafer, after
the silicon and Pyrex wafers are bonded together.
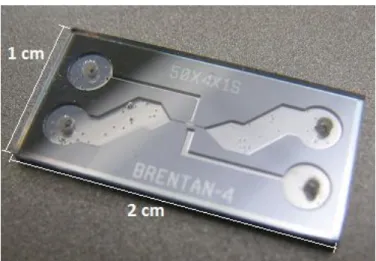
12. The combined wafer was diced into individual devices.
Figure 30: Image of a device after dicing and separation
from the wafer.
The last step in the fabrication process involved depositing a hydrophobic surface inside the main channel around the breather ports while keeping other parts of the main channel, including the air injection port, hydrophilic. This process was
problematic because the sealed channels could not be easily masked to control the hydrophobic deposition. Attempts to deposit a hydrophobic layer before the channels were sealed using either Teflon or a silane-based hydrophobic SAM failed because the
22
majority of the coating was destroyed by the high temperatures and voltages present during the anodic bonding process. These coatings also were less than ideal because the Pyrex cover was not coated with the channel, leaving just three sides of the breather ports hydrophobic.
Multiple methods for performing the deposition in the closed channels were also tried. The silane-based SAM (Tridecafluoro-1,1,2,2-tetrahydrooctyl-1-trichlorosilane, United Chemical Corporation) was vapor deposited in the channels and then high intensity ultraviolet light at 200 nm was used for 48 hours with a mask to try to remove the monolayer from portions of the channel. The ultraviolet light, however, was unable to degrade the silane layer sufficiently, and the entire device was left hydrophobic. Another method that was tried involved injecting the silane-based SAM in its liquid form using a syringe. The flow of the silane could be controlled so that only appropriate sections of the channel interacted with the liquid silane. This method also failed, however, because some silane evaporated in the channels and then deposited on the channel walls where the liquid silane did not touch.
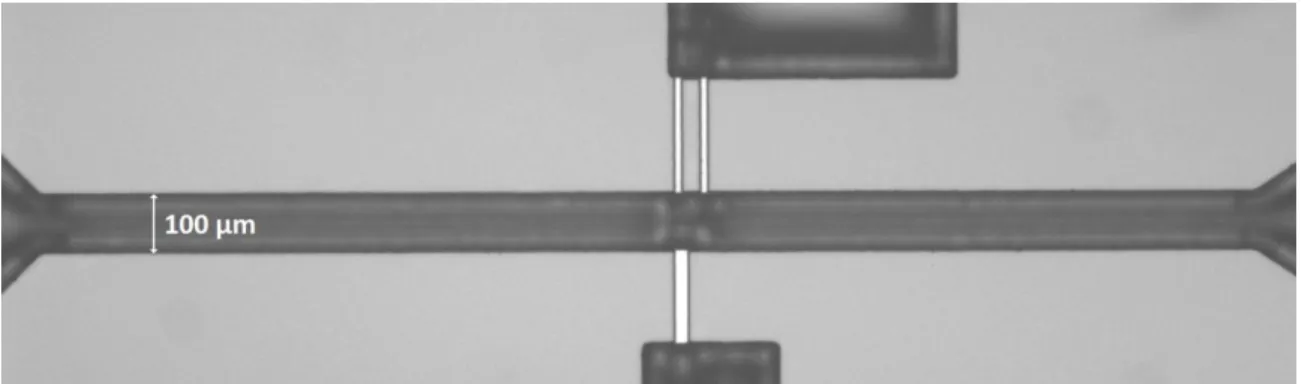
The final method chosen for the hydrophobic deposition involved injecting photoresist into the closed channels to form a mask. Figure 31 shows a downstream breather device with the photoresist mask in place, and Figure 32 shows a bubble-pass device with the photoresist mask in place. Injecting the photoresist mask involved careful use of a 100 μl syringe filled with photoresist, and was difficult to successfully complete on many devices. The masked devices then underwent a silane-based SAM
Figure 31: Image of a downstream breather device just before silane vapor deposition. The
23
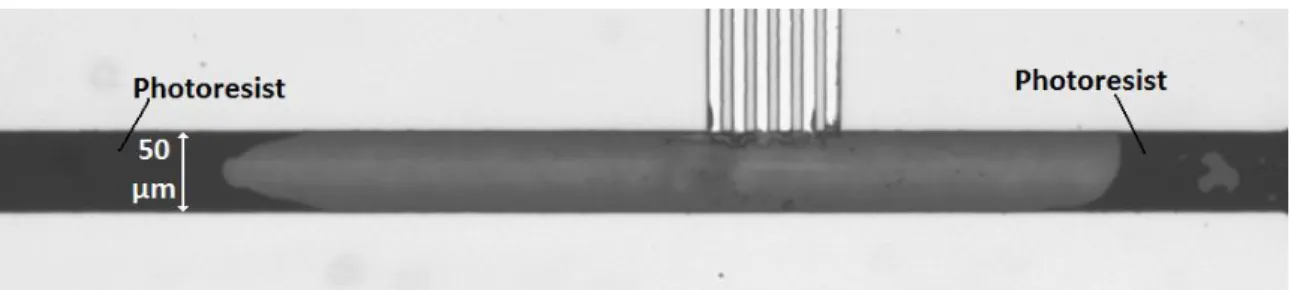
Figure 32: Image of a bubble-pass breather device just before silane vapor deposition. The
injected photoresist used as a mask is visible coating the main channel except around the breather ports.
vapor deposition process, where only exposed silicon and Pryex surfaces were coated in the silane and became hydrophobic. After the deposition, the main channel of the device was flushed with acetone and water to remove the photoresist mask from the device. Early testing showed that this flushing process poisoned or degraded the hydrophobic coating, but the layer was not destroyed completely and the coated sections of the devices still showed mild hydrophobicity after the fabrication process was complete. Figure 33 shows an image of a bubble-pass breather device after fabrication was completed.
24
Experimental Setup
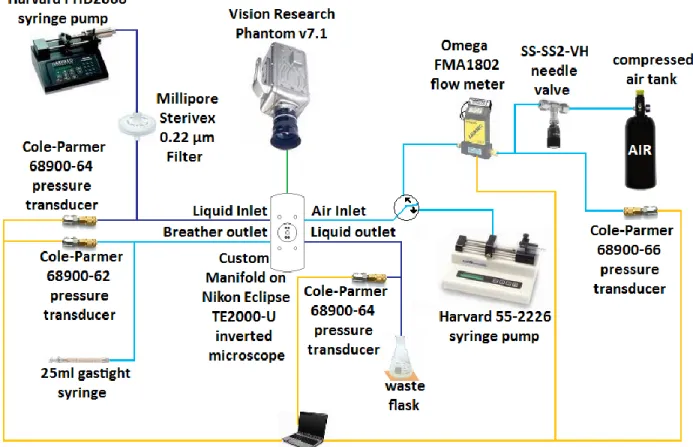
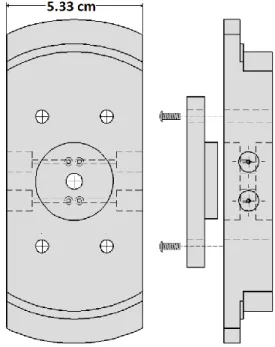
The experimental setup used is depicted in Figure 34. The setup consisted of a custom test fixture, depicted in detail in Figure 35, used to interface the devices with 1/8 inch outer diameter tubing. The test fixture was designed to fit securely in the circular opening on the stage of the inverted white light microscope (Eclipse TE2000-U, Nikon), which was used with a 20X Plan Fluor objective (NA of 0.45) for optical
visualization. The inner portion of the test fixture had four holes, each with O-rings, that interfaced directly with the holes on the top of each device, and a clamp that held the device securely in place, providing a seal against the O-rings. The four ports in the test fixture terminated in a standard female 1/4 inch NPT port with a spot-face for an O-ring. Part SS-400-1-4 (The Swagelok Company) was used to interface the 1/4 inch NPT port with 1/8 inch tubing.
25 A syringe pump (PHD-2000, Harvard Apparatus) was used to provide set inlet liquid flow rates. A high pressure 200 ml syringe was used inside the pump and filled with DI water, and the outlet from this syringe passed through a 0.22 μm particle filter (Sterivex 0.22, Millipore) and was then connected to a pressure transducer (68900-64, Cole-Parmer). The tube was then interfaced with the liquid inlet port on the test fixture.
The liquid outlet port from the test fixture was connected to another pressure transducer (68900-64, Cole-Parmer), and then routed to a flask to collect the waste. The outlet was open to the atmosphere.
The air inlet port from the test
fixture had two connections to it, depending on whether the inlet air flow was set by a constant pressure or a constant flow rate. For the constant pressure side, a gas cylinder with a pressure regulator was connected to a needle valve (SS-SS2-VH, Swagelok), a flow meter (FMA1802, Omega), and finally a pressure transducer (68900-66, Cole-Parmer). The constant flow rate path connected to a 100 μl gas-tight syringe in a syringe pump (55-2226, Harvard Apparatus). Only one of these air sources could be interfaced with the air inlet port on the test fixture at a time.
The breather outlet port was connected to a vacuum transducer (68900-62, Cole-Parmer) and then to a 25 ml syringe, which was used to apply vacuum.
All the flow meters and pressure transducers were connected to a breakout board (SCB-68, National Instruments) for use with a data acquisition card (DAQCard 6036E, National Instruments). LabView software from National Instruments running on a Windows XP laptop was used to interface with the sensors, record measurements, and
Figure 35: The device test fixture. The
device is clamped between the test fixture and a clamping plate and interfaces with four holes in the test fixture that terminate
on the sides of the test fixture in female ¼ inch NPT ports.
26
had the option to trigger the camera. Appendix B contains the code of the LabView interface used.
Imaging was performed at 50,000 frames per second using a high speed camera (Phantom v7.1, Vision Research), attached with a C-mount bracket to the microscope. A separate desktop computer running Vision Research control software was used to record and capture the high speed imagery.
For the experiments, the water injection syringe pump was started and allowed to run for ten minutes at the set inlet flow rate to reach a steady flow condition. For experiments using the air tank for air injection, the tank was then opened and the pressure increased to a set point. For experiments using the air inlet syringe pump to control air injection flow, the pump was started and set at designated air injection rate. For both cases, ten minutes were allowed to pass to ensure steady state flow was reached in the channel. Next, a designated vacuum level was applied to the breather outlet port, and ten minutes were allowed to pass to ensure steady state flow. After this stage, the data from the flow meter and pressure transducers was monitored by the LabView software. When a period of thirty seconds passed during which none of the data streams deviated more than five percent, the camera would be triggered and data taken and recorded. Flow conditions on either the air injection side or the water injection side were then changed, ten minutes were allowed to pass to reach steady state flow, and the data collection process was repeated.
Uncertainties
The uncertainties in the data collection result from multiple sources. The PHD2000 pump used for the liquid inlet flow control has an accuracy of ±1% of the chosen flow rate. The Cole-Parmer 68900-62 pressure transducer used in the breather outlet port has an accuracy of ±1.034 kPa, the 68900-64 pressure transducer used in both the liquid inlet and outlet ports has an accuracy of ±2.068 kPa, and the 68900-66 pressure transducer used on the air inlet port has an accuracy of ±6.894 kPa. The Omega flow meter has an accuracy of ±0.15 sccm. The Harvard 55-2226 pump used for the air inlet flow has an accuracy of ±0.0035% of the chosen flow rate. The
27
compressibility of the gas being pumped, however, means that the setting on the Harvard pump only accurately reflects the flow of air through the inlet port into the main channel at steady state. For these experiments, every effort was made to ensure that the device was in steady state operation before data was taken, however there may be additional uncertainties associated with the air inlet flow data that are difficult to quantify.
Calibrating Flow Regimes
In order to perform experiments for the breather structures, the flow regimes within which the devices could successfully operate were identified. As a bubble grows into the channel from the air inlet port, the flow in the main channel exerts a drag force on the bubble (FD in Figure 36). A force from
the surface tension of the bubble (FS in
Figure 36) counteracts the drag force. As the bubble grows, the drag force increases, and when the drag force overcomes the surface tension force, the bubble detaches from the surface and enters the flow. This process is highly dependent on the liquid flow rate in the main channel, and should not be significantly impacted by the air inlet flow rate for low air flow rates.
The optimum flow regimes for the breather structures occur when the bubble detaches from the air inlet port at a diameter equal to the width of the main channel. Small bubbles will become entrained in the liquid flow and will not be able to interact with the breather structures. Large bubbles will cause channel blockages and dry-out conditions that would serve to lower efficiencies of a final device relying on this breathing process.
To test these flow regimes, multiple downstream breather devices, each with a different main channel width and the same channel depth of 300 μm, were examined
Figure 36: Diagram of a growing bubble.
The strength of the drag force, FD relative to the surface tension force, FS, govern
28
under varying liquid inlet flow conditions. Using high speed imaging, bubble departure sizes were recorded and plotted as a function of the Weber number of the inlet liquid
𝑊𝑒 =𝜌 𝑣
2 𝑊
𝜎 (6)
where ρ is the liquid density, v is the liquid velocity in the channel, W is the channel width, and σ is the surface tension of the air-liquid interface. Figure 37 shows the results of this study, and Figure 38 shows a time-lapse image of a departing bubble.
The data shows that at higher Weber numbers, the departure bubble size is highly dependent on the liquid flow rate, and the data for multiple sized channels collapses onto each other. For lower Weber numbers, the data for different channel sizes diverges as the bubble departure size becomes on the order of the channel width itself. This is to be expected, as when the bubble is near the size of the channel, the flow velocity near the bubble is much higher than away from the bubble, and other effects, like the pressure drop in the channel across the bubble, become important.
Figure 37: Bubble departure size of nucleating bubble as a function of the inlet liquid Weber
number. 0 20 40 60 80 100 120 0.005 0.05 0.5 5
B
ubb
le
Di
ame
ter
(
μm)
H
2O Weber Number
300 200 (chip 1) 200 (chip 2) 100 Channel Width (μm):29
Figure 38: Time-lapse images of bubbles departing from the air injection port (video file
‘bubble_departure.avi’ in reference [28]).
The results suggest that at an inlet Weber number of 0.005 and below, the bubble departure size is on the order of the channel width. Given this result, the experiments were run with the inlet flow Weber number below 0.005.
Results
Early testing of the device revealed that the hydrophobic silane monolayer in the main channels degraded during the acetone cleaning process. As a result, the silane coated surfaces in the channels were less hydrophobic than desired. Tests of the devices under flow conditions in the lab resulted in a leakage pressure around 9 kPa, a value over three times lower than expected. The effective contact angle of the silane monolayer in the channel was calculated using Equation 5 as 98.20° using this measured
ΔPmax.
The Downstream Breather
Attempts to get the downstream breather devices to function properly were unsuccessful. The use of multiple inlet liquid flow rates ranging from 0.1 μl/min to 20 μl/min was attempted along with multiple air inlet flow rates ranging from 0.1 μl/min to 10 μl/min, but no venting was observed through the breathing structure. Although no water leakage was observed through the breather ports, the bubbles that reached the hydrophobic pad (as shown in Figure 11) in the main channel at the breather structure moved with the liquid flow, and the liquid momentum behind the bubbles forced the bubbles to detach and cross the hydrophobic pad before they could adhere
30
to the wall and breathe. Nearly all of the injected air was ejected as slugs down the length of the main channel and did not vent through the breathing structure.
A downstream breather device was then fabricated such that the entire main channel, including the air injection site, was coated with the hydrophobic silane SAM. This setup validated that air in the channel could be selectively removed through the breather ports, as shown in the time-lapse in Figure 39.
Figure 39: Time-lapse of hydrophobic downstream breather venting a wall slug (video file
‘downstream.avi’ in reference [28]).
For this setup, the inlet liquid flow rate was kept very low, at 0.5 μl/min, and the air inlet flow rate was set at a modest 1 μl/min. The breathing behavior was captured by stopping the inlet liquid flow rate and injecting air. The air inlet pump was then turned off and the inlet liquid flow pump turned on. The breathing behavior was then briefly observed.
Although the completely hydrophobic downstream breather device produced a good demonstration of the breather venting an air mass from the channel, this setup would not be useful for a final design and is therefore not useful as a test device. The hydrophobic coating on the channel walls trapped a thin layer of air against the walls. The effect is analogous to an annular flow regime in a tube, except that the fluid in the
31
channel center is liquid and the fluid hugging the channel wall is a gas, as shown in Figure 40. For the applications targeted in this paper,
including cooling and fuel cell applications, a liquid-solid interface is required to improve cooling or fuel cell performance. The loss of this interface in the completely hydrophobic devices makes it unsuitable for these needs. For this reason, no further data was collected for this configuration.
The Bubble-Pass Breather
Breathing was observed in the bubble-pass breather configuration for devices with 50 μm wide channels and four or six breather ports after an artificial vacuum, below the observed leakage barrier of 9 kPa, was applied to the breathing ports. Devices with only two breather ports did not reach a breathing condition because the two breather ports were placed too far upstream. No stable breathing was observed in devices with 100 μm or larger channel widths because the bubble was ejected down the channel before it could attach to the breather and vent. In the devices with a 50 μm width main channel, the system would enter a steady state situation where an air bubble, approximately 120 μm long and 50 μm wide, would attach itself to the breather structure. Bubbles would form at the air injection point and then merge with the slug in the main channel when the bubble grew large enough. As the injected bubbles merged with the slug, a portion of the bubble itself would then vent through the breather ports. Figure 41 shows a time-lapse that is representative of this behavior.
The images in Figure 41 indicate that all the air injected into the channel can be removed through the air breather in the stable state because the slug does not grow in size. This stable state, where 100% of the injected air was removed via the breather ports, is hereto referred to as a successful operation of the breather. Any stable state that allowed air to exit the channel through the liquid outlet port was defined as a non-successful breather operation.
Figure 40: Hydrophobic walls
in a channel produce an annular flow, with gas hugging the walls and liquid
Figure 41: Time-lapse of a bubble-pass breather device venting a vapor bubble. The third breather port from the right in the channel, blocked by
water in the first image, allows some air to escape before closing again in the last image. A bubble from the air injection port can be seen merging with the slug in the 800 μs image. This breather behavior was stable, and this process repeated continuously. (Video file
‘bubblepass.avi’ in reference [28]).
33
The images in Figure 41, however, also show that water entered the breather ports. When breathing behavior was observed, water was always seen to enter the breather ports. Figure 42 shows another time-lapse of a case where a slug reached a new breather port. Prior to the slug reaching a new breather port, the breather port
was free of liquid. However, when the slug reached the new breather port and breathing occurred, liquid entered the breather channel. We speculate that localized pressure fluctuations or surface tension forces acting around the opening to the
breather port may lead to the leakage behavior observed, however further investigation is necessary to examine the cause.
The current experimental setup did not allow the liquid leakage rate through the breather ports to be directly measured. However, an upper bound on the leakage rate was calculated by examining the total amount of water that entered the breather outlet channel after a set period of time. Figure 43 shows an image of the end of the breather ports in contact with the breather outlet channel. The outlet channel was originally empty of water, and the image was taken after five minutes of steady state successful
Figure 42: Time-lapse of water entering bubble-pass breather port after breather
34
breather operation, with an inlet liquid flow rate of 2 μl/min, an inlet air flow rate of 40 μl/min, and a pressure drop across the breather ports of 6.89 kPa. These flow conditions (as will be seen in subsequent data in Figure 44) resulted in the maximum air flow rate through the breather of any combination of flow parameters. These flow settings should also produce the maximum leakage rate through the breather. Based on the depth of the manifold, and assuming that the image in Figure 43 is representative of the amount of water and air in the breather outlet channel at all depths, we can obtain the total volume of water in the channel. Given the experimental duration of five minutes, we obtain that the leakage rate was 2.29 x 10⁻⁴ μl/min. The leakage rate was 0.011% of the inlet liquid flow rate, which suggests that the amount of water leaking through the breather ports is insignificant.
We determined the maximum air removal rate by the breather under successful operating conditions for a device with a 50 μm width and six breather ports. The results of this experiment are shown in Figure 44. In this experiment, the vacuum applied to the breather outlet was gradually increased. With no vacuum applied, no successful breathing occurred in the device. The vacuum was then increased in an effort to increase the maximum air removal rate and data was taken at values of 0.85 kPa, 4.37 kPa, 6.05 kPa, and 7.45 kPa. At vacuum levels above 9 kPa, pressure forces dominated the surface tension forces and leakage was observed through the breather ports independent of the breathing behavior.
Figure 43: Breather outlet channel after five minute of breather operation. The
water visible is used to calculate a conservative liquid leakage rate through the breather.
35
Figure 44: Maximum air removal rate through the breather as a function of liquid inlet flow rate
and vacuum applied to the breather outlet port.
For each vacuum setting, the liquid inlet flow rate was varied to test the effect of the liquid inlet flow rate on breather function. When the liquid inlet flow was turned off, the channel dried out because the injected air formed a slug that moved upstream. Data was taken for flow velocities of 0.513 cm/s, 1.538 cm/s, 2.051 cm/s, and
3.846 cm/s when successful breathing was observed. For liquid inlet flow velocities above 4 cm/s, successful breathing was not observed, because the bubbles were too small at the time of departure.
For each combination of vacuum and liquid inlet flow, the air inlet flow rate was set at 1 μl/min. Ten minutes were allotted to allow the device to reach steady state breather operation. If successful breathing was not observed after the ten minute interval, then the experimental conditions were considered to be outside the set of values for successful breather operation. For conditions where steady successful breathing operation was achieved in the 10 minute period, the air inlet flow rate was increased in 0.1 μl/min intervals every 10 minutes. The maximum air inlet, and
therefore the maximum breather air removal rate, was determined to be the highest air 0 10 20 30 40 50 0 2 4 6 8
Ma
xi
mum
Air
R
emov
al
Ra
te
[μ
l/min
]
Pressure Change Across Breather [kPa]
Water: 0.513 cm/s Water: 1.538 cm/s
36
inlet flow rate that was able to achieve a successful breathing state and maintain the stable state for a 10 minute period.
The pressure change across the breather, Δ𝑃breather , which is plotted in Figure
44, was calculated using
Δ𝑃breather = 𝑃𝑖− 𝑃𝑜 (7)
where Po is defined as the measured absolute pressure in the breather exhaust port,
and Pi is the pressure inside the main channel at the breather port. Pi was determined
by finding the pressure drop down the length of the main channel 𝑃𝑖 = 𝑃𝑎𝑡𝑚 + 𝑓 𝐿
𝐷ℎ 𝜌 𝑣2
2 (8)
where Patm is atmospheric pressure, L is the distance from the breather to point in the
main channel where it opens up into the liquid exit port (750 μm), Dh is the hydraulic
diameter of the main channel (defined as four times the cross sectional area divided by the perimeter, 72.22 μm for the 50 μm wide channel), v is the liquid flow velocity in the main channel, ρ is the liquid density, and f is the friction factor
𝑓 = 64
𝑅𝑒𝐷ℎ (9)
where ReDh is the Reynolds number of the liquid flow in the main channel using the
hydraulic diameter Dh as the characteristic length.
The data shown in Figure 44 follows a clear exponential trend, and the shape of the exponential is governed by the inlet flow rate chosen. It is desirable to graph this data along a non-dimensional x-axis, such that all the data collapses onto a single exponential function, to allow a single fit for the data to be generated. This fit captures the effects of both liquid inlet flow rate and breather port vacuum level on the
maximum air removal rate through the breather, and can be used to design new devices that maximize efficiency. To do this, the pressure forces acting on the air within the bubble attached to the breather in the main channel were considered. When a new bubble from the air injection port merges with this trapped breather bubble, the new volume of air will disturb the equilibrium in the trapped bubble. The drag force, which
37
can be approximated by the pressure drop across the length of the bubble in the main channel, pushes on the bubble to detach from the breather and move down the length of the channel to the liquid outlet port, as shown in Figure 45. The pressure difference between the air in the bubble and the air in the breather outlet port acts to draw this new volume of air out of the bubble in the channel and through the breather port to restore the force balance, as shown in Figure 46.
Figure 45: When the pressure drop across the breather is small compared with the pressure
drop across the bubble, the bubble will be ejected down the channel before excess air can be vented. Arrows represent relative magnitudes of pressure drops.
Figure 46: When the pressure drop across the breather is large compared with the pressure
drop across the bubble, excess air entering the bubble will be vented, and the bubble will return to its equilibrium state. Arrows represent relative magnitudes of pressure drops.
The occurrence of the two different scenarios shown in Figure 45 and Figure 46 is dependent on the relative magnitudes of the pressure drop along the bubble length compared to the pressure drop along the breather ports. When the pressure drop along the breather is large compared with the pressure drop along the bubble length, the added volume of air will vent through the breather port, the force balance will be
38
restored, and the successful steady state breather operation will continue (Figure 46). When the pressure drop along the breather port is small compared with the pressure drop along the bubble length, the instability caused by the added volume of air will detach the bubble from the breather port and the bubble will be ejected out the liquid outlet port; successful breather operation therefore ceases (Figure 45).
This ratio, defined as Rp, can be used as the dimensionless independent variable
with which the maximum air removal rate through the breather can be estimated. The value of Rp can be calculated from the known geometry and known flow conditions of
the system by
𝑅𝑝 ≝
Δ𝑃breather
Δ𝑃bubble (10)
where ΔPbreather is the pressure drop across the breather and is defined in Equation 7. ΔPbubble can be determined by
Δ𝑃bubble = 𝑓𝐿𝑏𝑢𝑏𝑏𝑙𝑒 𝐷ℎ′ 𝜌 𝑣′ 2 2 = 𝐿𝑏𝑢𝑏𝑏𝑙𝑒 64 2 𝜇 𝑣′2 𝐷ℎ′2 (11) where f is the friction factor defined in Equation 9, Lbubble represents the length of the
bubble in the channel (along the flow direction), and μ is the dynamic viscosity of the water. The values Dh’ and v’ are local hydraulic diameter and velocity values. They are
related to the global liquid velocity, v, and to the overall channel hydraulic diameter, Dh,
by 𝐷ℎ′ =4 𝐴′ ℘′ = 4 𝑊 𝐻′ 2𝐻′ + 𝑊 = 2𝐻 + 2𝑊 2𝐻′ + 𝑊 𝐻′ 𝐻 𝐷ℎ (12) 𝑣′ = 𝐻 𝐻′𝑣 (13)
where W is the channel width, H is the channel height, and H’ is the effective local channel height, as shown in Figure 47. H’ is defined as the channel height H minus the penetration depth of the
breathing bubble. Note that the liquid-air interface
Figure 47: Cross section of channel
(flow direction is into the page) showing a bubble attached to a breather in the channel and the local effective channel height, H’.
39
in the channel has a prescribed slip boundary condition, and therefore does not contribute to the wetted perimeter value, ℘′, in the derivation of the local hydraulic diameter, Dh’.
By combining Equations 10, 11, 12, and 13, Rp can be simplified to
𝑅𝑝 = Δ𝑃breather 2 𝐷ℎ2 64 μ 𝑣 𝐻′ 𝐻 3 2𝐻 + 2𝑊 2𝐻′ + 𝑊 2 1 𝐿𝑏𝑢𝑏𝑏𝑙𝑒 (14) The value of Lbubble is a constant that depends on the length of the hydrophobic pad in
the main channel, which was verified from the high speed images. When the average of
Lbubble over a minute or longer is taken, it is shown to indeed be constant. For the device
used in these experiments, the value of Lbubble was 120 μm. The value of H’ could not be
measured in these experiments because the image plane containing the information is perpendicular to the plane imaged with the experimental setup. As a result, Rp cannot
be directly calculated.
However, H’ depends on a known quantity, the liquid inlet velocity v, because the penetration depth of a breather bubble is dependent on the liquid flow velocity. The velocity v can be non-dimensionalized using the liquid inlet Reynolds number ReDh far from the breather port, where ReDh is defined as
𝑅𝑒𝐷ℎ =
ρ 𝑣 𝐷ℎ
μ (15)
where ρ and μ are the liquid water density and dynamic viscosity, respectively. Therefore, we can rewrite Rp in a new form
𝑅𝑝 = Δ𝑃breather 2 𝐷ℎ2 64 μ 𝑣 𝐿𝑏𝑢𝑏𝑏𝑙𝑒 𝐻′ 𝐻 3 2𝐻 + 2𝑊 2𝐻′ + 𝑊 2 (16)
where each term in parenthesis is dimensionless. The first term can be directly calculated from know quantities, including the device geometry and set experimental conditions. The second and third terms are unknown, and each is dependent on ReDh.
40
The dependency of these two unknown dimensionless terms on ReDh can be
found by considering the boundary conditions as 𝑅𝑒𝐷ℎ → 0,
𝐻′
𝐻 → 0 (17a)
and as 𝑅𝑒𝐷ℎ → ∞, 𝐻′𝐻 → 1 (17b) which yields the relationship
𝐻′
𝐻 = 1 −
1 𝑅𝑒𝐷ℎ + 1
𝑝 (18)
where p is an unknown positive exponent.
An expression for H’ derived from Equation 18 can now be inserted into the expression for Rp from Equation 16 to yield
𝑅𝑝 = Δ𝑃breather 2 𝐷ℎ2 64 μ 𝑣 𝐿𝑏𝑢𝑏𝑏𝑙𝑒 1 − 1 𝑅𝑒𝐷ℎ+1 𝑝 3 2𝐻+2𝑊 2𝐻 1− 1 𝑅𝑒 𝐷ℎ +1 𝑝 +𝑊 2 (19)
This equation is still not sufficient to fully solve for Rp. When expanded, Rp
becomes a long and complex polynomial with terms to various powers combining the unknown positive value p. An estimate of p however can be found by fitting the data to an exponential function using the expression for Rp as the independent variable and the
maximum breather removal rate, 𝑉 𝑎𝑖𝑟 ,𝑚𝑎𝑥, as the dependant variable
𝑉 𝑎𝑖𝑟 ,𝑚𝑎𝑥 = 𝐴 𝑒 𝐵 𝑅𝑝 (20)
where A and B are constants found through the least squares regression of the linearized exponential fit equation
ln 𝑉 𝑎𝑖𝑟 ,𝑚𝑎𝑥 = ln 𝐴 + 𝐵 𝑅𝑝 (21) Inserting Equation 19 into Equation 20 yields:
𝑉 𝑎𝑖𝑟 ,𝑚𝑎𝑥 = 𝐴 𝑒 𝐵 Δ𝑃breather 2 𝐷ℎ 2 64 μ 𝑣 𝐿𝑏𝑢𝑏𝑏𝑙𝑒 1− 1 𝑅𝑒 𝐷ℎ +1 𝑝 3 2𝐻+2𝑊 2𝐻 1− 1 𝑅𝑒 𝐷ℎ +1 𝑝 +𝑊 2 (22)
41
To determine p, the square of the correlation coefficient, r2, can be calculated for the least squares fit to the linearized equation. The value of p is then varied until the fit quality is maximized, which occurs when r2 is close to 1.
Performing this operation on the data shown in Figure 44 produces the following fit, correlation coefficient, and p value, which is shown graphically in Figure 48:
𝑉 𝑎𝑖𝑟 ,𝑚𝑎𝑥 = 0.7613 𝑒0.0096 𝑅𝑝, 𝑟2 = 0.8990, 𝑝 = 1.17
To further refine the fit, any outlying data points that are not characteristic of the behavior should be ignored in the least squares fit. These outliers can add significant error to the fit coefficients and reduce the correlation coefficient. To find outliers, the data in Figure 48 was plotted with a logarithmic y-axis, as shown in Figure 49.
Figure 48: Maximum air removal rate compared with the dimensionless pressure ratio Rp. All data is used to produce the shown fit.
0
10
20
30
40
50
0
100
200
300
400
500
Ma
xi
mum
Air
R
emov
al
Ra
te
[μ
l/min]
R
pWater: 0.513 cm/s Water: 1.538 cm/s Water: 2.051 cm/s Water: 3.846 cm/s Fit Line
42
Figure 49: Maximum air removal rate compared with the pressure ratio Rp, plotted with a logarithmic y-axis.
Figure 49 shows that the data point at an Rp value near fifty and a maximum
removal rate of 0.3 is an outlier. This point is over four times smaller than another data point taken at the identical flow settings, which matched more closely to the observed trend line. The remaining data, excluding this single outlier, show a clear exponential trend, which appears linear on the logarithmic y-axis. Performing the same fit while ignoring this outlying data point yielded the following fit, correlation coefficient, and p value, which is shown graphically in Figure 50:
𝑉 𝑎𝑖𝑟 ,𝑚𝑎𝑥 = 1.3126 𝑒0.0076 𝑅𝑝, 𝑟2 = 0.9664, 𝑝 = 1.23
Figure 51 shows the fit and data graphed together with a logarithmic y-axis. The outlier point near an Rp of fifty is shown on the graph, but it is not used in determining
the fit coefficients. Ignoring this point has produced a better fit to the data.
0.1
1
10
100
0
100
200
300
400
500
Ma
xi
mum
Air
R
emov
al
Ra
te
[μ
l/min]
R
pWater: 0.513 cm/s Water: 1.538 cm/s Water: 2.051 cm/s Water: 3.846 cm/s Fit Line
43
Figure 50: Maximum air removal rate compared with the pressure ratio Rp. The fit in this figure ignores the outlier data point near an Rp of 50.
Figure 51: Maximum air removal rate compared with the pressure ratio Rp, drawn with a logarithmic y-axis. The outlier at an Rp of 50 and an air removal rate of 0.3 is ignored in the fit.
0
10
20
30
40
50
0
100
200
300
400
500
Ma
xi
mum
Air
R
emov
al
Ra
te
[μ
l/min]
R
pWater: 0.513 cm/s Water: 1.538 cm/s Water: 2.051 cm/s Water: 3.846 cm/s Fit Line
0.1
1
10
100
0
100
200
300
400
500
Ma
xi
mum
Air
R
emov
al
Ra
te
[μ
l/min]
R
pWater: 0.513 cm/s Water: 1.538 cm/s Water: 2.051 cm/s Water: 3.846 cm/s Fit Line
44
Discussion
The bubble-pass breather design demonstrated stable successful breather operation where 100% of the injected air was removed through the breather ports for channels with a width of 50 μm and either 4 or 6 breather ports. Data on inlet and outlet flow conditions was obtained for a particular device with 6 breather ports.
The data presented in Figure 50 shows that as the ratio Rp grows, the amount of
air that can be removed through the breather port grows exponentially. Rp depends on
a number of parameters in the range where data was obtained:
As v increases, Rp decreases
As the aspect ratio H/W increases, Rp increases
As ΔPbreather increases, Rp increases
The maximum air removal rate from the channel, 𝑉 𝑎𝑖𝑟 ,𝑚𝑎𝑥, is attained when Rp is
maximized. Rp, however, has a finite limit. As the liquid inlet velocity, v, decreases, Rp
increases. However, there is a finite velocity below which a bubble attached to the breather will overcome the pressure imposed by the moving liquid. The bubble will grow in the channel in the upstream direction, causing a dry-out condition.
W can be decreased or H can be increased to increase the aspect ratio H/W,
which will increase Rp as well. Indeed, the testing in these experiments showed that the
channels with larger widths, and therefore smaller aspect ratios, did not reach a steady breathing state. For the channels with a 50 μm width, the channel depth was 130 μm, an aspect ratio of 2.6 to 1. The next largest aspect ratio was found in devices with a width of 100 μm, and an aspect ratio of 1.3:1. The results suggest that for a bubble to be able to attach to the breather structure and vent successfully, water flowing in the main channel must have sufficient room to flow around the bubble without causing a large pressure drop across the bubble itself, i.e., the ratio of H’ to H must remain close to one. For lower aspect ratio channels, the ratio of H’ to H becomes small, and therefore Rp also becomes smaller. Eventually, Rp falls below the critical value where