HAL Id: halshs-00939247
https://halshs.archives-ouvertes.fr/halshs-00939247v2
Preprint submitted on 5 Jun 2015HAL is a multi-disciplinary open access archive for the deposit and dissemination of sci-entific research documents, whether they are pub-lished or not. The documents may come from teaching and research institutions in France or abroad, or from public or private research centers.
L’archive ouverte pluridisciplinaire HAL, est destinée au dépôt et à la diffusion de documents scientifiques de niveau recherche, publiés ou non, émanant des établissements d’enseignement et de recherche français ou étrangers, des laboratoires publics ou privés.
Countries
Félix Badolo, Somlanaré Romuald Kinda
To cite this version:
Félix Badolo, Somlanaré Romuald Kinda. Climatic Variability and Food Security in Developing Countries. 2015. �halshs-00939247v2�
C E N T R E D'E T U D E S E T D E R E C H E R C H E S S U R L E D E V E L O P P E M E N T I N T E R N A T I O N A L
SERIE ETUDES ET DOCUMENTS DU CERDI
Climatic Variability and Food Security in Developing Countries
Félix BADOLO, Romuald KINDA SOMLANAREEtudes et Documents n° 05
January 2014
CERDI
65 BD. F. MITTERRAND
63000 CLERMONT FERRAND - FRANCE TÉL. 0473177400
FAX 0473177428
The authors Félix Badolo
Université d’Auvergne, Centre d’Etudes et de Recherches sur le Développement International (CERDI), CNRS, UMR 6587, F-63009 Clermont Fd, France.
E-mail: [email protected]
Somlanare Romuald Kinda
Université d’Auvergne, Centre d’Etudes et de Recherches sur le Développement International (CERDI), CNRS, UMR 6587, F-63009 Clermont Fd, France.
Email: [email protected] - Corresponding author
La série des Etudes et Documents du CERDI est consultable sur le site :
http://www.cerdi.org/ed
Directeur de la publication : Vianney Dequiedt Directeur de la rédaction : Catherine Araujo Bonjean Responsable d’édition : Annie Cohade
ISSN : 2114 - 7957
Avertissement :
Les commentaires et analyses développés n’engagent que leurs auteurs qui restent seuls responsables des erreurs et insuffisances.
This work was supported by the LABEX IDGM+ (ANR-10-LABX-14-01) within the program “Investissements d’Avenir” operated by the French National Research Agency (ANR)
Abstract
This paper contributes to the existing literature on climatic variability and food security. It analyses the impact of climatic variability on food security for 71 developing countries, from 1960 to 2008. Using two complementary indicators of food security (food supply and proportion of undernourished people), we find that climatic variability reduces the food supply and the proportion of undernourished people in developing countries. The adverse effect is higher for African Sub-Saharan countries than for other developing countries. We also find that the negative effects of climatic variability are exacerbated in the presence of civil conflicts and are high for the countries that are vulnerable to food price shocks.
JEL Codes : D74;Q17; Q18 ; Q54
Keywords: Food Prices Vulnerability; Food security; Climatic variability; Civil conflicts;
We would like to thank comments from our supervisors and participants from African Economic Conference (Kigali, 30 Oct-02 Nov 2012); 2nd International Conference: Environment and Natural Resources Management in Developing and Transition Economies (Clermont-Fd, 17-19, Oct 2012); UNU-WIDER Conference on Climate Change and Development Policy (Helsinki, Finland, 28-29 sept 2012) and 52nd Congress of the Canadian Society of Economics Sciences ( Mont-Tremblant, Canada, 09-11 May 2012).
1. Introduction
According to the United Nations Development Programme (2011), the number of people living under the international poverty line1 has reduced from 1.8 billion to 1.4 billion between 1990 and 2005. These results validate several previous studies (Chen & Ravallion 2010; Milanovic 2012) that report a continued decline in global poverty during the last three decades. These authors show that the proportion of the world’s people living below the international poverty line varied from 52% in 1980 to 25% in 2005. However, progress is currently not fast enough and is different across regions. From 1980 to 2005, the poverty rate in East Asia fell from 80% to 20% and stayed at around 50% in Sub-Saharan Africa. Despite national and international efforts to reduce poverty, the number of people suffering from chronic hunger has risen from 815 million in 1990 to 1,023 million in 2009 (FAO 2009), and a significant proportion of households depend on agriculture. They are more exposed to the risks of food shortages and hunger that could be caused or increased by climatic change (St.Clair & Lynch 2010).
In the recent years, the debate on climatic variability has led to a renewed interest in the effects of climatic variability on agriculture. Many authors have analysed the relationship between climatic variability and the indicators of food security. We can distinguish two strands in the literature. First, several authors develop theoretical arguments or prospective studies which evidence that climatic variability has a negative impact on agricultural production and decreases food availability. Christensen et al. (2007) show that food production is highly vulnerable to the influence of adverse weather. Furthermore, Haile (2005) and Dilley et al. (2005) confirm that recent food crises in Africa which required large-scale external food aid have been attributed either fully or partially to extreme weather events. Ringler et al. (2010) and St.Clair and Lynch (2010) conclude that climatic variability is a factor of childhood malnutrition in Sub-Saharan Africa. Based on Intergovernmental Panel on Climate Change (IPCC)´ climatic projection models, many authors (among others, see Schmidhuber & Tubiello 2007) show that climatic change will negatively affect food security. While the majority of studies are based on theoretical or prospective analyses, the second strand of literature concerns empirical analyses. Using panel data for Asian countries from 1998 to 2007, Lee et al. (2012) show that high temperature and more precipitations in summer increase agricultural production. In the case of Ethiopia, von Braun (1991) concludes that a 10% decrease in the amount of rainfall below the long run average leads to a 4.4% reduction
1
in the food production. There are some reasons that could explain the difficulties of studying the effect of climatic variability on food security at the macroeconomic level. First, the absence of suitable climatic data for many developing countries over a long period may justify the fact that there are few empirical papers. Second, food security is a complex concept that includes several dimensions.
The objective of this paper is to analyse the causal relationship between climatic variability and food security. It differs from the existing literature on climatic variability and food security in two ways. First, while most of the literature is mainly theoretical, we perform an empirical and macroeconomic analysis for 71 developing countries from 1960 to 2008. Second, we identify two mechanisms by which climatic variability may influence food security.
The plan of the paper is as follows. Section 2 contains a discussion of the literature review on the relationship between climatic variability and food security. Section 3 discusses the econometric method used to evaluate the effect of climatic variability on the indicators of food security. Section 4 presents empirical results. The last section is devoted to concluding remarks and implications.
2. Relationship between Climatic Variability and Food Security
The economic literature on the relationship between climatic variability and food security can be presented according to three different approaches: production-based approach, market approach and institutional failures. Before discussing these approaches, we propose to survey the concepts of food security and climatic variability in order to identify accurate indicators. 2.1 Concepts of Food Security and Climatic Variability
2.1.1 Measuring Food Security
Food security is a multidimensional and flexible concept that gained prominence since the World Food Conference in 1974. Many definitions have been put forward (Maxwell 1996). They have shifted from food production and importing capabilities at the macro-level towards a focus on individuals and their ability to avoid hunger and undernutrition (Foster Phillips 1992). Reutlinger (1986) suggests that food security is defined as “access by all people at all times to enough food for an active healthy life”. Among them, the definition by the United Nations Development Programme (UNDP 1994) is widely accepted by the World Bank and nongovernmental organizations. Food security is “a situation that exists when all people at all
times have physical, social and economic access to sufficient, safe and nutritious food that meets their dietary needs and food preferences for an active and healthy life”. This requires not just enough food to go around but necessitates that people have ready access to food, that they have an “entitlement” to food by growing it for themselves, by buying it or by taking advantage of a public food distribution system.
This definition highlights the importance of food security as a basic human right (Dreze & Sen 1991; Sen 1983). Tweeten Luther G. (1997) emphasizes that the concept of food security has three essential dimensions. The first dimension is food availability, which refers to the supply of foodstuffs in a country from production or imports. A “bread basket” of food should be made available for consumption, but nothing is said about how the basket is distributed. The second dimension is food access, which refers to the ability to acquire food for consumption through purchase, production or public assistance. Indeed, food may be available but not necessarily accessible. Contrary to availability that reflects the supply-side, food access focuses on the demand side (Barrett 2010). It takes into account the loss of livelihood producing assets, the incomes of households, the prices of goods and the preferences of households. The third dimension is food utilization, which concerns the physical use of food derived from human distribution. Food may be available to individuals who have access, but health problems may result from the imbalanced diet of food that is consumed.
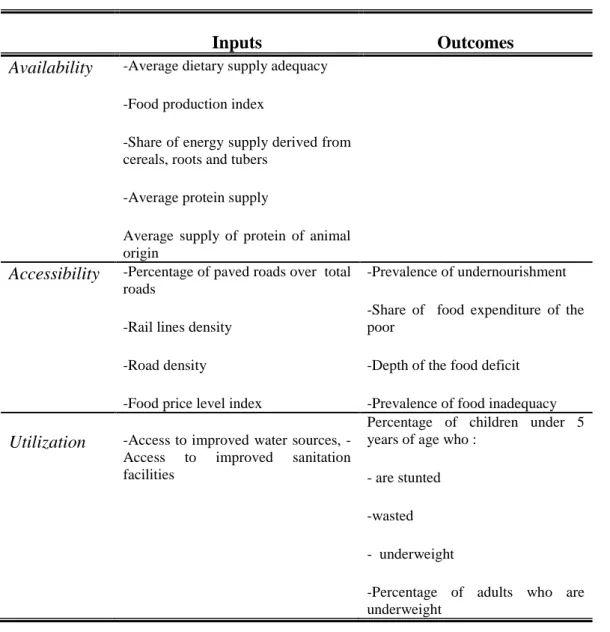
Because it reflects a multidimensional concept, several indicators of food security have been used in the economic literature. We may distinguish input and outcome indicators (Table 1). The input indicators describe “the structural conditions likely to worsen food insecurity whereas outcome indicators describe food consumption i.e. inadequate food consumption or anthropometric failures.
In the early 1970s, food security was mostly considered in terms of national and global food production. The economic literature focuses on food production/supply indicators such as the energy balance per capita, which is measured by the Dietary Energy Supply (DES) and food production. The energy balance is a measure of national food availability that indicates how a country’s food supply meets the energy needs of its population under the hypothesis that food supply is distributed among individuals according to needs.
In the mid 1980s, researchers realized that food insecurity may appear in regions where food may be available but not accessible because of the erosion of people’s entitlements (Sen 1983b). There are many socio economic factors that may influence households’ accessibility to food. Several authors use alternative indicators as such under-five mortality rate, child malnutrition and the proportion of undernourished children. The under-five mortality rate partially reflects the fatal synergy between inadequate dietary intake and unhealthy environments. It gives an idea of the severity of food insecurity. The child malnutrition measures the prevalence of underweight in children under the age of five, indicating the proportion of children suffering from weight loss. The proportion of undernourished, as estimated by the Food and Agriculture Organization (FAO), reflects the share of the population with inadequate dietary energy intake, i.e. the proportion of people who are food energy deficient. However, Wiesmann (2004) shows that the proportion of undernourished and the prevalence of underweight in children are both limited in that they do not reveal premature death, which is the most tragic consequence of hunger and undernutrition. Pelletier et al. (1994) suggest that the same level of child malnutrition in two countries can have quite different effects on the proportion of malnutrition-related deaths among children, depending on the overall level of child mortality. Wiesmann (2004) thinks that this limit of the indicator of child malnutrition is mitigated if they take in account of the under-five mortality rate. Pelletier et al. (1994) conclude that mortality takes into account causes of death other than malnutrition, and that the actual contribution of child malnutrition to mortality is not easy to track because the proximate cause of death is frequently an infectious disease. Furthermore, the indicators of child malnutrition and of infant mortality cover a category of population (children). Recent studies (Wiesmann 2004) refer to the Global Hunger Index (GHI)2 as a measure food insecurity. The GHI is a statistical tool to measure and monitor hunger in the world by country and by region. It captures three dimensions of hunger: i) insufficient availability of food, ii) shortfalls in the nutritional status of children, and iii) premature mortality caused directly or indirectly by undernutrition. The GHI combines the percentage of people who are food energy deficient, which refers to the entire population, with the two indicators that deal with children under five. This index seems to be the best indicator to measure food security. However, this indicator is not available over a long period of time.
2
Table 1: Classification of food security measures
Inputs Outcomes
Availability -Average dietary supply adequacy -Food production index
-Share of energy supply derived from cereals, roots and tubers
-Average protein supply
Average supply of protein of animal origin
Accessibility -Percentage of paved roads over total roads
-Rail lines density -Road density
-Food price level index
-Prevalence of undernourishment -Share of food expenditure of the poor
-Depth of the food deficit -Prevalence of food inadequacy
Utilization Access to improved water sources, -Access to improved sanitation facilities
Percentage of children under 5 years of age who :
- are stunted -wasted - underweight
-Percentage of adults who are underweight
Source: FAO (2013)
Because it is hard to find a single or a global indicator that takes all dimensions of food security into account, we consider two indicators. First, we consider an input measure: food supply. It measures the availability of food in a country through any means (national food production, food imports, etc). To take into account access to food by people, we use the proportion of undernourished people. The proportion of undernourished people is the percentage of people who do not have access to sufficient, safe and nutritious food that meets their dietary needs and food preferences for an active and healthy life. This indicator takes into account the amount of food available per person nationally and the magnitude of inequality in access to food.
2.1.2 Measuring Climatic Variability
According to the Intergovernmental Panel on Climate Change (IPCC), “climate change refers to a change in the state of the climate that can be identified (e.g. using statistical tests) by changes in the mean and/or the variability of its properties, and that persists for an extended period, typically decades or longer”. It refers to any change in climate over time, whether due to natural instability or as a result of human activity. This definition differs from the definition of the United Nations Framework Convention on Climate Change (UNFCCC), where climate change refers to a change of climate that is attributed directly or indirectly to human activity that alters the composition of the global atmosphere and that is in addition to natural climate variability observed over comparable time periods.
Climatic variability can be considered as a component of climate change. According to the IPCC, climatic variability refers to variations in the mean state and other statistics (such as standard deviations, the occurrence of extremes, etc.) of the climate on all temporal and spatial scales beyond that of individual weather events. Variability may be due to natural internal processes within the climate system (internal variability), or to variations in natural or anthropogenic external forcing (external variability).
Measuring climatic variability involves evaluating the gap between the achievements of the climate variable (rainfall or temperature) and its equilibrium value. This equilibrium value refers to the existence of a permanent state or trend. Generally, we measure climatic variability by the standard deviation or the average deviation in absolute value of the distribution of a variable, relative to its mean or to its long-term trend. The standard deviation weights the extreme events more strongly than the average deviation. Other indicators of climatic variability may be the variation coefficient, the kurtosis coefficient and the asymmetry coefficient. The kurtosis coefficient and the asymmetry coefficient (skewness coefficient) are respectively the three-order and four-order moments and obtain information about climatic variability of countries and particularly the frequency of the extreme events. 2.2 What Could Explain Food Insecurity?
In this section, we discuss three approaches highlighting the explanatory factors of food insecurity.
2.2.1 The Production-Based Approach
The production-based approach is derived from the assumption that food insecurity is the result of a decline in food availability. This approach is based on the relationship between population growth and the ability of humans to confront scarcity of food and natural resources, which has dominated the literature on food security (Malthus 1798). Indeed, when a country makes the transition from agriculture to industry, it faces either the industry's environmental effects as well as problems generated by urbanization and demographic change. Malthus (1798) suggests that population expansion follows a geometric progression whereas food supply follows an arithmetic progression, and concludes that population growth outstrips the earth’s ability to provide enough means of subsistence for the population. Neo-Malthusian authors (Ehrlich & Ehrlich 1991; Ophuls & Boyan 1992) conclude that population growth is a threat to food security because it leads to a decrease in food availability. This decrease is intensified by problems of access and utilization of foodstuffs, which are exacerbated by the increasing scarcity. Food availability is at the core of environmentalism and needs to conserve resources. Therefore, sustainable methods of food production and economic development are essential.
On this point, neo-Malthusians argue against “infinite substitutability” of the earth’s resources, emphasizing the limits of adaptation to environmental change but demanding that people modify current patterns of consumption. Some developing countries have difficulty feeding their own population. Indeed, contrary to developed countries where demographic transition is achieved, in developing countries (Africa), population growth rate is high and around 2.5% per year. This high population growth rate may be explained by low mortality rate (due to technical transfer in public health and medical care) and high birth rate. High population growth associated with persistent poverty may negatively affect environmental resources, increase food insecurity and delay demographic transition.
Contrary to neo-Malthusians, several authors believe that technology and human ingenuity have always adequately confronted existing scarcities and will continue to do so in the future. Boserup (1965) shows that developing countries address urbanization problems and population growth by adapting new technologies and strategies of land-use intensification. In addition to technology, some authors take into account political and economic actions in the relationship between population growth and food security. Cohen (2008) thinks that rational political and economic actions as well as utilization of science and technology contribute to
efficiency in food production and distribution systems, thus reducing threats to food security. Tweeten (1997) suggests that effective trade policy and improvement in access to markets will help to limit food insecurity. For example, an increase in agricultural production or a better food distribution via a good transport infrastructure may offset negative effects of population growth by increasing food availability and food access. In conclusion, infrastructures and advances in technology must be adapted to meet the challenges of growing populations and diminishing resources.
2.2.2 The Market-Based Approach
The market-based approach is based on the idea that famine is not due to food supply but due to food access. The concept of entitlements developed by Sen (1983) partly joined this approach. The author suggests that people have an entitlement to food. Entitlement is defined as “the set of all possible combinations of goods and services that a person can obtain using the totality of rights and opportunities”. Entitlements depend mainly on two factors: personal endowments and exchange conditions. The endowments are the combination of all resources legally owned by people, which include both tangible assets (such as land, equipment, animals, etc.) and intangible assets such as knowledge and skill, labour power, membership of a particular community, etc. In developing countries, an important part of a household’s resources comes from labour activities. In other words, people’s endowments are based on the revenues of employment and the possible earnings by selling non-labour assets. Exchange conditions allow people to use their resources to access the set of commodities through trade and production and the determination of relative prices of products or goods. Sen (1983) concludes later that an unfavourable shift in exchange conditions can be the factors of food insecurity. Otherwise, a general shortfall of employment in the economy reduces people’s ability to acquire an adequate amount of food. In other words, a change in relative prices of products or wage rate vis-à-vis food price can cause food insecurity.
In the market-based approach of food security, we also find studies on the relationship between economic performance and food insecurity. A poor economic performance can be a major cause of poverty. A person is considered to be in absolute poverty when s/he is unable to satisfy adequately his/her basic needs such as food, health, water, shelter, primary education and community participation (Frankenberger 1996). The effects of poverty on hunger and undernutrition are pervasive. Poor households and individuals have inadequate resources for care and are unable to achieve food security and to utilize resources for health
on a sustainable basis. In contrast, a sustained economic growth has a positive direct impact on food security by supporting agricultural production and hence food supply.
Wiesmann (2006) suggests that national incomes are central to food security and nutrition because food security, knowledge and caring capacity as well as health environments require a range of goods and services to be produced by the national economy or to be purchased on international markets. Using the Global Hunger Index (GHI) as measure of food security and Gross National Income (GNI) per capita, the author shows that the availability of economic resources at the national level largely determines the extent of hunger and undernutrition. Poor countries tend to have high GHI values.
Smith and Haddad (2000) believe that national income may enhance countries’ health environments and services as well as women’s education by increasing government budgets. It may also boost national food availability by improving the resources available for purchasing food on international markets. The authors emphasize that national income reflects the contribution of food production to overall income generated by households for countries with large agricultural sectors. Smith and Haddad (2000) also suggest that national income may improve women’s relative status directly by freeing up resources for improving women’s lives as well as men’s. They conclude that there is a strong negative relationship between national income and poverty, as shown by recent studies (Easterly 2005; Ravallion 2008). These studies show that economic growth is a necessary condition for poverty reduction. By promoting poverty reduction, economic growth may reduce the constraints on food access for households and is therefore a source of food security.
2.2.3 Institutional Failures
Keen (1994) and Sen (2000) have highlighted the importance of institutions as an explanation of food insecurity. According to these authors, the failure to deliver food can be due to the implementation of inappropriate policies or government’s failure to intervene and the existence of civil conflicts.
Sen (2000) suggests that democracy and political rights can help to prevent famines and other economic disasters. Indeed, authoritarian rulers tend to lack incentives to take timely preventive measures. In contrast, democratic governments have to win elections and face public criticism, and have strong incentives to undertake measures to avert food insecurity and other catastrophes. For example, democracy may provide some empowerment through
voting by the poor to receive human resource investments in health, education and food transfers from government for broad-based development. In the absence of elections, of opposition parties and of scope for uncensored public criticism, authoritarian governments do not have to suffer the political consequences of their failure to prevent food insecurity. However, democracy would spread the penalty of food insecurity to the ruling groups and political leaders. This gives them the political incentive to try to prevent any threatening food insecurity. Sen (2000) also thinks that a free press and the practice of democracy contribute greatly to bringing out information that can have an enormous impact on policies for food insecurity prevention (for example, information about the nature and impact of new production techniques on food supply). The author concludes that a free press and an active political opposition constitute the best early-warning system for a country threatened by famines.
Smith and Haddad (2000) consider that democracy is hypothesized to play a major role in the reduction of food insecurity. According to these authors, a more democratic government affects large revenues in education, health services and income redistribution. This contributes to reduce the problems of food insecurity in the areas affected. Smith and Haddad (2000) also suggest that a more democratic government may be more likely to respond to the needs of all of its citizens, women’s as well as men’s. With respect to food security, the analyses of Dreze and Sen (1991), among others, conclude that democracy is very important in averting food insecurity. More democratic governments may be more likely to honour human rights including the rights to food and nutrition (Haddad & Oshaug 1998) and to encourage community participation (Isham, Narayan, & Pritchett 1995), both of which may be important means for reducing child malnutrition.
Otherwise, other studies (Barnett 2003) have established a relationship between civil conflicts and hunger in developing countries. Indeed, in the countries in conflict, population, households and individuals suffer disruptions in livelihoods, assets, nutrition and health. The Combatants frequently use hunger as a weapon by cutting off food supplies and productive capacities, starving opposing populations into submission, and hijacking food aid intended for civilians. Warfare disrupts markets and destroys crops, livestock, roads and land. Deliberate asset-stripping of households in the conflict regions may cause those households to lose other sources of livelihood as the ongoing conflict leads to breakdowns in production, trade and the social networks. The disruption of markets, schools and infrastructure removes additional
resources required for food production, distribution, safety and household livelihoods. These consequences aggravate food insecurity in the countries in conflict.
Messer et al. (1998) have estimated the extent of food production losses due to conflict by examining trends in war-torn countries of Sub-Saharan Africa during 1970 to 1994 and found that food production was lower in the war years by a mean of 12.3%. This decrease in food production has significant impacts on food availability because in these countries, a majority of the workforce earns their livelihood from agriculture. In addition, in eight of the countries, two-thirds or more of the workforce are engaged in agricultural activities (World Bank 1992). 2.3 How does Climatic Variability Matter for Food Insecurity?
There are several channels through which climatic variability is likely to affect food security in developing countries. To elucidate these channels, we reflect on the effect of climatic shocks on each approach (Figure 1, diagrammatic presentation).
Figure 1: How climatic variability matters for food insecurity – diagrammatic presentation
Source: Authors3
3
We thank Pr Pascale Combes Motel for suggestion. Climate variability Production based approach Agricultural production Market based approach Food prices Household income Economic resources Institutional failures Civil conflicts
2.3.1 Climatic Variability and Agricultural Production
Several authors (Green & Kirkpatrick 1982) have shown that developing countries with a food deficit are characterized by a large fluctuation in agricultural production. Moreover Barrios, Ouattara, and Strobl (2008) consider that climatic change (change in rainfall and temperature at the country level) is a major determinant of agricultural production in Sub-Saharan African. Therefore, one may wonder whether climatic variability is also worth including in determinants of food security in a production-based approach.
Most developing countries are particularly vulnerable to climatic change (especially climatic variability) because their economies are closely linked to climatic sensitive sectors such as agriculture (Mendelsohn et al. 2006). Millions of people in developing countries depend on agricultural production (Table 2). This vulnerability is particularly high in Africa where agricultural production is the primary source of livelihoods for 66% of the total active population (ILO 2007). The World Development Report (World Bank 2002) has established that 39% of people on fragile (arid and semi-arid) lands live in Africa. They are consequently threatened by climate change and climatic variability. Indeed, climatic variability has a negative effect on crop production. For example, higher average temperatures and changing rainfall patterns negatively impact farm yields, reduce household and national food availability and agricultural income. Poor harvests threaten food security. Moreover, rainfall variability contributes to underinvestment and hence to long-run agricultural stagnation and rural poverty in countries that are dependent on rain-fed agriculture (Kydd et al. 2004). This leads to a decrease in food availability and accessibility.
Table 2: Rural Population
Regions Rural Population 1960-2011
East Asia & Pacific 1.07E+09 66.7 Latin America & Caribbean 1.26E+08 33.5 Middle East & North Africa 1.05E+08 48.8
South Asia 2.85E+08 76.5
Sub-Saharan Africa
8E+08 74.1
OECD 3.49E+08 28.4
World 2.8E+09 58.2
Source: World Development Indicators (2012)
2.3.2 Climatic Variability and Households’ Income
Climatic variability has direct and indirect effects on agricultural incomes and thus can harm food security. By reducing households’ agricultural incomes, climatic variability also leads to a decrease in demand for goods and services in the affected communities. This threatens the livelihoods of people who indirectly depend on agriculture, such as traders. Nhemachena et al. (2009) show that rainfall variability and higher average temperatures negatively affect households’ income that comes from agricultural crops and livestock in Africa. Sen (1983b) considers that beyond the agricultural sector, climatic variability adversely affects the labour market in rural areas, thus leading to a decrease in households’ incomes and a decrease in the food basket.
2.3.3 Climatic Variability and Food Prices
Climatic variability impacts food security through its great negative effect on food prices. Because food is a basic necessity good and the demand for food is highly price inelastic, a decrease of food surplus may lead to an important increase in food prices, thus reducing food accessibility. Using a theoretical model, Ringler et al. (2010) find that climatic variability increases childhood malnutrition in Sub-Saharan Africa through higher food prices. Moreover, Aker (2010) considers that climatic variability may have an effect on traders’ entry and exit in response to the profitability of food trading. Indeed, climatic variability leading to
an increase (decrease) in profits may incite the traders to enter (or exit) the local market. As markets are not well integrated and the dispersion of food (agriculture goods, cattle) prices is high in the least developed countries (Aker 2010; Araujo et al. 2005), climatic shocks may amplify them and harm food security.
2.3.4 Climatic Variability and Economic Resources
Climatic variability can impact food security at the macroeconomic level through its effect on economic growth. Dell et al. (2008) and Mendelsohn et al. (2006) show that climatic variability has large and negative effects on economic growth in the poor countries. Moreover, because developing countries have a disproportionate share of their Gross Domestic Product (GDP) in climatic sensitive sectors, their economic resources are vulnerable to climatic shocks. In other words, climatic shocks may reduce the level of output and the economy’s ability for growth (productivity growth) through reduction in agricultural production and exports (Jones & Olken 2010) and investments in research and development. By affecting economic growth, climatic shocks can reduce the resources available to the governments (low tax revenues, for example). This can be a factor that contributes to food insecurity because climatic shocks affect the ability of countries to (1) purchase food on international markets; (2) invest in technology, services and infrastructure that support food and agricultural production and (3) finance public services and investments in health and education.
2.3.5 Climatic Variability and Civil Conflicts
Climatic variability can be a factor of food insecurity by increasing the risk of civil conflicts. Several authors suppose that climatic variability will likely lead to greater scarcity and variability of renewable resources in the long term (Buhaug 2008), as well as increase conflict over limited resources. Moreover, the literature on the determinants of civil war show that economic opportunity is more important that political factors. According to Collier and Hoeffler (1998, 2002, 2006), young men are thought to be more likely to take up arms when income opportunities are worse for them in agriculture or in the formal labour market, relative to their expected income as a fighter. By reducing available natural resources and households’ incomes, climatic shocks reduce opportunity cost of fighting and increase the risk of civil conflicts. Hendrix and Glaser (2007) and Burke et al. (2009) find that climatic shocks (inter-annual variability in rainfall, higher temperatures) are associated with more conflicts. The
exacerbation of the scarcity of resources and the risk of civil war caused by climatic shocks may increase food insecurity.
3. Empirical Analysis
This section presents the method used to analyse the effects of climatic variability on food security. Firstly, we specify the econometric model and then we describe the variables and the data sources.
3.1 Empirical Model
The objective of our paper is to analyse the relationship between climatic variability and food security over the period 1960 to 2008 for 71 developing countries. For this purpose, the following model is specified:
Yi,t =αi +βCVi,t +ωXi,t +γt +εi,t (1)
With X the matrix of control variables, CVi,tis the variable of climatic variability (log) in a country i at the period t and it represents our interest variable. εi,tis the error term,
γ
t represents time fixed effect andα
icountry fixed effects. The data cover the period from 1960 to 2008 and are compiled in five-year averages (1960-1964, 1965-1969…). Yi,tis the food security indicator. Because it is a multidimensional concept, we consider two alternative measures. We focus on food supply (input) and use proportion of undernourished people (output) for robustness checks.Conceptually, the equation (1) is based on studies (Hayami & Ruttan 1970; Lau & Yotopoulos 1989; Zhao, Hitzhusen, & Chern 1991) using meta-production function for food. For robustness checks (proportion of undernourished people), our empirical model followed the economic literature on malnutrition (Smith & Haddad 2000). Our control variables are determinants of food security (Table 3) and are related to a production-based approach, a market-based approach and institutional failures.
Table 3: Classification of variables related to food security Production based approach Market based approach Institutional failures
Main variables Population growth Income per capita (log), Food price shocks vulnerability
Democratic
institutions, conflicts
Complementary control variables
Arable land (log), Cereal production land (log)
Real effective exchange rate (log)
Source: Authors
We identify the potential heterogeneities in the relationship between climatic variability and food security. We are interested in two types of heterogeneities.
First, we test if the effects of climatic variability can be different depending on whether the country was under conflict (equation 2). Indeed, in countries under conflict (Barnett 2003), the population suffers disruptions in livelihoods, assets, nutrition and health. Warfare disrupts markets and destroys crops, livestock, roads and land. Deliberate asset-stripping of households in the conflict regions may cause those households to lose other sources of livelihood as the ongoing conflict leads to breakdowns in production, trade and the social networks. Climatic shocks may aggravate food insecurity in the countries under conflict. Moreover, climatic variability increases food insecurity through the risk of civil conflicts. By exacerbating the scarcity of resources and the risk of civil war (Burke et al. 2009; Hendrix & Glaser 2007), climatic shocks may increase food insecurity.
Second, we analyse the impact of climatic variability on food security in the context of food price shock vulnerability (equation 3).
t i t t i t i t i t i t i i t i CV CV Conflict Conflict X Y, =α + β , + β1 , * , +θ , +ω , +γ +ε , (2) t i t t i t i t i t i t i i t i CV CV PSVul PSVul X Y, =α + β , + β2 , * , +θ1 , +ω , +γ +ε , (3) t i
Conflict, is the conflict variable and PSVuli,tis the vulnerability of countries to food price shocks. The equations 1 to 3 of our model are estimated with the ordinary least squares
method (OLS). This estimator is, however, biased as a consequence of unobserved heterogeneity of countries. We hypothesize that the latter is either addressed by fixed effect (FE) and / or random effect (RE) estimators.
3.2 Data Sources and Description of Variables
The data used in this study cover the period from 1960 to 2008 for 71 developing countries. The data on population growth, income per capita and proportion of undernourished people are from World Development Indicators (2011). Those on democratic institutions, civil conflicts, rainfall and food supply come respectively from Polity IV (2010), Center for Systemic Peace (2010), Guillaumont and Simonet (2011) and Food and Agriculture Organization (2011).
Income per capita is measured by GDP per capita, which is in constant US dollars. Population growth is the annual growth rate of the population. We use the index of polity 2 to appreciate the degree of democracy in a country. The indicator of democracy is characterized by the effective existence of institutional rules and the presence of institutions enabling citizens to express their expectations and choose political elites. The autocracy is characterized by the absence or the restriction of political competition, economic planning and control. The exercise of the power is slightly constrained by institutions and the leaders are only selected within a “political elite”. Civil conflicts are defined as the magnitude score of episodes of civil warfare involving the country.
3.2.1 Food Security
Regarding the food security indicators, we use food supply and proportion of undernourished people because the global hunger index, which is currently considered the best indicator of food security, is not available over the long period of time. The proportion of undernourished people is the percentage of people who do not have access to sufficient, safe and nutritious food that meets their dietary needs and food preferences for an active and healthy life. This indicator takes into account the amount of food available per person nationally and the magnitude of inequality in access to food. Food supply is from the Food Balance Sheets produced by FAO for every country, which gives the quantity of food available for human consumption. For each primary commodity and a number of processed commodities potentially available for human consumption, food balance sheets show the sources of supply and their utilization. The total quantity of foodstuffs produced in a country
added to the total quantity imported and adjusted to any change in stocks that may have occurred since the beginning of the reference period gives the supply available during that period. On the utilization side, a distinction is made between the quantities exported, fed to livestock, used for seed, processed for food use and non-food use, lost during storage and transportation, and food supplies available for human consumption. The per capita food supply of each food item available for human consumption is then obtained by dividing the quantity of the food items concerned by the population actually partaking of it. In other words, food supply is calculated as the difference between, on the one hand, production, the trade balance (imports – exports) and any change in stocks, and on the other hand, all utilizations other than human consumption (seed, livestock feed, etc.). In our paper, we selected the main cereals (maize, rice, sorghum, millet and wheat), soybeans and sugar for the calculation of food supply. These commodities represent an important proportion in the population’s food in most of developing countries. Food supply obtained is a simple average of food supplies of selected commodities expressed in kcal/person/year.
3.2.2 Climatic Variability
Climatic variability is measured by rainfall variability. It is the standard deviation of the growth rate of rainfall, which is frequently used in the economic literature. Rainfall variability is defined as the five-year rolling standard deviation of the growth rate of rainfall series. We perform robustness tests using an alternative indicator and measure of climatic variability. First, we use the average deviation in absolute value of the distribution of rainfall relative to its mean or to its long-term trend (1960-2008). Second, we also perform the impact of asymmetric shocks and extreme variability of rainfall on food security using the four-order moment of rainfall. Third, we check the robustness of estimates by using another database (Mitchell et al. 2004).
3.2.3 Food Price Shocks Vulnerability
We construct the variable of vulnerability to food price shocks using the procedure developed by De Janvry and Sadoulet (2008a) and Combes et al. (2012). According to these authors, countries are vulnerable to food price shocks if they meet the following three criteria: (1) high food dependency, (2) a high food import burden and (3) low income.
High food dependency, measured by the share of total food imports in the total household consumption, highlights the importance of food in the basket of goods consumed by the
representative household in a given country. A large share of food items in the basket means that the household will be hit by an increase in food prices. High food import burden, measured by the ratio of food imports to total imports, emphasizes the strong dependency of a country on the food imports. Level of income, measured by GDP per capita stresses the capacity of a country to constitute food safety nets for domestic consumers. To calculate the vulnerability index, we use the principal component analysis (PCA) applied to three variables: the ratio of food imports to total household consumption, the ratio of total imports to total imports of goods and services and the inverse of the level of GDP per capita. We use the inverse of the level of GDP per capita to be sure that the level of development is negatively correlated with the degree of vulnerability to food price shocks. We normalize the vulnerability index so that it ranges between 0 and 10, with higher values corresponding to high levels of vulnerability. The variables used to calculate the vulnerability index are from World Development Indicators (2011).
4. Results
4.1 Results of Baseline Equation
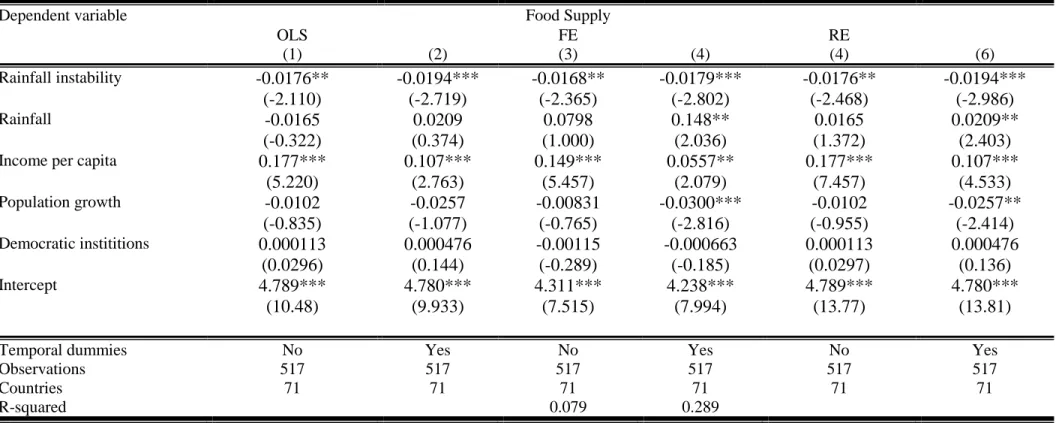
Table 4 shows the results of the effects of rainfall variability on food insecurity with different econometric methods: ordinary least squared (OLS), fixed effects (FE) and random effects (RE). The results of the OLS method are in the columns (1) and (2) and they do not take into account the unobserved heterogeneity of countries. This justifies the fact that we apply fixed effects (columns 3 and 4) and random effect (columns 5 and 6) estimators. The Hausman test shows that the fixed effect model is more appropriate than the random effect model.
Income per capita has a positive effect on food supply. Our results are similar to previous studies (Smith and Haddad 2000). Indeed, the economic resource availabilities increase the capacity of countries to meet the food needs through an increase in national production and/or import foods. The population size reduces food supply. This result is similar to Malthus’ (1992) intuition that population growth can reduce food supply through a high pressure on agricultural resources and a negative effect on agricultural productivity. Democracy seems to have no effect on food supply. This surprising result may be explained by the fact that democratic institutions may be correlated with economic development that influences food supply. According to Smith and Haddad (2000), the more democratic a country, the greater the part of the resources that may be spent on agricultural investments and food supply.
Rainfall variability has a negative and significant effect on food supply. These results can be explained by several arguments. Firstly, changing rainfall patterns is a source of high uncertainty with regards to food production. This increases fluctuations in agricultural production and reduces households’ incomes. For countries that depend on the weather conditions (rain-fed agriculture) for agriculture production, rainfall variability has a negative effect on food production and availability. Second, by reducing agriculture production in developing countries, rainfall variability reduces agricultural incomes and hence negatively affects economic growth (Dell, Jones, & Olken 2008). These countries have a limited ability to purchase food in international markets (food import). In other words, rainfall volatility can reduce the national food supply (food production and import) and increase food insecurity.
Table 4: Impacts of rainfall variability on food supply
Dependent variable Food Supply
OLS (1) (2) FE (3) (4) RE (4) (6) Rainfall instability -0.0176** -0.0194*** -0.0168** -0.0179*** -0.0176** -0.0194*** (-2.110) (-2.719) (-2.365) (-2.802) (-2.468) (-2.986) Rainfall -0.0165 0.0209 0.0798 0.148** 0.0165 0.0209** (-0.322) (0.374) (1.000) (2.036) (1.372) (2.403)
Income per capita 0.177*** 0.107*** 0.149*** 0.0557** 0.177*** 0.107***
(5.220) (2.763) (5.457) (2.079) (7.457) (4.533) Population growth -0.0102 -0.0257 -0.00831 -0.0300*** -0.0102 -0.0257** (-0.835) (-1.077) (-0.765) (-2.816) (-0.955) (-2.414) Democratic instititions 0.000113 0.000476 -0.00115 -0.000663 0.000113 0.000476 (0.0296) (0.144) (-0.289) (-0.185) (0.0297) (0.136) Intercept 4.789*** 4.780*** 4.311*** 4.238*** 4.789*** 4.780*** (10.48) (9.933) (7.515) (7.994) (13.77) (13.81) Temporal dummies Observations No 517 Yes 517 No 517 Yes 517 No 517 Yes 517 Countries 71 71 71 71 71 71 R-squared 0.079 0.289
Table 5: Impacts of rainfall variability on food supply: adding control variables Dependent variable (1) (2) Food Supply (3) (4) (5) Rainfall instability -0.0179*** -0.0167*** -0.0140** -0.0180*** -0.0196** (-2.802) (-2.899) (-2.308) (-2.814) (-1.976) Rainfall 0.148** 0.122** 0.118* 0.236 0.110 (2.036) (2.443) (1.702) (0.833) (0.909) Income per capita 0.0557** 0.0688*** 0.0785*** 0.0555** 0.0233 (2.079) (2.827) (3.060) (2.069) (0.579) Population growth -0.0300*** -0.0165* -0.0237** -0.0299*** -0.0547**
(-2.816) (-1.694) (-2.339) (-2.808) (-2.241) Democratic institutions -0.000663 -0.00200 -0.000159 -0.000665 0.000497
(-0.185) (-0.617) (-0.0467) (-0.185) (0.0940) Cereal production land 0.259***
(9.772)
Arable land 0.269***
(6.983)
Rainfall squared -0.00755
(-0.321)
Exchange rate (REER) -0.0242
(-1.449) Intercept 4.238*** 0.796 3.754*** 3.999*** 4.826*** (7.994) (1.335) (7.391) (4.370) (5.606) Observations Countries 517 71 517 71 517 71 517 71 517 71 R-squared 0.289 0.417 0.361 0.289 0.299
Note: t-statistics are presented in parentheses under the estimated coefficients. ***, ** and * indicate significance of the estimated coefficient at 1, 5 and 10%, respectively. The study period is 1960-2008
The next step consists of adding other control variables to check the robustness of results to changes in the baseline model: cereal production land, arable land, squared term of rainfall level and real effective exchange rate. The results of Table 5 show that rainfall variability has a negative effect on food supply. The coefficient associated with rainfall variability is negative and significant. However, the results obtained for cereal production land (column 2) and for arable land (column 3) are positive and significant. Thus, a policy allowing better land use increases food production and supply. The real effective exchange rate has no effect on food supply. We include the squared term of rainfall level to test a non-linear relationship between rainfall level and food supply because we suppose that too much rainfall may reduce food supply. The results show that rainfall squared has a positive but not a significant effect on food supply.
4.2 Heterogeneity on the Impact of Climatic Variability
In this section, we identify the potential heterogeneities in the relationship between climatic variability and food security. First, we test to determine if the impact of climatic variability can be different depending on whether the country was under conflict. Second, we analyse the impact of climatic variability on food security in the context of food price shock vulnerability.
4.2.1 The Importance of Civil Conflicts
We suppose that the impact of climatic variability on food security is high for countries that are in conflict. We test this hypothesis by adding to our estimations the variable of civil conflicts and an interactive term (rainfall variability*civil conflicts). The results of Table 6 show that civil conflicts have negative effect on food supply (column 2). Indeed, civil conflicts can negatively affect harvests and reduce active population in the agricultural sector because the armed leaders can recruit farmers by offering them high incomes. This leads to a decrease in food availability through the collapse of agricultural production.
We also find that the impact of rainfall variability on food supply is more important for the countries in conflict (column 3). A characteristic of civil conflicts is its negative effect on market access, political and social networks. First, civil conflicts destroy infrastructure, social services, assets and livelihoods, social cohesion, institutions and norms, and they displace populations and create fear and distrust. In addition, civil conflicts disrupt the farming systems (irrigation schemes) and production (crop production, livestock production and off-farm activities) operated by households. Second, market disruption increases difficulties with regards to households going to market to sell and buy goods, and this leads to a loss of earnings. Third, civil conflicts have negative effects on economic growth by reducing investments and economic infrastructures. This can considerably reduce government’s revenues (e.g. tax revenue) and significantly weaken its ability to “invest in people”, for instance to provide better nutrition and on-the-job training that would lead to improved living conditions. These effects can be factors of the poverty trap (Kremer & Miguel 2007), increasing vulnerability and food insecurity.
Climatic variability is likely to increase this vulnerability and dampen livelihoods of households affected by civil conflicts. Indeed, the destruction of assets caused by civil conflicts, as well as unstable economic, social and political environments, will significantly
impact the ability of countries to confront climatic variability. In other words, the effects of climatic variability on food supply are more severe in the countries under conflict.
Table 6: impact of climatic variability on food security: importance of civil conflicts
Dependent variable (1) Food supply (2) (3) Rainfall instability -0.0179*** -0.0177*** -0.0269** (-2.802) (-2.795) (-2.343) Rainfall 0.148** 0.133* 0.149** (2.036) (1.842) (2.021)
Rainfall volatility * Civil conflicts -0.0181**
(-2.250)
Civil conflicts -0.397*** -0.355**
(-2.853) (-2.519)
Income per capita 0.0557** 0.0688** 0.0563**
(2.079) (2.549) (2.041) Population growth -0.0300*** -0.0263** -0.0299*** (-2.816) (-2.469) (-2.789) Democratic institutions -0.000663 -0.00114 -0.000681 (-0.185) (-0.319) (-0.190) Intercept 4.238*** 4.815*** 4.228*** (7.994) (8.547) (7.932) Observations Countries 517 71 517 71 517 71 R-squared 0.289 0.302 0.307
Note: t-statistics are presented in parentheses under the estimated coefficients. ***, ** and * indicate significance of the estimated coefficient at 1, 5 and 10%, respectively. The study period is 1960-2008
4.2.2 The Importance of Food Price Shocks Vulnerability
In this section, we test the potential effects of climatic variability on food supply in a context of food price shocks vulnerability. Climatic variability can increase the vulnerability of countries to food price shocks. Indeed, climatic variability can affect agricultural productivity and production and hence households’ incomes because income from agriculture represents a large proportion of the total household’s income in developing countries. As households’ incomes are negatively affected by climatic variability, the part of food expenses on total consumption (food dependency) increases. Moreover, by affecting economic growth (Dell et al. 2008), climatic variability can lower the resources’ capacities and increase the
food import burden of countries. Hence the negative effect of climatic variability on food supply can increase the vulnerability of countries to food price shocks.
Table 7 presents the results of the non-linear impact of climatic variability on food supply, depending upon the level of vulnerability of countries to food price shocks. The results indicate that the coefficients associated with the variable of vulnerability to food price shocks and to the interactive term (rainfall variability*price vulnerability) are negative and significant. This result reveals that the negative impact of climatic variability on food supply increases with the level of vulnerability of countries to food price shocks. Countries that are more vulnerable to food price shocks are less able to maintain food supply. These results can be explained by the fact that vulnerable countries have very little policy space and limited fiscal and administrative capacity to organize safety nets to import food and protect their population from climatic shocks (De Janvry & Sadoulet 2008). Indeed, policy instruments available to facilitate food accessibility by increasing agricultural production or food imports are limited or ineffective.
Table 7: impact of climatic variability on food security: vulnerability to food price shocks
Dependent variable (1) Food supply (2) (3) Rainfall instability -0.0179*** -0.0184** -0.0259** (-2.802) (-2.481) (-2.382) Rainfall 0.148** 0.181*** 0.177*** (2.036) (2.704) (2.653)
Income per capita 0.0557** -0.241*** -0.235***
(2.079) (-5.474) (-5.329)
Population growth -0.0300*** -0.0854*** -0.0808***
(-2.816) (-5.580) (-5.215)
Democratic institutions -0.000663 0.00305 0.00260
(-0.185) (0.909) (0.774)
Food Price vulnerability -0.0032*** -0.00300***
(-6.876) (-5.961)
Rainfall volatility * Food Price vulnerability -0.0018**
(-2.371) Intercept 4.238*** 6.179*** 6.162*** (7.994) (11.27) (11.27) Observations Number of countries 517 71 434 69 434 69 R-squared 0.289 0.430 0.435
Note: t-statistics are presented in parentheses under the estimated coefficients. ***, ** and * indicate significance of the estimated coefficient at 1, 5 and 10%, respectively. The study period is 1960-2008
4.3 Robustness Checks
4.3.1 Alternative Indicators of Climatic Variability
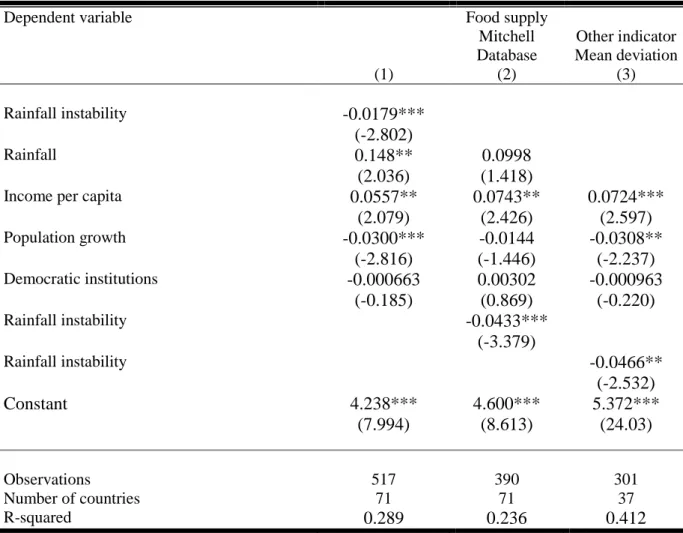
In our previous estimations, we use rainfall variability defined as the standard deviation of the growth rate of rainfall. We check the robustness of our results using alternative measures of climatic variability. Rainfall variability may be defined by the average deviation in absolute value of the distribution of rainfall relative to its mean or to its long-term trend. Moreover, we use another data source on climate. It is the database developed by Mitchell et al. (2004). The results presented in Table 8 reveal that the negative effect of rainfall variability on food supply increases with the level of vulnerability of countries to food price shocks, regardless the variability indicator or the database used.
4.3.2 Inertia of Food Supply
It is also of interest to discover if food supply in developing countries is characterized by inertia phenomena. In other words, we want to know if the lagged level of food supply is a potential determinant of the current level of food supply. We check this by including the lagged level of food supply in our baseline equation. The dynamic nature of the specified model requires system- Generalized Method of Moments (GMM) estimation from Arellano and Bond (1991), Arellano and Bover (1995) and Blundell and Bond (1998). The results in Table 9 show that the lagged level of food supply has no effect on its current level (columns 2 and 3). There is no inertia for food supply in developing countries.
Table 8: Impact of climatic variability on food security: alternative indicator of climatic
variability and another database Dependent variable (1) Food supply Mitchell Database (2) Other indicator Mean deviation (3) Rainfall instability -0.0179*** (-2.802) Rainfall 0.148** 0.0998 (2.036) (1.418)
Income per capita 0.0557** 0.0743** 0.0724***
(2.079) (2.426) (2.597) Population growth -0.0300*** -0.0144 -0.0308** (-2.816) (-1.446) (-2.237) Democratic institutions -0.000663 0.00302 -0.000963 (-0.185) (0.869) (-0.220) Rainfall instability -0.0433*** (-3.379) Rainfall instability -0.0466** (-2.532) Constant 4.238*** (7.994) 4.600*** (8.613) 5.372*** (24.03) Observations Number of countries 517 71 390 71 301 37 R-squared 0.289 0.236 0.412
Note: t-statistics are presented in parentheses under the estimated coefficients. ***, ** and * indicate significance of the estimated coefficient at 1, 5 and 10%, respectively. The study period is 1960-2008
Table 9: Impact of climatic variability on food security: inertia of food supply
Dependent variable Food Supply Fixed effect (1) GMM-system One step (2) GMM-system Two step (3)
Lagged food supply 0.0260 0.0185
(1.330) (0.825)
Rainfall instability -0.0179*** -0.0152*** -0.0124**
(-2.802) (-3.142) (-2.438)
Rainfall 0.148** 0.0133** 0.0335*
(2.036) (2.204) (1.799)
Income per capita 0.0557** 0.0706** 0.0515**
(2.079) (2.065) (2.191) Population growth -0.0300*** -0.0151 -0.0126 (-2.816) (-0.840) (-0.653) Democratic institutions -0.000663 0.00339 0.00362* (-0.185) (1.344) (1.772) Intercept 4.238*** 0.825** 0.962* (7.994) (2.115) (1.867) Observations 511 511 511 R-squared 0.289 Countries AR(1) AR(2) Hansen test Instruments 71 71 0.009 0.16 0.28 52 71 0.007 0.19 0.28 52
Note: t-statistics are presented in parentheses under the estimated coefficients. ***, ** and * indicate significance of the estimated coefficient at 1, 5 and 10%, respectively. The study period is 1960-2008.
4.3.3 Complementary Indicator of Food Security
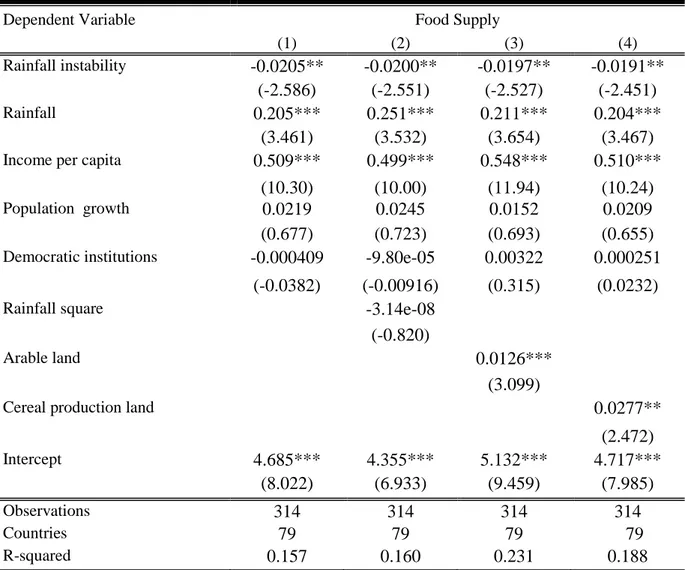
Given that food security is a multidimensional concept, we use another complementary indicator to check the robustness of our results: the proportion of undernourished people. A person is malnourished if his/her average energy intake is less than the minimum necessary to maintain physical and moderate activity. Table 10 presents the results of the impact of climatic variability on the proportion of undernourished people. We find that rainfall variability increases the proportion of undernourished people. The results are strengthened by adding other control variables (rainfall squared, arable land, cereal production land, food prices and food price volatility).
Table 10: Impact of climatic variability on proportion of undernourished people
Dependent Variable Food Supply
(1) (2) (3) (4)
Rainfall instability -0.0205** -0.0200** -0.0197** -0.0191** (-2.586) (-2.551) (-2.527) (-2.451)
Rainfall 0.205*** 0.251*** 0.211*** 0.204***
(3.461) (3.532) (3.654) (3.467)
Income per capita 0.509*** 0.499*** 0.548*** 0.510***
(10.30) (10.00) (11.94) (10.24)
Population growth 0.0219 0.0245 0.0152 0.0209
(0.677) (0.723) (0.693) (0.655) Democratic institutions -0.000409 -9.80e-05 0.00322 0.000251
(-0.0382) (-0.00916) (0.315) (0.0232)
Rainfall square -3.14e-08
(-0.820)
Arable land 0.0126***
(3.099)
Cereal production land 0.0277**
(2.472) Intercept 4.685*** 4.355*** 5.132*** 4.717*** (8.022) (6.933) (9.459) (7.985) Observations 314 314 314 314 Countries 79 79 79 79 R-squared 0.157 0.160 0.231 0.188
Note: t-statistics are presented in parentheses under the estimated coefficients. ***, ** and * indicate significance of the estimated coefficient at 1, 5 and 10%, respectively. The study period is 1960-2008
4.3.4 Heterogeneity for African Countries
We are interested in the effects of climatic variability on food security in the context of Sub-Saharan African countries. Indeed, these countries have two main characteristics: (i) they are more vulnerable to food price shocks because they are net food importers and they are less resilient, and (ii) they are more vulnerable to climatic variability (Guillaumont & Simonet 2011; Wheeler 20114). The predominance of rain-fed agriculture in most of the Sub-Saharan African countries means that food systems are highly sensitive to rainfall variability. Table 11 shows the results of the effect of rainfall variability on food supply in developing
4
countries in general and in Sub-Saharan African countries in particular. The results show that the negative effect of rainfall variability on food supply is higher in Sub-Saharan African countries than in other developing countries (columns 1 and 3). In addition, rainfall has a positive and significant effect on food supply in Sub-Saharan African countries. The adverse effect of rainfall variability on food supply is high in the context of food price vulnerability for Sub-Saharan African countries (column 4).
Table 11: Impact of climatic variability on food security in African Countries
Dependent Variable Food Supply
Developing Countries African Countries
(1) (2) (3) (4)
Rainfall instability -0.0179*** -0.0259** -0.0276*** -0.0363*** (-2.802) (-2.382) (-3.056) (-3.463)
Rainfall 0.148** 0.177*** 0.638*** 0.777***
(2.036) (2.653) (2.969) (2.769)
Income per capita 0.0557** 0.235*** 0.279** 0.308**
(2.079) (5.329) (2.208) (2.321) Population growth -0.0300*** -0.0808*** -0.0236** -0.0525** (-2.816) (-5.215) (-2.456) (-2.417) Democratic institutions -0.000663 0.00260 -0.00826 -0.00581 (-0.185) (0.774) (-1.027) (-0.525) Price vulnerability -0.00300*** -0.00527** (-5.961) (-2.437)
Rainfall volatility * Price vulnerability -0.00018** -0.00032**
(-2.371) (-2.326) Intercept 4.238*** 6.162*** 2.857*** 3.957*** (7.994) (11.27) (6.568) (10.468) Observations 517 434 189 140 Countries 71 69 25 24 R-squared 0.289 0.435 0.468 0.236
Note: t-statistics are presented in parentheses under the estimated coefficients. ***, ** and * indicate significance of the estimated coefficient at 1, 5 and 10%, respectively. Temporal dummies are included. The study period is 1960-2007.
4.3.5 Asymmetric and Extreme Event Effects
Previous estimates were based on analysis of the impact of rainfall variability on food security but are silent about the asymmetric and extreme events effects. However, there are important differences between the effects of positive and negative rainfall variability on food supply. Table 12 presents the results of negative and positive rainfall variability on food