HAL Id: hal-01468060
https://hal.sorbonne-universite.fr/hal-01468060
Submitted on 15 Feb 2017
HAL is a multi-disciplinary open access
archive for the deposit and dissemination of
sci-entific research documents, whether they are
pub-lished or not. The documents may come from
teaching and research institutions in France or
abroad, or from public or private research centers.
L’archive ouverte pluridisciplinaire HAL, est
destinée au dépôt et à la diffusion de documents
scientifiques de niveau recherche, publiés ou non,
émanant des établissements d’enseignement et de
recherche français ou étrangers, des laboratoires
publics ou privés.
Distributed under a Creative Commons Attribution| 4.0 International License
by Low Order Ultrasonic Guided Waves: A Simulation
Study
Ying Li, Dan Liu, Kailiang Xu, Dean Ta, Lawrence H. Le, Weiqi Wang
To cite this version:
Ying Li, Dan Liu, Kailiang Xu, Dean Ta, Lawrence H. Le, et al.. Transverse and Oblique Long Bone
Fracture Evaluation by Low Order Ultrasonic Guided Waves: A Simulation Study. BioMed Research
International , Hindawi Publishing Corporation, 2017, 2017, pp.3083141. �10.1155/2017/3083141�.
�hal-01468060�
Research Article
Transverse and Oblique Long Bone Fracture Evaluation by
Low Order Ultrasonic Guided Waves: A Simulation Study
Ying Li,
1Dan Liu,
1Kailiang Xu,
1,2Dean Ta,
1,3,4Lawrence H. Le,
5and Weiqi Wang
11Department of Electronic Engineering, Fudan University, Shanghai 200433, China
2Laboratoire d’Imagerie Biom´edicale, UPMC Univ Paris 06, INSERM UMR-S 1146, CNRS UMR 7371,
Sorbonne Universit´e, 75006 Paris, France
3State Key Laboratory of ASIC and System, Fudan University, Shanghai 200433, China
4Key Laboratory of Medical Imaging Computing and Computer Assisted Intervention (MICCAI) of Shanghai,
Shanghai 200032, China
5Department of Radiology and Diagnostic Imaging, University of Alberta, Edmonton, AB, Canada
Correspondence should be addressed to Dean Ta; [email protected]
Received 4 October 2016; Accepted 28 November 2016; Published 15 January 2017 Academic Editor: Qing-Hua Huang
Copyright © 2017 Ying Li et al. This is an open access article distributed under the Creative Commons Attribution License, which permits unrestricted use, distribution, and reproduction in any medium, provided the original work is properly cited.
Ultrasonic guided waves have recently been used in fracture evaluation and fracture healing monitoring. An axial transmission technique has been used to quantify the impact of the gap breakage width and fracture angle on the amplitudes of low order guided wave modes𝑆0 and 𝐴0 under a 100 kHz narrowband excitation. In our two dimensional finite-difference time-domain (2D-FDTD) simulation, the long bones are modeled as three layers with a soft tissue overlay and marrow underlay. The simulations of the transversely and obliquely fractured long bones show that the amplitudes of both𝑆0 and 𝐴0 decrease as the gap breakage widens. Fixing the crack width, the increase of the fracture angle relative to the cross section perpendicular to the long axis enhances the amplitude of𝐴0, while the amplitude of 𝑆0 shows a nonmonotonic trend with the decrease of the fracture angle. The amplitude ratio between the𝑆0 and 𝐴0 modes is used to quantitatively evaluate the fracture width and angles. The study suggests that the low order guided wave modes𝑆0 and 𝐴0 have potentials for transverse and oblique bone fracture evaluation and fracture healing monitoring.
1. Introduction
Long bone fractures are typically classified by their shape complexity, locations, such as transverse, oblique, spiral, comminuted, compression, and greenstick fractures, and so forth [1]. Approximately 7.9 million patients sustain fractures in the United States annually, and up to 10% go on to have impaired bone healing, resulting in a delayed union or a nonunion [2]. More than 3 million incident fractures at a cost of $35 billion are predicted for 2025 [3]. Long bone fractures represent one of the most commonly sustained injuries following trauma and account for nearly 4% of emergency department visits in the United States each year [4]. Therefore, fracture diagnosis and subsequent healing
monitoring are vital [5–7]. Although conventional X-ray radiographies are still the most common methods to eval-uate fractures and monitor the subsequent healing process, ultrasonic measurement is emerging as an alternative owing to its advantages of being quick, portable, noninvasive, and inexpensive [4, 8–14]. Especially for pediatric long bone fractures, ultrasound does not necessitate exposing children to ionizing radiation, which has been linked with cancer [4, 15].
Pulse echo ultrasonic imaging showed its advantage in pediatric fracture assessment owing to children’s relative thinner soft tissue compared with that of adults [10]. Li et al. proposed a split-step Fourier echo imaging method to process the signals measured by axial scanning and image the oblique Volume 2017, Article ID 3083141, 10 pages
cracks in the cervine long bone plate, which illustrates the potential of better resolution for ultrasound imaging [16]. However, ultrasonography still cannot detect fractures with a width less than 1 mm [9].
Axial transmission ultrasound has drawn more and more attention recently [17–20]. Two techniques have already been proposed, first arriving signal (FAS) [17, 20–23] and guided wave [19, 24–27]. 2D-FDTD simulations and in vitro experiments on the bovine tibia have been performed, and the results illustrated that both transverse and oblique cracks resulted in the amplitude loss and velocity decrease of FAS [20]. The increase of the fracture angle would impair the sensitivity of the crack width assessment. Further simulation and experimental measurements of bovine femur samples in vitro were performed [21, 28], and the influence of bone mineralization was analyzed. The results showed that the speed of the FAS could reflect the long bone fracture healing stages. An in vitro experiment on the sheep tibia confirmed that the speed of FAS had the capability to detect the long bone fracture healing stages [29]. FAS is found to be relatively low magnitude compared with the subsequently arriving guided waves and is only sensitive to changes in the periosteal regions along the propagating path of the long cortical bone [21].
Ultrasonic guided waves propagate throughout the whole waveguide with great sensitivity to the boundary conditions, such as the endosteal and periosteal regions of the long cortical bone. Previous numerical and experimental studies mainly focus on relatively high frequency [19, 26, 32]. The propagation of guided waves in long bones with different healing stages was analyzed using finite element simulation, and it was found that the cortical fracture significantly affected the propagation of guided waves [19, 26]. However, the serious mode overlap and conversion prevent accurate quantification. Many mode recognition and separation algo-rithms have been proposed, such as the Radon transform [33, 34], wideband dispersion reversal method [35], sparse SVD based mode extraction [36], time-frequency ridge extraction [25], and joint spectrum separation ridge extraction [37]. However, limited by the complexity of clinical measurement, the severe multimode overlap still highly complicates the ultrasonic guided wave based long cortical bone fracture evaluation.
Recently, a narrowband frequency excitation of the low order guided modes was applied to evaluate the fracture of the long cortical bone, which significantly simplifies the mode identification and signal processing [27, 38, 39]. Simulation studies and in vitro experiments demonstrated that only two fundamental modes, 𝑆0 and 𝐴0, can be excited, and the mode conversion between𝑆0 and 𝐴0 is capable of indicating the depth of the diaphyseal cracks [27]. However, in the previous study, only transverse cracks are analyzed in the results. Actually bone fractures are often in irregular shapes and with oblique angles to the axial direction of the long bone. Aiming to investigating the impact of irregularities of cortical fractures, a 2D-FDTD simulation was carried out in this paper. We attempt to quantitatively illustrate the possibilities of using low order guided waves to evaluate the oblique fractures in long bones.
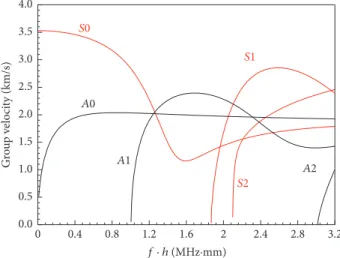
S2 S1 A2 A1 A0 S0 0.4 0.8 1.2 1.6 2 2.4 2.8 3.2 0 f · h (MHz·mm) G ro u p v elo ci ty (km/s) 0.0 0.5 1.0 1.5 2.0 2.5 3.0 3.5 4.0
Figure 1: Group velocity dispersion curves of a free bovine tibia cortical bone plate. The red and black lines are the symmetric and asymmetric Lamb modes, respectively.
2. Methods
2.1. Guided Mode Excitation. Ultrasound propagation
through a waveguide is always accompanied with the mode conversion between shear and longitudinal waves. After multiple refractions and reflections, wave packets with a similar phase will propagate together as a stable guided mode. Guided waves in the plates, also named Lamb waves, can be general grouped as symmetric and antisymmetric modes according to their different vibration features. In a plate, the vibration is constrained to the Rayleigh-Lamb equations [40]: tan(𝑝ℎ/2) tan(𝑞ℎ/2) + (𝑘2− 𝑞2)2 4𝑝𝑞𝑘2 = 0 symmetric tan(𝑝ℎ/2) tan(𝑞ℎ/2) + 4𝑝𝑞𝑘2 (𝑘2− 𝑞2)2 = 0 anti-symmetric 𝑘2= 𝜔2 𝑉𝑝2, 𝑝 2= 𝜔2 𝑉𝐿2, 𝑞 2= 𝜔2 𝑉𝑇2, (1)
whereℎ is the plate thickness and the angular wave number 𝑘 is the ratio between the phase velocity 𝑉𝑝 and angular frequency𝜔. 𝑉𝐿and𝑉𝑇are the bulk longitudinal and shear wave velocities, respectively. The numerical solutions of (1) constitute the dispersion curves which can be expressed as functions of the frequency thickness product𝑓 ⋅ ℎ.
Group velocity dispersion curves of a free cortical bone plate are shown in Figure 1, where the red and black lines are the symmetric and antisymmetric Lamb modes, respectively. The material parameters of cortical bone are given in Table 1. As shown in Figure 1, only two Lamb modes exist at the low frequency thickness (𝑓 ⋅ ℎ) range (<1 MHz⋅mm). On the contrary, at the high 𝑓 ⋅ ℎ range (>1 MHz⋅mm), there exist many high order modes which brings the challenges of mode separation. Thus, simulations are performed on
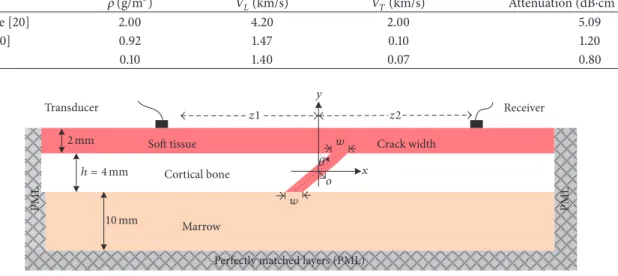
Table 1: Parameters of cortical bone and soft tissue. Tissue 𝜌 (g/m3) 𝑉𝐿(km/s) 𝑉𝑇(km/s) Attenuation (dB⋅cm−1⋅MHz−1) Cortical bone [20] 2.00 4.20 2.00 5.09 Soft tissue [30] 0.92 1.47 0.10 1.20 Marrow [31] 0.10 1.40 0.07 0.80 Receiver Cortical bone
Soft tissue Crack width
Perfectly matched layers (PML)
PML PML Marrow Transducer 2 mm h = 4 mm 𝜃 10 mm z1 z2 o w w y x
Figure 2: Simulation model of obliquely fractured long bone (ℎ = 4 mm) with overlying 2 mm thick soft tissue and underlying 10 mm thick marrow.
the low𝑓 ⋅ ℎ range. Narrowband low frequency sinusoids (5-cycle Gaussian-modulated pulse with a 100 kHz central frequency) are employed in our simulation to merely excite two fundamental guided waves, symmetric mode 𝑆0 and asymmetric mode𝐴0.
2.2. Numerical Simulation and Models. The numerical
sim-ulation of the axial transmission ultrasound in the long bone is performed using a self-developed two-dimension (2D) finite-difference time-domain (FDTD) software that can numerically solve the wave field in the time and space domains [20, 23]. As shown in Figure 2, a model with dimension of 300 mm× 16 mm is used to model the obliquely fractured long bone.
The long bones are built as three layers, 2 mm thick overlaying soft tissue, 4 mm thick cortical bone, and 10 mm thick marrow. The perfectly matched layers (PML) were arranged at the two ends of the model and the beneath the marrow layer to avoid the reflection. A free boundary condition is applied on upper layer of soft tissue. In the middle of the cortical bone layer, a crack is set with a width 𝑤 and fracture angle 𝜃 relative to the 𝑦-axis. The crack width 𝑤 changes from 0 mm (intact) to 1 mm with an interval of 0.125 mm. The fracture angle𝜃 changes from 0∘(vertical) to 83∘. Constrained by the model’s resolution of 0.025 mm, the fracture angle cannot be set continuously. Consequently, the fracture angles are modeled with 0∘, 14∘, 18∘, 26∘, 37∘, 45∘, 53∘, 63∘, 76∘, and 83∘. A pair of transducers are kept in contact with the soft tissue with the incident angle of 0∘. The radius of the transducer is 5 mm. The distance from the transmitter to the central𝑦-axis 𝑧1 is 60 mm, and the distance from the receiver to the central𝑦-axis 𝑧2 is changeable from 30 mm to 90 mm with an interval of 2.5 mm. The material properties used in the simulation are given in Table 1, and the simulation temporal discretization is 0.015𝜇s.
2.3. Data Processing. In this study, a low frequency
narrow-band Gaussian-modulated pulse is used to avoid multimode overlapping. Thus, only two fundamental guided modes,𝑆0 and 𝐴0, are excited in the received guide waves, so that the mode packets can be identified and separated by simple temporal windows [38, 41].
The peak amplitude of the 𝐴0 and 𝑆0 wave packets is obtained to calculate the amplitude ratio between the two modes. The energy characteristics of the𝐴0 mode and 𝑆0 mode are investigated with fracture angles and widths variation.
The propagation delays of these two converted modes can be calculated by (2a) and (2b) [27]. If𝑧1 equals 𝑧2, the wave packets of the two converted modes merge into a mixed wave packet propagating between the original𝑆0 and 𝐴0 modes
𝑇 (𝐴0𝑆0) = 𝑉𝑧1 𝑆0 + 𝑧2 𝑉𝐴0, (2a) 𝑇 (𝑆0𝐴0) = 𝑉𝑧1 𝐴0 + 𝑧2 𝑉𝑆0. (2b)
At 100 kHz, the duration of the 5 cycle excitation Gaussian-modulated pulse is 50𝜇s, and the group velocities of𝑆0 and 𝐴0 are 3.95 km/s and 1.51 km/s, respectively. We measure the peaks of the two wave packets in time domain, which are the maximum amplitudes of the two original modes𝑆0 and 𝐴0 and calculate the amplitude ratio between them for use in evaluating the long bone crack width with different fracture angles.
3. Results
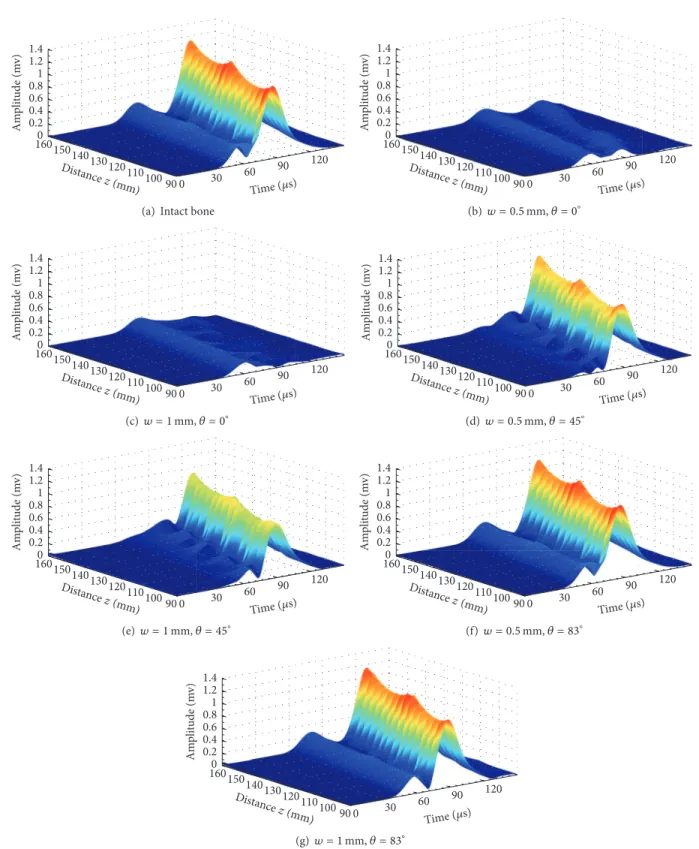
Figure 3 shows the envelope curves extracted from fractured long bones with different fracture degrees and fracture oblique angles. The envelope amplitude is depicted in differ-ent colors with maxima in red and 0 in gray. The propagation
0 30 60 90 120 90 100 110 120 130 140 150 1600 0.2 0.4 0.6 0.8 1 1.2 1.4 Am p li tude (m v) Time (𝜇s) Dist ance z (mm) 30 60 90 120 100 110 120 130 140 150 0 Dist ance
(a) Intact bone
0 30 60 90 120 90 100 110 120 130 140 150 1600 0.2 0.4 0.6 0.8 1 1.2 1.4 Am p li tude (m v) Time (𝜇s) Dist ance z (mm) 30 60 90 120 100 110 120 130 140 150 0 Distance (b) 𝑤 = 0.5 mm, 𝜃 = 0∘ 0 30 60 90 120 90 100 110 120 130 140 150 1600 0.2 0.4 0.6 0.8 1 1.2 1.4 Am p li tude (m v) Time (𝜇s) Dist ance z (mm) 30 60 90 120 100 110 120 130 140 150 0 Distance (c)𝑤 = 1 mm, 𝜃 = 0∘ 0 30 60 90 120 90 100 110 120 130 140 150 1600 0.2 0.4 0.6 0.8 1 1.2 1.4 Am p li tude (m v) Time (𝜇s) Dist ance z (mm) 30 60 90 120 100 110 120 130 140 150 0 Distance (d)𝑤 = 0.5 mm, 𝜃 = 45∘ 0 30 60 90 120 90 100 110 120 130 140 150 1600 0.2 0.4 0.6 0.8 1 1.2 1.4 Am p li tude (m v) Time (𝜇s) Dist ance z (mm) 30 60 90 120 100 110 120 130 140 150 0 Distance (e) 𝑤 = 1 mm, 𝜃 = 45∘ 0 30 60 90 120 90 100 110 120 130 140 150 1600 0.2 0.4 0.6 0.8 1 1.2 1.4 Am p li tude (m v) Time (𝜇s) Dist ance z (mm) 30 60 90 120 100 110 120 130 140 150 0 Distance (f)𝑤 = 0.5 mm, 𝜃 = 83∘ 0 30 60 90 120 90 100 110 120 130 140 150 1600 0.2 0.4 0.6 0.8 1 1.2 1.4 Am p li tude (m v) Time (𝜇s) Dist ance z (mm) 30 60 90 120 100 110 120 130 140 150 0 Distance (g)𝑤 = 1 mm, 𝜃 = 83∘
Figure 3: The envelope diagrams of the received signals (90 mm< 𝑧 < 150 mm) with different fracture degree and oblique angles, (a) intact model, (b) transverse fracture model with 0.5 mm wide crack, (c) transverse fracture model with 1.0 mm wide crack, (d) 45∘oblique fracture model with 0.5 mm wide crack, (e) 45∘oblique fracture model with 1.0 mm wide crack, (f) 83∘oblique fractured model with 0.5 mm wide crack, and (g) 83∘oblique fracture model with 1.0 mm wide crack.
A0 a m p li tude (m v) 𝜃 = 0∘ 𝜃 = 18∘ 𝜃 = 26∘ 𝜃 = 37∘ 𝜃 = 45∘ 𝜃 = 53∘ 0.0 0.2 0.4 0.6 0.8 1.0 1.2 1.4 0.25 0.50 0.75 1.00 0.00 Crack widthw (mm) (a) A0 a m p li tude (m v) w = 0 mm w = 0.125 mm w = 0.25 mm w = 0.5 mm w = 0.75 mm w = 1 mm 0.0 0.2 0.4 0.6 0.8 1.0 1.2 1.4 10 20 30 40 50 60 70 80 90 0 Fracture angle𝜃 (∘) (b) 0 0.25 0.5 0.75 1 0 10 20 30 40 50 60 70 80 90 A0 a m p li tude (m v) Crack width w (mm) Fracture angle 𝜃(∘) 0 0.2 0.4 0.6 0.8 1 1.2 1.4 70 80 (c)
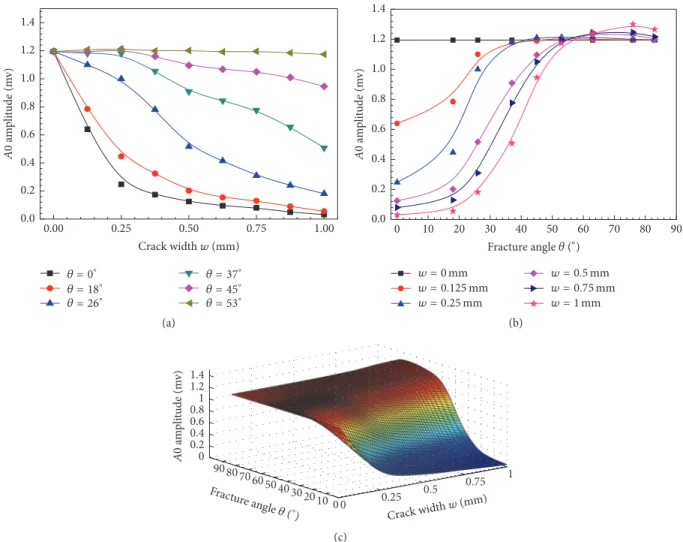
Figure 4: Amplitudes of𝐴0 change as functions of the crack width 𝑤 and the fracture angle 𝜃; (a) with a fixed 𝜃, the 𝐴0 amplitude curves with𝑤 variation; (b) with a fixed 𝑤, the 𝐴0 amplitude curves with 𝜃 variation; and (c) the B-spline fitting results of 𝐴0 amplitude to 𝜃 and 𝑤.
distance𝑧 varies from 90 mm to 150 mm with an interval of 2.5 mm.
Figure 3(a) shows the envelopes of the received wave-forms with two Lamb modes𝑆0 and 𝐴0 in the intact bone. The amplitude of antisymmetric mode𝐴0 is much higher than that of𝑆0, because of the perpendicular incidence and reception angles. No converted modes are observed in this model. However, in Figures 3(b) and 3(c) for transverse fracture with 0.5 mm and 1 mm wide cracks, both the𝑆0 and 𝐴0 amplitudes attenuate significantly. As shown in Figures 3(d) and 3(e), the converted modes can be observed from the results of the 45∘oblique fracture. According to the velocity analysis, the converted modes usually exist between the two original modes𝑆0 and 𝐴0. Furthermore, the peak amplitudes of the conversion modes and original mode are difficult to be extracted due to mode overlapping. For larger fracture angle models in Figures 3(f) and 3(g), it seems that the original mode energy still can transmit through the cracks without obvious appearance of the converted modes. With a fixed fracture angle, the increasing of the crack width may lead to the amplitude reduction of both𝑆0 and 𝐴0, such as in Figures 3(a), 3(b), and 3(c). In Figures 3(b), 3(d), and 3(f), with a
fixed crack width, the increasing fracture angle may lead to the amplitude increasing of transmitted energy of the 𝐴0 mode, but the change of the𝑆0 amplitude is nonmonotonic. To quantitatively illustrate the mode conversion, we further investigate different models with crack and fracture angle variation.
3.1.𝐴0 Mode Amplitude Analysis. Figure 4(a) presents the
𝐴0 amplitude changes as functions of the crack width and fracture angles. The propagation distance𝑧 is fixed at 120 mm. With the crack width increasing, a decrease trend of the𝐴0 amplitude can be observed, which is sensitive to the small crack (𝑤 < 0.25 mm).
The𝐴0 amplitudes decrease more than 95% in the 0∘and 18∘fractures, but they are almost constant as𝑤 increases to large angles (𝜃 > 53∘). Figure 4(b) shows the variation of the𝐴0 amplitude with the fracture angle. The 𝐴0 amplitude obtained from the intact model is set as a benchmark. The𝐴0 amplitude shows three stages in the increase of the fracture angle: a slow increase for small angles (𝜃 < 20∘), a rapid increase for the range of 20∘∼50∘, and a final slow increase for large angles (𝜃 > 50∘). Figure 4(c) shows the𝐴0 amplitude
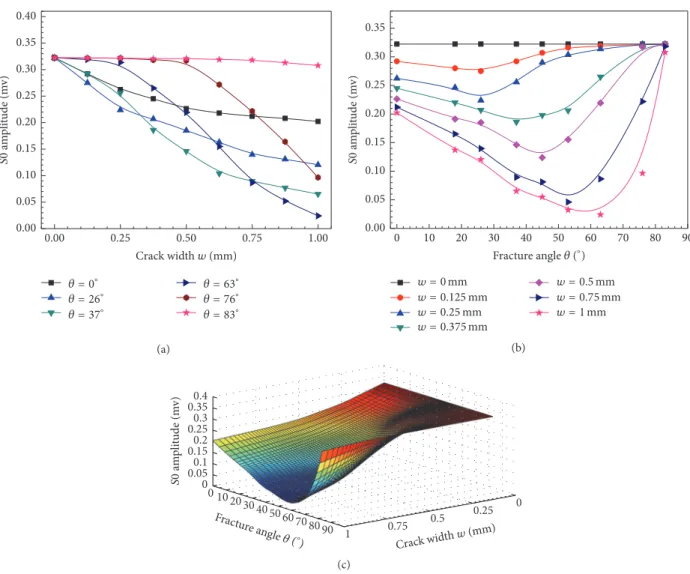
S0 a m p li tude (m v) 0.25 0.50 0.75 1.00 0.00 Crack widthw (mm) 𝜃 = 0∘ 𝜃 = 26∘ 𝜃 = 37∘ 𝜃 = 63∘ 𝜃 = 76∘ 𝜃 = 83∘ 0.00 0.05 0.10 0.15 0.20 0.25 0.30 0.35 0.40 (a) S0 a m p li tude (m v) 10 20 30 40 50 60 70 80 90 0 Fracture angle𝜃 (∘) w = 0 mm w = 0.125 mm w = 0.25 mm w = 0.375 mm w = 0.5 mm w = 0.75 mm w = 1 mm 0.00 0.05 0.10 0.15 0.20 0.25 0.30 0.35 (b) 0 0.25 0.5 0.75 1 0 1020 30 40 5060 70 80 90 Crack width w (mm) Fractur e angle 𝜃(∘) S0 a m p li tude (m v) 0 0.050.1 0.150.2 0.250.3 0.350.4 0 1020 30 (c)
Figure 5: Amplitudes of𝑆0 change as functions of crack width 𝑤 and fracture angle 𝜃; (a) with a fixed 𝜃, the 𝑆0 amplitude curves with 𝑤 variation; (b) with a fixed𝑤, the 𝑆0 amplitudes curves with 𝜃 variation; and (c) the B-spline fitting results of 𝑆0 amplitude to 𝜃 and 𝑤.
changes with the crack width and fracture angle in three dimensions. A B-spline fitting is performed to obtain the smooth amplitude functions. It shows that, comparing with the wide cracks and transverse fractures, the narrow cracks or the large angle oblique cracks can enhance the𝐴0 mode transmission with larger𝐴0 amplitude. The sensitivity of the 𝐴0 amplitude to the crack width and fracture angle shows potentials for fracture evaluation.
3.2. 𝑆0 Mode Amplitude Analysis. Figure 5(a) presents the
𝑆0 amplitude changes as functions of the crack width with different fracture angles. The propagation distance𝑧 is fixed at 120 mm. The 𝑆0 amplitude obtained in an intact model is used as a benchmark. With a fixed fracture angle, the𝑆0 amplitude decreases with the crack widening. As shown in Figure 5(b), with a fixed crack width, the𝑆0 amplitude shows a nonmonotonic trend with the fracture angle variation, and the minimal 𝑆0 amplitude is obtained at the range of 30∘ to 60∘, which is smaller than the amplitude obtained in the model with a transverse fracture. The𝑆0 amplitude decreases
as the fracture angle increases, and then it increases as the fracture angle further increases, ultimately coming close to the value of the intact model at 83∘. Figure 5(c) shows the B-spline fitting results of the𝑆0 amplitude variation with the crack width and fracture angle in three-dimensional form. It can be found that the𝑆0 amplitude generally decreases as the crack width increases, but it also shows a nonmonotonic trend to the fracture angle.
3.3. Impact of Crack Width and Fracture Angle on 𝑆0/𝐴0.
The above results indicate that the𝑆0 and 𝐴0 amplitudes can reflect the𝑤 change of fractured long bones with different angles. However, in actual clinical use, the magnitudes of the guided modes are easily affected by many factors such as the coupling conditions and excitation energy. Thus, the amplitude ratio between𝑆0 and 𝐴0 can be adopted as a more robust parameter.
To investigate the impact of the propagation distance, the average amplitude ratios are computed from the multichannel signals (90< 𝑧 < 150 mm with an interval of 2.5 mm). Figures
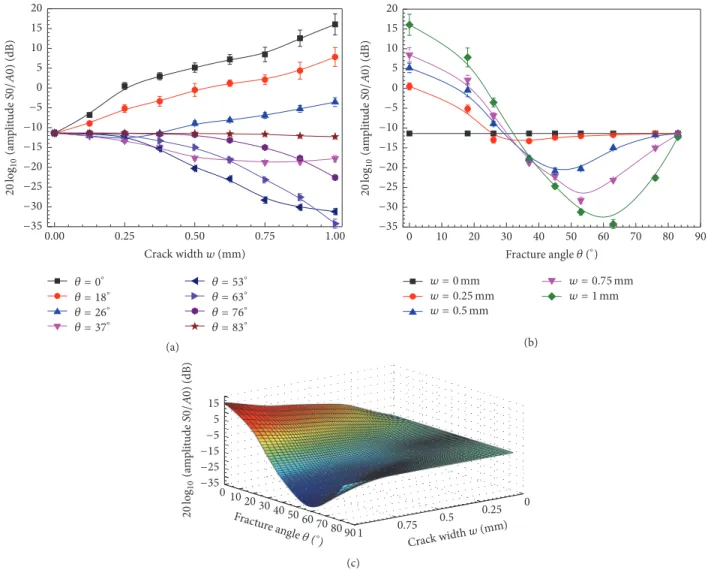
0.25 0.50 0.75 1.00 0.00 Crack widthw (mm) 𝜃 = 0∘ 𝜃 = 18∘ 𝜃 = 26∘ 𝜃 = 37∘ 𝜃 = 63∘ 𝜃 = 53∘ 𝜃 = 76∘ 𝜃 = 83∘ −35 −30 −25 −20 −15 −10 −5 0 5 10 15 20 log 20 10 (a m p li tude S0/ A 0) (dB) (a) 10 20 30 40 50 60 70 80 90 0 Fracture angle𝜃 (∘) w = 0 mm w = 0.25 mm w = 0.5 mm w = 0.75 mm w = 1 mm −35 −30 −25 −20 −15 −10 −5 0 5 10 15 20 log 20 10 (a m p li tude S0/ A 0) (dB) (b) 0 0.25 0.5 0.75 1 0 10 20 30 40 50 60 70 80 90 −35 −25 −15−5 5 15 log 20 10 (a m p li tude S0/ A 0) (dB) Crack width w (mm) Fracture angle 𝜃 (∘) 0 25 0 10 20 3040 (c)
Figure 6: Amplitude ratios (dB) between𝑆0 and 𝐴0 varying as functions of crack width 𝑤 and fracture angle 𝜃; (a) with a fixed 𝜃, the amplitude ratio (dB) changes with𝑤, where the error bars denote the standard errors for results obtained at different propagation distances 𝑧 (90< 𝑧 < 150 mm); (b) with a fixed crack width 𝑤, the amplitude ratio (dB) changes with 𝜃, where the error bars denote the standard errors for results obtained at different propagation distances𝑧 (90 < 𝑧 < 150 mm); and (c) distance 𝑧 = 120 mm, the B-spline fitting results of the amplitude ratios (dB) varying with fracture angle𝜃 and crack width 𝑤.
6(a) and 6(b) present the amplitude ratio changes with the variance of𝑤 and 𝜃, respectively, where the error bar denotes the root mean square errors (RMSE) of the ratios obtained at different propagation distances for each fractured model.
As shown in Figure 6(a), for small angles (𝜃 < 26∘), the amplitude ratio increases with𝑤. Comparing with the intact model, the amplitude ratios between the 𝑆0 and 𝐴0 modes in the fracture bone increase by values of 27.4 dB and 7.8 dB for 0∘and 26∘, respectively. However, for large angles (𝜃 > 26∘), the amplitude ratio decreases with the crack width by an average of 12.4 dB. Comparing to the intact model, with the oblique fracture angles of 53∘ and 63∘, amplitude ratios between the𝑆0 and 𝐴0 modes decrease by 19.8 dB and 22.9 dB, respectively.
Figure 6(b) presents the amplitude ratio of 𝑆0 and 𝐴0 varying with the fracture angle. It can be seen that the amplitude ratio curves first decrease as the fracture angle increases and then increase with angle increases. For 0.25 mm
and 1 mm wide cracks, the turning points are approximately 35∘and 60∘. It can be found that, with a wide crack, the turn points of the amplitude ratio curves appear out with large angle.
The results reveal that the propagation distance has a small impact on the amplitude ratio with an average RSME of 0.78 dB. Furthermore, it is notable in Figures 6(a) and 6(b) that the largest RMSE of the amplitude ratio between the 𝑆0 and 𝐴0 modes can be obtained in the fractured bones with a small oblique angles (0∘, 26∘, and 37∘) and large crack widths (𝑤 > 0.5 mm). For other fracture angles (𝜃 > 26∘), the average RSME of the amplitude ratio between the 𝑆0 and𝐴0 modes is 0.46 dB. The small RSME reveals that the propagation distance variation between 60 mm and 150 mm has a small impact on the amplitude ratio parameter.
Figure 6(c) is the B-spline fitting result of the amplitude ratio parameter varying with the fracture angle𝜃 and crack width𝑤 at a 120 mm distance. As shown in Figure 5(a), the
line cross actually indicates that, in the oblique fractured bone model, with the crack widening the decline slopes of the𝑆0 amplitude curves are different. The decline slope corresponding to the 63∘fracture is more negative than those of other angles. Such a phenomenon also can be learned from the amplitude ratios curves between the𝑆0 and 𝐴0 modes in Figure 6(c). It can be seen that the amplitude ratio may be able to indicate the oblique angle and the crack width of the bone fractures.
4. Discussion
This study presents a quantitative investigation of using low order guided wave modes to evaluate long bone fractures with oblique fracture angles. A 2D-FDTD simulation is performed in a three-layer model. Using a 100 kHz narrowband excita-tion, only two guided wave modes,𝑆0 and 𝐴0, are excited. The impact of the crack width and fracture angle on the𝑆0 and 𝐴0 amplitudes is thoroughly studied. The crack width increase leads to amplitude decreases for both the 𝐴0 and 𝑆0 modes (Figures 4(a) and 5(a)). The 𝐴0 amplitude shows a monotonic relationship with the fracture angle (Figure 4(b)), while the𝑆0 amplitude shows a nonmonotonic relationship (Figure 5(b)). Although only simulation is performed in this study, the simulation results yielded interesting findings, including the use of the amplitude ratio to evaluate the crack width and fracture angle (Figures 6(a) and 6(b)). These findings illustrate the potential of guided mode conversion for the quantitative prediction of the cortical bone fracture degree and healing status.
To reduce the influence of the coupling and excitation, the amplitude ratio between𝑆0 and 𝐴0 is adopted to evaluate the long bone fracture degree. The amplitude ratio shows a two-stage change with the fracture angle (Figure 6(b)). In the first stage, the amplitude ratio decreases as the angle increases, and the average decrease at different widths is 6.1 dB/10∘. In the second stage, the amplitude ratio increases with the further increase in the angle, and the average increase at different widths is 4.9 dB/10∘. The increase of crack width raises the amplitude ratio for small angles (𝜃 < 26∘) (Figure 6(a)), while it decreases the amplitude ratio for large angles (𝜃 > 26∘). The amplitude ratio between𝑆0 and 𝐴0 shows a great capacity for fracture width detection with different fracture angles, even for very small crack widths (𝑤 < 1 mm): 27.4 dB/mm for a transverse fracture, 19.2 dB/mm for a 18∘oblique fracture, −19.8 dB/mm for a 53∘oblique fracture, and−22.9 dB/mm for a 63∘oblique fracture (Figure 6(a)).
It has been demonstrated that when the cortical bone thickness (ℎ) is much larger than the longitudinal wave length (𝜆), the speed of FAS is larger than that of the 𝑆0 mode, but for very thin plate, the speed of the FAS signal approaches the velocity of 𝑆0 mode [17]. Numerical and experimental results showed that the detection accuracy of the amplitude of FAS for the transverse and oblique crack widths was approximately 2 dB/mm in a 6 mm thick long bone plate at an excitation of 200 kHz (ℎ ≈ 0.3𝜆) [20]. In the performed study, as the excitation frequency is 100 kHz and the cortical bone plate thickness is 4 mm (𝜆 ≈ 40 mm, ℎ ≈ 0.1𝜆), the FAS can be regarded as the ultrasonic Lamb
mode 𝑆0. Compared with high frequency excitation, these simulation results show that the amplitude ratio between 𝑆0 and 𝐴0 may also be used to detect the crack width. In addition, for the oblique fracture model with a 37∼63∘ fracture, the𝑆0 amplitude significantly decreases as the crack width increases, so it is relatively hard to measure mode 𝑆0. Therefore, the incident angle should be optimized to increase the excitation of 𝑆0. The different distance signal results reveal that the propagation distance has a small impact on the amplitude ratio, with an average RSME of 0.78 dB. These results indicate the theoretical feasibility for the clinical application.
In the performed simulation, we consider that the crack surface is uniform, but it is actually irregular, which will affect the propagations of 𝑆0 and 𝐴0. Moreover, the crack region is filled with soft tissue in our simulation, while actually the tissue in the crack site will gradually recover, with a callus appearing and changing during the healing [26, 42–44]. Further experiments are needed to validate our hypothesis that the amplitude ratio between the𝑆0 and 𝐴0 modes can indeed facilitate long bone fracture and healing process evaluation.
5. Conclusions
The impacts of the crack width and fracture angle on the low order guided wave 𝑆0 and 𝐴0 amplitudes were studied in a three-layer model (soft tissue, cortical bone, and marrow) using the 2D-FDTD simulation. The results show that the𝑆0 and𝐴0 amplitudes decrease as the crack width increases. The 𝐴0 amplitude increases as the fracture angle increases, while the𝑆0 amplitude firstly decreases and then increases. To avoid the influence of coupling conditions and excitation signals, the use of the amplitude ratio between𝑆0 and 𝐴0 is proposed to evaluate crack width changes at different fracture angles. The results indicate that the amplitude ratio between𝑆0 and 𝐴0 is sensitive to the crack width in fractures with different oblique angles. The amplitude ratio shows good capability for crack width evaluation, with sensitivities of 25.1 dB/mm for a transverse fracture, 18.7dB/mm for an 18∘oblique fracture, and−23.3 dB/mm for 53∘oblique fracture. The average RSME of 0.78 dB for different propagation distances indicates the small distance impact on the amplitude ratio. Thus, the amplitude ratio between 𝑆0 and 𝐴0 has the capability of reflecting the long bone fracture status, including the crack width and angle. The variation of the amplitude ratio with the crack width and fracture angle was further discussed, which shows its good potential for monitoring the fracture angle and crack width in fractured long cortical bone.
Competing Interests
The authors state that they have no conflict of interests.
Acknowledgments
This work was supported by the National Natural Science Foundation of China (11327405, 11304043, and 11525416) and
the Ph.D. Programs Foundation of the Ministry of Education of China (20130071110020).
References
[1] K. M. Iyer, “Anatomy of Bone, Fracture, and Fracture Healing,” pp. 1–11, 2013.
[2] N. Wu, Y.-C. Lee, D. Segina et al., “Economic burden of illness among US patients experiencing fracture nonunion,”
Orthopedic Research and Reviews, vol. 5, pp. 21–33, 2013.
[3] R. Burge, B. Dawson-Hughes, D. H. Solomon, J. B. Wong, A. King, and A. Tosteson, “Incidence and economic burden of osteoporosis-related fractures in the United States, 2005–2025,”
Journal of Bone and Mineral Research, vol. 22, no. 3, pp. 465–475,
2007.
[4] I. Barata, R. Spencer, C. Raio, M. Ward, and A. Sama, “15 ultra-sound detection of long bone fractures in pediatric emergency department patients,” Annals of Emergency Medicine, vol. 58, no. 4, pp. S182–S183, 2011.
[5] R. Burge, B. Dawson-Hughes, D. H. Solomon, J. B. Wong, A. King, and A. Tosteson, “Incidence and economic burden of osteoporosis-related fractures in the United States, 2005-2025,”
Journal of Bone and Mineral Research, vol. 22, no. 3, pp. 465–475,
2007.
[6] D. W. Dempster, “Osteoporosis and the burden of osteoporosis-related fractures,” The American Journal of Managed Care, vol. 17, supplement 6, pp. S164–S169, 2011.
[7] P. Corso, E. Finkelstein, T. Miller, I. Fiebelkorn, and E. Zalosh-nja, “Incidence and lifetime costs of injuries in the United States,” Injury Prevention, vol. 12, no. 4, pp. 212–218, 2006. [8] L. C. Y. Wong, W. K. Chiu, M. Russ, and S. Liew, “Review
of techniques for monitoring the healing fracture of bones for implementation in an internally fixated pelvis,” Medical
Engineering & Physics, vol. 34, no. 2, pp. 140–152, 2012.
[9] J. E. Rabiner, H. Khine, J. R. Avner, L. M. Friedman, and J. W. Tsung, “Accuracy of point-of-care ultrasonography for diagnosis of elbow fractures in children,” Annals of Emergency
Medicine, vol. 61, no. 1, pp. 9–17, 2013.
[10] K. P. Cross, “Bedside ultrasound for pediatric long bone fractures,” Clinical Pediatric Emergency Medicine, vol. 12, no. 1, pp. 27–36, 2011.
[11] Q. Huang, B. Xie, P. Ye, and Z. Chen, “3-D ultrasonic strain imaging based on a linear scanning system,” IEEE Transactions
on Ultrasonics, Ferroelectrics, and Frequency Control, vol. 62, no.
2, pp. 392–400, 2015.
[12] Q. Huang, Y. Huang, W. Hu, and X. Li, “Bezier interpolation for 3-D freehand ultrasound,” IEEE Transactions on
Human-Machine Systems, vol. 45, no. 3, pp. 385–392, 2015.
[13] C. Liu, F. Xu, D. Ta et al., “Measurement of the human calcaneus in vivo using ultrasonic backscatter spectral centroid shift,”
Journal of Ultrasound in Medicine, vol. 35, no. 10, pp. 2197–2208,
2016.
[14] Z. Chen, Y. Chen, and Q. Huang, “Development of a wireless and near real-time 3D ultrasound strain imaging system,” IEEE
Transactions on Biomedical Circuits and Systems, vol. 10, no. 2,
pp. 394–403, 2016.
[15] K. Eckert, O. Ackermann, B. Schweiger, E. Radeloff, and P. Lied-gens, “Ultrasound evaluation of elbow fractures in children,”
Journal of Medical Ultrasonics, vol. 40, no. 4, pp. 443–451, 2013.
[16] H. Li, L. H. Le, M. D. Sacchi, and E. H. M. Lou, “Ultrasound imaging of long bone fractures and healing with the split-step
fourier imaging method,” Ultrasound in Medicine & Biology, vol. 39, no. 8, pp. 1482–1490, 2013.
[17] E. Bossy, M. Talmant, and P. Laugier, “Effect of bone cortical thickness on velocity measurements using ultrasonic axial transmission: a 2D simulation study,” Journal of the Acoustical
Society of America, vol. 112, no. 1, pp. 297–307, 2002.
[18] P. Laugier, “Instrumentation for in vivo ultrasonic character-ization of bone strength,” IEEE Transactions on Ultrasonics,
Ferroelectrics, and Frequency Control, vol. 55, no. 6, pp. 1179–
1196, 2008.
[19] V. Protopappas, M. Vavva, D. Fotiadis, and K. Malizos, “Ultra-sonic monitoring of bone fracture healing,” IEEE Transactions
on Ultrasonics, Ferroelectrics, and Frequency Control, vol. 55, no.
6, pp. 1243–1255, 2008.
[20] S. P. Dodd, J. L. Cunningham, A. W. Miles, S. Gheduzzi, and V. F. Humphrey, “Ultrasound transmission loss across transverse and oblique bone fractures: an in vitro study,” Ultrasound in
Medicine & Biology, vol. 34, no. 3, pp. 454–462, 2008.
[21] C. B. Machado, W. C. de Albuquerque Pereira, M. Talmant, F. Padilla, and P. Laugier, “Computational evaluation of the compositional factors in fracture healing affecting ultrasound axial transmission measurements,” Ultrasound in Medicine &
Biology, vol. 36, no. 8, pp. 1314–1326, 2010.
[22] I. M. Siegel, G. T. Anast, and T. Fields, “The determination of fracture healing by measurement of sound velocity across the fracture site,” Surgery, Gynecology & Obstetrics, vol. 107, no. 3, p. 327, 1958.
[23] S. Gheduzzi, S. P. Dodd, A. W. Miles, V. F. Humphrey, and J. L. Cunningham, “Numerical and experimental simulation of the effect of long bone fracture healing stages on ultrasound transmission across an idealized fracture,” The Journal of the
Acoustical Society of America, vol. 126, no. 2, pp. 887–894, 2009.
[24] P. Moilanen, “Ultrasonic guided waves in bone,” IEEE
Transac-tions on Ultrasonics, Ferroelectrics, and Frequency Control, vol.
55, no. 6, pp. 1277–1286, 2008.
[25] K. Xu, D. Ta, and W. Wang, “Multiridge-based analysis for sep-arating individual modes from multimodal guided wave signals in long bones,” IEEE Transactions on Ultrasonics, Ferroelectrics,
and Frequency Control, vol. 57, no. 11, pp. 2480–2490, 2010.
[26] V. T. Potsika, K. N. Grivas, V. C. Protopappas et al., “Application of an effective medium theory for modeling ultrasound wave propagation in healing long bones,” Ultrasonics, vol. 54, no. 5, pp. 1219–1230, 2014.
[27] K. Xu, D. Ta, R. He, Y.-X. Qin, and W. Wang, “Axial transmission method for long bone fracture evaluation by ultrasonic guided waves: simulation, phantom and in vitro experiments,”
Ultra-sound in Medicine & Biology, vol. 40, no. 4, pp. 817–827, 2014.
[28] C. B. Machado, W. C. D. A. Pereira, M. Granke, M. Talmant, F. Padilla, and P. Laugier, “Experimental and simulation results on the effect of cortical bone mineralization in ultrasound axial transmission measurements: a model for fracture healing ultrasound monitoring,” Bone, vol. 48, no. 5, pp. 1202–1209, 2011. [29] G. Barbieri, C. H. Barbieri, N. Mazzer, and C. A. Pel´a, “Ultra-sound propagation velocity and broadband attenuation can help evaluate the healing process of an experimental fracture,”
Journal of Orthopaedic Research, vol. 29, no. 3, pp. 444–451, 2011.
[30] P. Laugier, “Quantitative ultrasound instrumentation for bone in vivo characterization,” Bone Quantitative Ultrasound, pp. 47– 71, 2010.
[31] M. G. Vavva, V. C. Protopappas, L. N. Gergidis, A. Charalam-bopoulos, D. I. Fotiadis, and D. Polyzos, “The effect of boundary
conditions on guided wave propagation in two-dimensional models of healing bone,” Ultrasonics, vol. 48, no. 6-7, pp. 598– 606, 2008.
[32] K. Xu, D. Ta, P. Moilanen, and W. Wang, “Mode separation of Lamb waves based on dispersion compensation method,”
Journal of the Acoustical Society of America, vol. 131, no. 4, pp.
2714–2722, 2012.
[33] T. N. H. T. Tran, K.-C. T. Nguyen, M. D. Sacchi, and L. H. Le, “Imaging ultrasonic dispersive guided wave energy in long bones using linear radon transform,” Ultrasound in Medicine
and Biology, vol. 40, no. 11, pp. 2715–2727, 2014.
[34] K. Xu, D. Ta, D. Cassereau et al., “Multichannel processing for dispersion curves extraction of ultrasonic axial-transmission signals: comparisons and case studies,” The Journal of the
Acoustical Society of America, vol. 140, no. 3, pp. 1758–1770, 2016.
[35] K. Xu, D. Ta, B. Hu, P. Laugier, and W. Wang, “Wideband disper-sion reversal of lamb waves,” IEEE Transactions on Ultrasonics,
Ferroelectrics, and Frequency Control, vol. 61, no. 6, pp. 997–
1005, 2014.
[36] K. Xu, J. Minonzio, D. Ta, B. Hu, W. Wang, and P. Laugier, “Sparse SVD method for high-resolution extraction of the dis-persion curves of ultrasonic guided waves,” IEEE Transactions
on Ultrasonics, Ferroelectrics, and Frequency Control, vol. 63, no.
10, pp. 1514–1524, 2016.
[37] Z. Zhang, K. Xu, D. Ta, and W. Wang, “Joint spectrogram segmentation and ridge-extraction method for separating mul-timodal guided waves in long bones,” Science China: Physics,
Mechanics and Astronomy, vol. 56, no. 7, pp. 1317–1323, 2013.
[38] K. Xu, D. Ta, Z. Su, and W. Wang, “Transmission analysis of ultrasonic Lamb mode conversion in a plate with partial-thickness notch,” Ultrasonics, vol. 54, no. 1, pp. 395–401, 2014. [39] K. Xu, D. Liu, D. Ta, B. Hu, and W. Wang, “Quantification of
guided mode propagation in fractured long bones,” Ultrasonics, vol. 54, no. 5, pp. 1210–1218, 2014.
[40] J. L. Rose, “Ultrasonic waves in solid media,” 2004.
[41] E. Bossy, M. Talmant, M. Defontaine, F. Patat, and P. Laugier, “Bidirectional axial transmission can improve accuracy and precision of ultrasonic velocity measurement in cortical bone: a validation on test materials,” IEEE Transactions on Ultrasonics,
Ferroelectrics, and Frequency Control, vol. 51, no. 1, pp. 71–79,
2004.
[42] I. Dudkiewicz, M. Heim, M. Salai, and A. Blankstein, “The biol-ogy of fracture healing in long bones,” Journal of Musculoskeletal
Research, vol. 12, no. 2, pp. 105–112, 2009.
[43] D. Comiskey, B. J. MacDonald, W. T. McCartney, K. Synnott, and J. O’Byrne, “Predicting the external formation of callus tissues in oblique bone fractures: idealised and clinical case studies,” Biomechanics and Modeling in Mechanobiology, vol. 12, no. 6, pp. 1277–1282, 2013.
[44] V. C. Protopappas, D. I. Fotiadis, and K. N. Malizos, “Guided ultrasound wave propagation in intact and healing long bones,”
Ultrasound in Medicine & Biology, vol. 32, no. 5, pp. 693–708,
Submit your manuscripts at
https://www.hindawi.com
Stem Cells
International
Hindawi Publishing Corporation
http://www.hindawi.com Volume 2014
Hindawi Publishing Corporation
http://www.hindawi.com Volume 2014
INFLAMMATION
Hindawi Publishing Corporation
http://www.hindawi.com Volume 2014
Behavioural
Neurology
Endocrinology
International Journal ofHindawi Publishing Corporation
http://www.hindawi.com Volume 2014
Hindawi Publishing Corporation
http://www.hindawi.com Volume 2014
Disease Markers
Hindawi Publishing Corporation
http://www.hindawi.com Volume 2014
BioMed
Research International
Oncology
Journal ofHindawi Publishing Corporation
http://www.hindawi.com Volume 2014
Hindawi Publishing Corporation
http://www.hindawi.com Volume 2014
Oxidative Medicine and Cellular Longevity
Hindawi Publishing Corporation
http://www.hindawi.com Volume 2014
PPAR Research
The Scientific
World Journal
Hindawi Publishing Corporation
http://www.hindawi.com Volume 2014
Immunology Research
Hindawi Publishing Corporation
http://www.hindawi.com Volume 2014
Journal of
Obesity
Journal ofHindawi Publishing Corporation
http://www.hindawi.com Volume 2014
Hindawi Publishing Corporation
http://www.hindawi.com Volume 2014
Computational and Mathematical Methods in Medicine
Ophthalmology
Journal of Hindawi Publishing Corporationhttp://www.hindawi.com Volume 2014
Diabetes Research
Journal ofHindawi Publishing Corporation
http://www.hindawi.com Volume 2014
Hindawi Publishing Corporation
http://www.hindawi.com Volume 2014
Research and Treatment
AIDS
Hindawi Publishing Corporation
http://www.hindawi.com Volume 2014
Gastroenterology Research and Practice
Hindawi Publishing Corporation
http://www.hindawi.com Volume 2014