HAL Id: halshs-00553599
https://halshs.archives-ouvertes.fr/halshs-00553599
Preprint submitted on 7 Jan 2011HAL is a multi-disciplinary open access archive for the deposit and dissemination of sci-entific research documents, whether they are pub-lished or not. The documents may come from
L’archive ouverte pluridisciplinaire HAL, est destinée au dépôt et à la diffusion de documents scientifiques de niveau recherche, publiés ou non, émanant des établissements d’enseignement et de
Céline Carrere, Jaime Melo De
To cite this version:
Céline Carrere, Jaime Melo De. Non-Tariff Measures: What do we Know, What Should be Done?. 2011. �halshs-00553599�
Document de travail de la série Etudes et Documents E 2009.33
N
N
OONN-
-
T
T
AARRIIFFFFM
M
EEAASSUURREESS:
:
W
W
HHAATT DDOO WWEEK
K
NONOWW,
,
W
W
HHATATS
S
HHOOUULLDD BBEED
D
OONNEE?
?
by Céline Carrère CERDI-CNRS and Jaime De MeloUniversity of Geneva and CERDI December 2009
Abstract
With the reduction in tariff barriers, Non-tariff and behind-the-border measures (NTM and BTB) have increased in importance. This paper surveys the state of knowledge with the view to drawing implications for policy suggestions to reduce those NTM barriers that are welfare reducing. Following a description of data bases and their shortcomings, the paper reviews the state of understanding on the effects of NTMs on trade flows. The more difficult issue of translating these effects into welfare implications are covered next. The paper concludes with different approaches at reducing NTMs.
Glossary of Abbreviations AFTA Asian Free Trade Area
APEC Asia Pacific Economic Cooperation (21 countries in the Asia Pacific region)
AVE Ad valorem equivalent
BTB Behind-the-border measures that include CODEX Codex Alimentarius Commission
EBA Everything but Arms initiative of the EU giving duty-free quota-free access to LDCs in the EU market
HS Harmonized system
DCs Developing countries (other than LDCs) DSU Dispute Settlement Understanding FTAs Free-trade Areas
GSP Generalized system of preferences IOE International Office of Epizootics
IPPC International Plant Protection Convention LDCs The list of 50 Least-developed-countries MFA Multi fiber agreement
NTBs Non-tariff barriers (subset of NTMs that are welfare-reducing NTM Non-tariff measures
OTRI Overall Trade Restrictiveness Index
PTAs Preferential trade agreement (often non-reciprocal such as GSP or EBA)
PSRO Product Specific rules origin usually defined at the HS-6 level QRs Quantitative Restrictions
RIA Regional Integration Agreement RoO Rules of Origin
S&D Special and Differential Treatment for LDCs (longer time frame to adjust to new rules complement by TA)
SPS Sanitary and phytosanitary measures TA Technical Assistance
TF Trade Facilitation negotiations VER Voluntary Export Restraint WTS World Trading System
1. Introduction
The evidence on the various barriers to trade--natural and policy related--points to high ‘trade costs’ which have been invoked to explain several puzzles in macroeconomics (see Obsfeld and Rogoff, 2000). The growing literature is also struggling to come up with better estimates of these trade costs and, for those that are policy-imposed, which ones are ‘actionable’, i.e. are welfare-decreasing and could be eliminated or reduced by policy action. Take two examples. The costs associated with cross-border trade between two well-integrated countries, the US and Canada, have been estimated to be as high as 70% (see Anderson and Van Wincoop, 2004). 1
Another literature on the patterns of bilateral trade is still to resolve the distance puzzle (why low-income countries do not expand trade in old and new products with partners further away in the recent decades in spite of a decline in transaction costs).2
‘Trade Costs’ are usually defined as the sum of administrative barriers, trade policies - tariffs and non-tariff measures (NTMs) - and transaction costs (transport and insurance costs). Sometimes the literature also refers to behind-the-border (BTB) measures to distinguish those trade costs that are not the result of trade policies.3 The conclusion of the Uruguay Round
has resulted in the tarification of agriculture support measures and the elimination of the MFA, quotas, VERs and traditional other welfare-reducing NTMs (because they reduce welfare, these measures are often called NTBs) are out of the picture. As a result, attention has focused on the extensive array of NTMs and BTB measures which are part of ‘trade costs’.
1 If these estimates seem high, they are confirmed by recent estimates of the ‘border effect’
based on homogenous products. Using detailed data at the Universal Product code level for 1800 stores for a large retail chain on both sides of the US-Canada border and for close to 40 million products, Gopinath et al. (2009) find that for some products a retail price discontinuity as high as 21% for stores on either side of the border while it is close to zero for stores on the same side of the border.
2 See the discussion and evidence in (Berthelon and Freund, 2008, Carrère et al., 2009,
Disdier and Head, 2008). Regardless of the magnitude of the ‘puzzle’, it is surprising that the average distance of trade for low-income countries has fallen significantly over the last thirty years.
3 The terminology ‘BTB measure’ was first used to distinguish between ‘deep’ and
‘shallow’ integration in Regional Integration Agreements, ‘deep’ integration occurring when integration extends beyond the removal of protection (i.e. integrating factor markets, combining regulatory institutions, harmonizing standards and cooperating
NTMs are often defined by what they are not (i.e. as all measures except tariffs—see box 1). Some are covered in the WTO agreements4, but these
are measures for which disciplines are minimal (countries only have to notify changes to the WTO to increase transparency, and many countries do not notify these measures). Most efforts at reducing NTMs have either occurred unilaterally or (mostly) at the regional level and there has been little progress at harmonization on a multilateral level.
As to BTB measures, they are not covered in WTO but, evidence suggests that they represent significant barriers to trade (all forms of transaction and administrative costs, including transport-related costs). While it is difficult to get an informed appraisal about the relative importance of NTMs vs. BTBs as barriers to trade, there is general agreement that BTBs are increasing in importance and that BTBs are the most important barrier to trade for many small landlocked or isolated economies (see Shepherd and Wilson, 2006, and Hoekman and Nicita, 2008) .
From the point of view of gaining a better understanding of the importance of NTMs and of what to do about them, this note deals with three related questions that should help guide policies towards NTMs:
- How important are NTMs, i.e. what impact they have on trade flows? Which have been identified as most significant (across sectors, countries)?
- Which NTMs are justifiable, and for those that are not (some say NTBs, or uninformative rather than informative NTMs) what can be done?
- What approaches have been or could be used to remove NTBs.
Answering the first question helps focus on the NTMs that are binding, i.e. on those that reduce the volume of imports. This is a first step towards identifying that would be considered for policy action if they are found to be non-informative or welfare-reducing. The second, and more difficult issue, is the determination of the NTMs that are likely to be welfare-reducing. The discussion is necessarily general, reflecting the difficulty of detecting which NTMs are welfare-reducing. This leads naturally to a discussion of approaches used to remove NTBs.
This note is complementary to our companion note (Carrère and de Melo, 2009) which surveys methods and main results on measurement of the effects of NTMs. Section 2 summarizes the growing number of data bases that are coming on stream and should help developing better diagnosis. Section 3 reviews the different approaches used to detect the effects of
4 NTM provisions covered in the WTO agreements are : (i) article VII on customs
valuation ; (ii) TBT agreement ; (iii) SPS agreement ; (iv) rules on import-licensing procedures ; (v) rules of origin ; (vi) PSI ; (vii) TRIMs ; (viiii) State-trading entreprises ; (ix) Trade remedies.
NTMs on trade flows and highlights some of the main results from these studies. Section 4 discusses the welfare implications of NTMs using illustrative examples. Section 5 reviews the alternative approaches at national, regional or multilateral levels to remove NTMs that are identified as welfare-reducing.
2. Data on NTMs
Extensive data base: UNCTAD TRAINS-WITS data base
Until recently, the UNCTAD Trade Analysis and Information System (TRAINS – accessible via WITS) data base was the only extensive data base covering NTMs for a large number of countries, mainly allowing the computation of frequency and coverage ratios. It has given rise to several classifications (see box 1), but this database presents two main limitations. First, it is dated (the data base has not been updated since 2001) and quite incomplete (a lot of missing values). As explained in detail in the annex 1, the data base is supposed to cover 165 countries since 1988, but in effect only 100 countries have more or less reliable data for the period 2000-2001. One of the problems in the data base is that the missing entries at the HS-6 level may either refer to missing data or to no NTM on that tariff line. Hence, the interpretation of frequency and coverage ratios is subject to the caveats that much of the missing information is difficult to interpret (does no entry at the HS-6 tariff line level mean no NTM or does it
represent missing data?).
With the growing importance of NTMs as barriers to trade, awareness of the deficiencies of existing data bases has grown and data collection efforts are under way. A joint UNCTAD/WTO (ITC) project is underway to put together a new data base that will include two components: an enhanced official component much like in the current WITS-TRAINS data base but for more measures (see details in box 2), and also a subjective component based on detailed interviews for representative samples of exporting companies (about 400 per country).5
The second main limitation of UNCTAD TRAINS relates to the frequency and coverage ratios reported in this database which are not informative on the restrictiveness of the NTMs considered. An interesting and useful extension of the UNCTAD TRAINS-WITS data base is the set of World Bank Overall Trade Restrictiveness Indices (OTRI) also covering a large number of countries for years around 2000. The general objectives of these indices are first to build more comprehensive indicators of trade restrictiveness that include measures of both tariff and non-tariff
measures; and second to allow exploring differences in the level of trade protection vis-à-vis different groups of countries (low-income, middle-income, least-developed countries). However, these indices, discussed at greater length in our companion, have the same shortcomings that the UNCTAD TRAINS data base.
Box 1
Existing Categorization of NTMs*
NTMs are broadly defined as any measure that causes a trade distortion but is not a tariff whereby a distortion exists when the domestic price differs from the border price. These include export restraints and export subsidies and the
distortions can be intentional (e.g. a QR) or a side effect of a legitimate regulatory measure (e.g. a sanitary measure). If it is imposed explicitly to protect domestic industry by restricting import demand, it is also known as an NTB. Distortions mostly arise from government-imposed measures, but can also be due to restrictive business practices. An NTB also includes internal (i.e. behind-the-border) measure such as a production subsidy and the many juridical and
administrative measures covered under the Trade Facilitation negotiations of the Doha Round .
Three classifications have been developed: (i) UNCTAD-TRAINS which uses the Trade Control Measures Coding System (TCMS) broken down into six categories: price control measures, finance measures, automatic licensing, quantity control measures, monopolistic measures and technical measures (it excludes measures applied to exports and production) – this classification is in the process of being updated (see details on the classification in Box 2); (ii) the WTO NAMA
classification based on the 800 measures that members must notify to the WTO under the individual agreements---SPS, TBT,AD--- (government participation in trade, customs and administrative procedures (rules of origin), TBTs, SPS, Specific limitations (quotas), charges on imports (IPRs and safeguards) which is periodically incorporated in the UNCTAD data base; (iii) the Deardorff and Stern (1997) classification which covers much the same ground as the other two but includes as well a broad range of macro policies (including FDI policies, national policies, foreign exchange policies and corruption).
With the elimination of the MFA and the tarification of agricultural support policies into two-tier tariff schemes, the number of tariff lines ridden with
quantity and price controls has fallen from 45% in 1994 to 15% in 2004 while the use of TBT has almost doubled from 32% to 59%, with technical regulations are the most frequent important NTM.
* For elaboration, see World Bank (2008a), Beghin (2006), and Hoekman and Nicita (2008).
Box 2
New classification of NTMs*
The only internationally available cross country database on NTMs is the
UNCTAD -TRAINS database. However, this database has not been updated since 2001 and the data is based on an obsolete classification which does not accurately cover new forms of non-tariff measures. In 2006, UNCTAD established the Group of Eminent Persons on Non Tariff Barriers (GNTB) to discuss definition, classification, collection and quantification of non-tariff barriers so as to identify data requirements, and consequently to facilitate the understanding of the
implications of NTMs (defined as “policy measures, other than ordinary customs tariffs, that can potentially have an economic effect on international trade in goods, changing quantities traded, or prices or both”).
The new proposed classification of NTMs follows a hierarchical "tree" structure where NTMs are differentiated according to 16 "branches" or chapters (denoted by alphabetical letters), each comprising "sub-branches" (1-digit), "twigs" (2-digits) and "leafs" (3 (2-digits).This classification drew upon the existing, but outdated, UNCTAD Coding System of Trade Control Measures (TCMCS)
classification on NTMs, and has been modified and expanded by adding various categories of measures to reflect the current trading conditions.
Im p o rt m e a s u re s Technical measures Non-technical measures Chapter Chapter
A Sanitary and phytosanitary measures (SPS)
B Technical barriers to trade (TBT)
C Pre-shipment inspection and other formalities D Price control measures
E Licenses, quotas, prohibition & other quantity control measures F Charges, taxes and other para-tariff measures
G Finance measures H Anti-competitive measures I Trade-related investment measures
P Export-related measures(including export subsidies)
J Distribution restrictions
K Restrictions on post-sales services L Subsidies (excluding export subsidies) M Government procurement restrictions N Intellectual property
O Rules of origin
Export measures
The updated classification includes a substantial number of new sub-categories on sanitary and phytosanitary (SPS) measures and technical barriers to trade (TBT), and introduced a few new categories of NTMs such as “export measures”, “trade-related investment measures”, “distribution restrictions”, “restrictions on post-sales services”, “subsidies”, “measures related to intellectual property rights” and “rules of origin”. The classification also introduces the concept of “procedural obstacles”, which refers to issues related to the process of application of an NTM,
Specific NTM data bases
A growing number of more specific new data bases are becoming available. These include a global Anti-dumping data base, a data base on EU
standards, the WTO Sanitary and Phytosanitary (SPS) Measures – Information Management System (SPS-IMS) and several data bases on trade facilitation measures. Annex 1 gives a short description of these data bases. Table A1.1 summarizes this information and gives links to access these data.
Country Cases Survey/Interview data bases
In their early influential study, Deardorff and Stern (1997) noted that “there is no substitute for NTB and sector-specific expertise. The reliability of any measure of NTBs that may be constructed for particular sectors is limited by the knowledge of the intricacies of those sectors that bear upon the measures”. Case studies aim at providing this knowledge necessary to classify NTMs so as to be better informed on which ones are informative (should be kept from a welfare point of view as e.g. certain prohibitions or technical regulations for health, security or environmental reasons). We review here briefly the two recent initiatives to collect case studies data (World Bank, 2008a and 2008b and UNCTAD/WTO (ITC), 2009)
The World Bank study (2008a) carried out firm and governmental official interviews in thirteen countries (Cambodia, Chile, China, Indonesia, Korea, Laos, Mexico, Singapore, Thailand, Taiwan, Peru, Vietnam). The objective was to get an idea of the potential for export expansion if these countries were to face less restrictive NTMs in their main export markets. The interviews were carried out with government officials and exporter associations and/or firms in an informal manner and varied greatly across countries. For example 23 interviews were conducted in Cambodia, two with exporter associations, the rest with government officials, while in Mexico it was taken from a data base in Mexico’s export-import Bank, while in Korea the interviews were administered to 1000 respondents that included firms and embassies.
Another similar study was for East Africa was also conducted by the World Bank (2008b). The task team conducted country-by-country consultations with member governments and private sector firms (producers/exporters/ importers/transporters) with an effort to focus specifically on NTMs that constrain “only” the intra-region trade of EAC members. However, the discussions with firms often had to include their sale in other parts of the country and beyond the region (in Sub-Saharan Africa, especially the Democratic Republic of Congo).
The other data base initiative is the one of UNCTAD/WTO/ITC discussed above (see also box 2). Actually, in addition to official data collection, the project proposes to collect data from the private sector by conducting firm level surveys and by providing a web based application to facilitate data collection from private companies.
As described in the Report of the Multi-Agency Support Team (2009), the primary scope of survey data collection is to obtain information on NTMs that poses particular burdens for private firms. This approach provides useful information because the presence of a large number of complaints gives an indication of the existence of a particularly restrictive NTM (see the first results for the 7 pilot countries reported in next section). However, the survey data collected is of limited use for statistical analysis. First, it always remains a difficult task to interpret the implications of subjective statements. Perceptions may vary according to the knowledge of the person interviewed, or according to the recent experience the person had. Perceptions are also likely to vary across countries in a given sector. Perceptions will also be different in countries with a strong social
infrastructure (where meeting SPS and TBT standards will be easier) from those in countries with a weak social infrastructure.
Moreover, in general the sample surveys are not representative of the country’s overall exports (some sectors are excluded a priori), or even of sectoral exports (large firms are excluded). Hence, as recognized by the Multi-Agency Support Team (2009), there are problems of endogeneity due to selection bias as firms that are not likely to report problems are excluded, but also because the incentives of firms in reporting NTMs is likely to be correlated with their capability in complying with the measure. These problems make survey data poorly suited for cross country
comparison, and problematic to use in combination with other data sets such as tariffs or bilateral trade flows.
3. Measuring the effects of NTMs on trade flows: What Does the Data tell us?
Results based on the UNCTAD TRAINS-WITS data base or Specific NTM data bases
As shown in the annotated bibliography in annex 2, until recently most assessments on NTMs has relied on computing “frequency” and “coverage” ratios, most often using the WITS-TRAINS where the NTMs are entered as binary (zero-one) variables. For well-known reasons these indicators, while a useful description of the landscape, are insufficient to serve as proxies of the effects of these NTMs since these ratios are outcome
variables: a low frequency or coverage ratio could represent a very stringent NTM measure.
A more systematic analysis of the effects of NTMs has focused on evaluating their ad-valorem equivalents (AVEs), i.e. on estimating the tariffs that would result in the same reduction in imports as those
attributed to the NTMs. The large majority of studies have concentrated on one of two approaches.6
The first approach uses the gravity model often focusing on the effects of NTMs on the volume of aggregate bilateral trade. For the purpose at hand, which is to detect the effects of NTMs at the product level where they are imposed, the gravity model has several drawbacks. First, it works better for aggregate trade than for trade at the product-line level. This makes it ill-suited for the analysis of NTMs which are usually defined at the product-level. Such estimates then need to be carried out at the most disaggregated product level possible. Second, any NTM is usually imposed on imports regardless of their origin while the gravity model seeks to explain bilateral trade volumes making it difficult to identify the effects of NTMs on
bilateral trade as shown by the lack of robustness of results to the choice of NTM indicator (see box 3).
6 Another approach, much less used, relies on price comparisons. It is very demanding
because ideally it requires data at the product level (e.g. at the universal product code level as in Gopinath et al., 2009). This precludes using the approach for a larger number of countries and products.
Box 3
SPS and TBT Agreements: Effects on Agricultural Trade* Under the WTO SPS and TBT Agreements, members can adopt regulations which may influence significantly trade flows, either positively when these regulations provide information to consumer that are safe or negatively if they are used in a protectionist way. Disdier et al. (2008) use the ad-valorem equivalents (AVEs) of Kee et al. (2008) along with a dummy variable or a frequency index to measure the trade impact of SPS and TBT (measures notified to WTO) in 2004 on imports of 690 agricultural and food products. In the sample of 154 importing countries, only 92 reported SPS or TBT measures to the WTO, in each case adducing one of six motives for the measure (these data do not have a bilateral) dimension.
In their sample, 260 products have a coverage ratio above 50%. The most frequent barrier is “technical barriers” (i.e product-specific characteristics) with protection of health the most cited motive (human, followed by animal and plant). For 20 products, less than 5 countries impose a measure on that product, perhaps an indicator of a protectionist intent for those country-product pairs.
Across OECD importing countries, there is a large variance in coverage ratios (for example, Japan has a coverage ratio of 23% while Australia, Mexico, New
Zealand, Norway and the US have coverage ratios above 50%. When using the coverage indicator, developing countries are the most affected while it is developed countries when the ranking is by number of products affected.
Gravity-based estimates at the HS-4 level for OECD countries indicate that, after controlling for others correlates of bilateral trade, each one of three indicators (dummy variable, frequency index or AVE) reduces significantly bilateral imports. When disaggregating exporters into three groups (OECD, DCs and LDCs), they find that OECD exports are more significantly affected by tariffs than DCs or LDCs. When it comes to SPS and TBT measures, DCs and LDCs export volumes to OECD countries are negatively correlated with the index particularly when it comes to export to EU markets who notify fewer SPS and TBT measures than other OECD countries (except Korea and Turkey). At the subsector level (HS-2), they find statistically significant negative coefficients for one third of the sectors, and statistically significant positive coefficients for another third, the remainder being insignificant. However, the results are sensitive to the choice of NTB measure (dummy variable vs. AVEs). In sum, the study suggests that SPS and TBT measures are more negatively correlated with the exports of DCs and LDCs exports to OECD markets.
The second approach draws on the factor-endowment-based theories of trade focusing on the volume of trade at the product level. In that
approach, the volume of aggregate trade is correlated with factor
endowments, country characteristics, tariffs and various proxies of NTBs. While it has advantages for a study of the effects of NTMs at the product level, it too has drawbacks as idiosyncratic measurement errors, likely to cancel out at the aggregate level, will be magnified at the HS-6 product-line level and relevant control variables are missing. Finally, the estimate of the price elasticity of demand for imports, which is essential for
computing the AVE, will likely change in magnitude with the sample period.
Subject to the doubtful quality of the data, the survey in our companion paper of the growing number of studies various data bases suggest: (i) NTM restrictiveness estimates based on an aggregate of ‘core’ NTMs are more restrictive than existing tariffs and, because of their export
composition towards agricultural products, these ‘core’ NTMs limit market-access most for low-income countries; (ii) subject to the included controls, NTM indicators are systematically correlated negatively with bilateral trade volumes; (iii) harmonization of standards is trade
enhancing; (iv) for single-NTM products (74% of tariff lines only have one NTM measure) have an AVE of around 40% which is higher than the tariff on the corresponding line; (v) the restrictiveness of technical regulations increases with income per capita.
Results based on Country Cases Survey/Interview data bases
First, we look at the World Bank study on thirteen countries (Cambodia, Chile, China, Indonesia, Korea, Laos, Mexico, Singapore, Thailand,
Taiwan, Peru, Vietnam). Taken together, the thirteen case studies suggest that NTMs are particularly costly for agricultural products not only
because the SPS standards vary across countries, but also because compliance costs related to certification are high as the necessary
infrastructure to carry them out were found to be lacking in the countries in the sample. These costs are compounded by the cost-raising effects on perishables due to inefficient customs procedures. For manufactures, steel, chemicals, and plastics are often subject to Anti-dumping measures. Finally the interviews in the surveys indicate that arbitrariness and non-transparency plague exporters to developing countries, be it with respect to customs procedures or product standards. For exporters of these developing countries to the EU, US and Japan, the major obstacle is the complexity and level of detail in the trade procedures. Stringent Rules of Origin are often perceived as a significant barrier.
For the 5 EAC countries, the task team (World Bank 2008b) presents the NTMs that apply to intra-EAC trade, with the broad categories organized as per the WTO inventory categorization which are ranked in a decreasing order of importance and based on the numbers of private sector
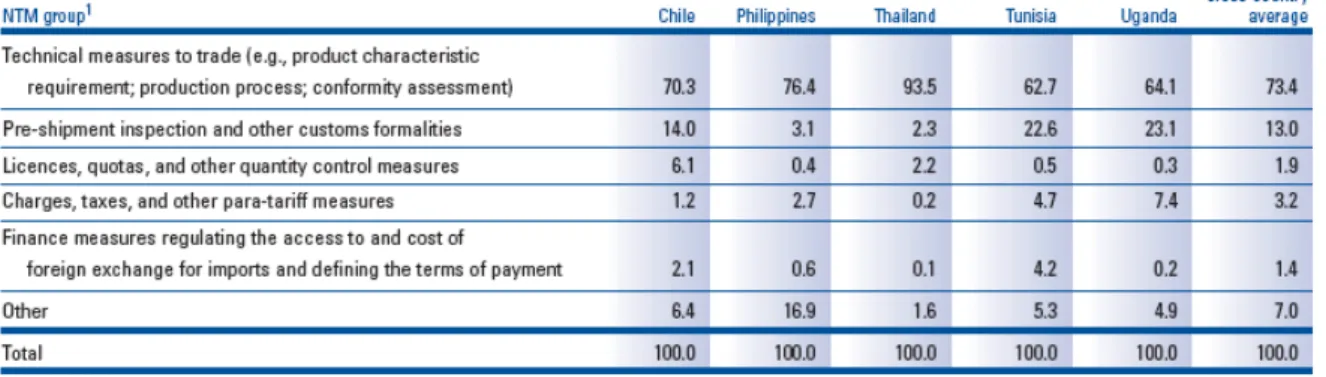
complaints from their interviews in the 5 EAC economies. They obtain the following ranking: a) Customs and administrative entry and passage procedures; b) Government participation in trade and restrictive practices tolerated by it; c) Distribution restrictions; d) Specific limitations; e) Technical barriers to trade and f) Sanitary and Phyto-Sanitary Measures. We turn now to the first results based on the UNCTAD/WTO (ITC) pilot study (only for the private sector data) described previously (and in Box 2). A2s well described in Mimouni et al. (2009), In January 2008, the ITC and the UNCTAD launched a joint 15-month pilot project for the collection and classification of data on NTMs in seven developing countries. In each country, among other activities, a company-level survey with 300 to 400 face-to-face interviews was carried out in order to identify, at the product level, those measures that exporting companies perceive as barriers in their daily business, as well as the reasons why companies experience a measure as burdensome. The following analysis will be based on the survey results for five countries (Chile, the Philippines,Thailand,Tunisia, and Uganda). Results from the surveys in the five countries are reported in table 1.7
Table 1. Non-tariff Measures experienced by exporting firms (i.e. declared as “Serious Obstacles to Trade”, %
source : Mimouni et al. (2009), table 1 in section 1.6.
While the sample is small, beyond the expected result that technical measures are the most important form of NTM (a result also evident from
7 In May 2009 the UNCTAD and ITC conducted a follow-up survey to assess the impact of
the financial crisis on NTMs measures in 5 out of the 7 pilot countries. The paper of Skorobogatova et al. (2009) summarizes the results.
the earlier data—see table 4 below), several patterns emerge suggesting variation across regions of destination (perhaps due in to the product composition of exports) . From table 2, it is apparent that Thai exporters reported concerns about technical measures to trade, while Chileans faced licenses and quotas and the African countries expressed concerns about customs formalities and pre-shipment inspection.
Figure 1, also drawn from their study, explores the possibility that NTM barriers vary across destination by reporting the average share of NTMs across destination for the seven most prevailing type of measure (because firms often reported several measures, per-firm averages were computed in a first step). Certification requirements are important regardless of destination. Not surprisingly, exporters face barriers related to customs formalities in Africa. This is not surprising since tariffs are a more
important source of government revenue in that region, but also it is at the customs that rent-seeking activities will endogenously take place in the form of NTMs. In the absence of rent-seeking activities, one might argue that PSI might be warranted, but it is not at all clear that it fulfills its role (see Anson, Cadot and Olarreaga, 2006). So even in this straightforward case, it is not absolutely clear that this NTM is ‘actionable’, i.e. is welfare-reducing. For exports destined to high-income countries, testing
requirements represent an important obstacle for exporters. Two patterns emerge; (i) exporting to countries in the Africa, Latin America and
Caribbean regions face more procedural barriers overall; (ii) for at least three countries (Chile, Thailand and Tunisia), barriers to regional destinations are highest; (iii) further results (not reported here) suggest that many of the problems reported by the firms surveyed relate to domestic barriers ranging from weak customs and administrative procedures as well a lack of local facilities and infrastructure.
Figure 1. Companies’ Perceptions of NTMs by Destination, %
source :Mimouni et al. (2009), figure 1 in section 1.6.
These patterns are informative, and useful, partly because they confirm some of the patterns emerging from the larger earlier data set where it is apparent that technical regulations represent the most frequent form of NTMs (see estimations obtained in our companion paper and reported in table 2 below). With a larger sample of countries comparisons to averages will be more meaningful. However, as already discussed in section 2, it will always remain a difficult task to interpret the implications of subjective statements. It may also be difficult to match the results from
questionnaires administered to companies to the responses by firms. To learn more about the effects of NTMs, not only case studies must complement the econometric estimates, but these studies must go beyond interviews and rely on more systematic in-depth data gathering on
compliance costs. This is illustrated in the commodity-chain studies summarized in box 4. These results confirm that there is no substitute for sector-specific expertise and that it is difficult to interpret the results from perceptions expressed in ordinal rankings in interviews.
Box 4:
Food Safety and Agricultural Standards*
Fresh and processed fruits and vegetables, fish, meat, nuts, and spices account for over 50% of agricultural food exports of developing countries. A recent study of commodity chains for fish, horticulture, livestock products, nuts and spices in 9 low and middle-income countries reached several generalizable conclusions. (i) SPS constraints include measures imposed by the private sector that are often more stringent than those of the public sector. (ii) In countries with weak institutions and lack of overall competitiveness (administrative financial and other weaknesses), these measures may force exit, but for countries with adaptive capacity, these stricter standards provide a stimulus for investments in supply-chain modernization resulting in more profitable long-term trade. (ii) the
complexity of the standards setting for high-value products are likely to increase, especially within the private sector, leading to package together safety, quality, environmental and social standards implying that developing-country
stakeholders should participate in the standards-setting process through international organizations, bilateral discussions, or membership in private bodies. (iii) A great diversity in the operative ‘rules of the game’ subsist in spite a move in the same broad direction, with regulatory systems entailing a mix of old and new requirements that reflect largely different perceptions of risk, scientific traditions and climatic/geographic traditions so that it is difficult to ascertain the cases when standards are protectionist in intent.
The research also shows that compliance strategies to cope with SPS have been successful in many middle-income countries and that coping strategies should move beyond a pure public sector approach to include the private sector.
Potential benefits of standards compliance are long-term (there are economies of scale and scope), often intangible (price premiums are not always paid for ‘safe’ and ‘sustainable’ products) and the benefits often accrue to others. In many instances, the researchers were able to document the low costs of compliance for those that chose to comply. In many instances the bulk of compliance costs were fixed and often less than 5% of the annual value of exports. The research
concludes that for the large array of high-value commodity chains examined, costes were less than assumed, especially relative to the value of exports.
4. Welfare Effects of NTMs
If measuring the effects of NTMs on trade flows is difficult, with the exception of QRs, VERs and minimum prices whose objectives are to protect domestic industries, detecting their welfare effects is even harder because the measures are complex and hence not easily quantifiable. Most importantly, the NTMs typically have several objectives, with protection a potential objective to be detected since it is hidden. Even in the case of distortionary NTBs, i.e. measures that do not address a market failure such as externalities or asymmetric information, a unified approach to measure their impact does not exist. Typically, measurement is in partial
equilibrium at the product level. The analysis then attempts to separate out three effects: (i) the regulatory protection effect that provides rents to domestic producers; (ii) the supply-shift effect reflecting increased costs for foreign, and sometimes domestic, suppliers; (iii) a demand-shift effect which takes into account that the regulation may enhance demand with new information or by reducing an externality.
The three following example help illustrate the difficulties at
quantification. The first illustrates the difficulty in drawing the welfare implications of SPS measures for agricultural products. The second on standards in electronic products applied by the EU, shows that
harmonization of standards increases trade, and is likely to be welfare-increasing. The third, on rules of origin in PTAs illustrates that these measures are prone to capture and hence are likely to be welfare-reducing
Suppose a country imposes an SPS measure, and one uses a frequency or coverage measure to approximate the effects of the measure. First, the indicator used for the measure (usually a binary variable) does not capture the potential deterrent effect the measure may have on exporters’ pricing and quantity decisions (this is not a problem with a tariff whose objective is just to reduce imports, and perhaps to raise revenue). Second to get the information on the relative value of the affected product, one would want to compute the coverage index on the value of imports that would have occurred in the absence of the measure, which is unobservable. Finally, when one observes the outcome resulting from the adoption of the
measure, one is not sure if it is the result of a supply and/or a demand shift (the SPS measure could be informative as consumers learn about the product’s characteristics perhaps via required labeling, in which case the demand curve would shift out). It is not surprising then that the results from the bilateral estimates at HS-4 level reported in box 3 are unstable and sensitive to the choice of indicator of NTM. And even if the results were stable one would have difficulty drawing welfare implications without being informed subject to the SPS: for example, a decrease in imports of a
hazardous product following the imposition of an NTM is not welfare reducing as is a reduction in imports following the imposition of a QR, a VER or a tariff.
The effects of product standards on manufactures are also difficult to ascertain since they can have a dual impact on costs. On the one hand they may impose additional costs on exporters who may have to adopt products to the required standards in the importing country. Moreover, a producer wishing to export to several markets may be confronted to idiosyncratic standards specific to each market (in electronics, the EU imposes around 1800 standards, of which two-thirds are international common standards, see Portugal-Perez, Reyes and Wilson, 2009). To these costs, must be added certification costs. On the other hand, product standards can reduce the exporter’s information costs if they convey information on industrial requirements or consumer tastes in the importing country. Portugal-Perez et al. show that internationally-harmonized standards are associated with expanded EU imports of electronics while European
standards not harmonized are associated with a lower effect on imports, in some cases a negative effect. Taken together, the results suggest that harmonization of standards increases welfare.
Box 5
The Capture of Rules of Origin by Private Interests* RoO in PTAs have two components: a small set of regime-wide and a large set of product-specific rules of origin (over 500 different ones in the EU system), typically defined at the HS-6 level of disaggregation. Together, both rules are intended to insure sufficient transformation. The EU and the US who are the main instigators of PTAs have rules that feature a large list of criteria, including technical requirements such as the “triple transformation” requirement in textiles and apparel, which requires apparel to be woven from originating fabric and yarn. Criteria also include exceptions (making them more stringent) and
allowances (making them less stringent). The US relies more heavily on changes of tariff classification, though often in combination with other criteria while the EU relies more heavily on the value content and wholly obtained criteria.
To find out how stringent these rules researchers have constructed ordinal measures of overall restrictiveness to indicate that product-specific rules with a greater number of conditions to be met are more restrictive. Research based on preference uptake under NAFTA and the EU system of preferences have shown that after controlling for the extent of preferences, utilization rates are lower for products with restrictive RoO, that restrictiveness of RoO increase with the preferential margin. Detailed analysis of Mexican exports of clothing to the US at the HS-8 level shows that 1/3 of the price rise from sales to the US under
preferential access goes to compensate for higher intermediate costs and the price of intermediates sold by the US to Mexico rose under NAFTA. In North-South PTAs, the Southern partner in effect has to buy inefficient goods from the Northern partner to “pay for” preferential access. In sum, the restrictiveness of RoO has been found to go beyond the levels that would be justified to prevent trade deflection suggesting a capture by special interest groups.
Simplification of RoO accompanied by harmonization across PTAs (via the multilateralization of the rules) would represent a significant step towards reducing an actionable NTM. For example, LDCs could be exempted from having to prove origin when preferential margins are less than 3-5%, and single change of tariff classification, or a uniform value content rule could be adopted. In addition to reducing compliance costs, such simplification cum uniformization would reduce administrative costs and free customs officials (according to surveys, customs officials estimate they spend close to 1/3 of their time on checking compliance with origin requirements) for other tasks such as trade facilitation.
Following the Hong-Kong Ministerial declaration stating that developed
countries should “…ensure that preferential rules of origin applicable to imports from LDCs should are transparent and simple, and contributing to facilitating market access (paragraph (b) in annex F of the declaration), LDCs have circulated a paper (TN/CTD/”/30) suggesting a combination of value addition and local content criteria. This is clearly an area in which LDCs could press harder for a simplification.
Finally, consider Rules of origin (RoO), necessary to prevent trade-deflection in FTAs, i.e. to prevent imports from entering the zone via the country with the lowest tariff. Even though FTAs are discriminatory in intent, RoO have the legitimate objective of preventing the unwanted extension of preferences to out-of-bloc producers which would erode the value of those preferences to eligible producers (in North-South FTAs, RoO are also sometimes justified on “developmental” grounds as they can help foster the emergence of integrated manufacturing activities in
Southern partners).
RoO are notified to the WTO and figure in the NAMA-based WTO inventory of NTMs measures as item F in Part II (Customs and
Administrative Entry Procedures). Detailed inventories of RoO used by the EU and US indicate several hundred different RoO defined at the HS-6 level. In North-South FTAs, RoO technical requirements (e.g. the double transformation requirement in the production of clothing) coupled with the regional value content criterion have to be met to qualify for
preferential access in the Northern partner’s market. The Southern producers are then forced to source relatively inefficient intermediate goods locally or in Northern partners (compared to most price-competitive sources in, say, Asia).
Digging into the maze indicates that RoO are more restrictive for products with high preference margins. The RoO also end up reducing the value of preferences (compounding preference erosion in particular for Least Developed Countries). Thus, by design via the bargaining and lobbying power of the Northern firms, RoO have been captured by producers and end up as a way to “export protection” (see box 5 for details). Clearly, RoO are an NTM whose initial intent was not protection, but which have been captured by protectionist groups and an actionable NTB (see box 5 for measures that would reduce these costs).
5. Approaches to Eliminating NTMs
Given the difficulty at classifying NTMs, a practical approach is to follow the World Bank (2008a) and use the four principles required of NTMs by the WTO (i.e. transparency, non discrimination, existence of a scientific basis in the case of SPS measures and absence of better alternatives). 8
This is the approach used in the classification of table 2 which describes the main characteristics of WTO-verified NTMs. Actually, following the ASEAN analysis, we examine in table 2 every identified non-tariff measure
8 This is the approach used by ASEAN in their approach at removing NTMs. Using the
WTO classification also makes sense if one is looking into the future of the WTS which is more likely to be concerned with marginal adaptation of existing rules than creating or changing drastically existing rules.
in light of the four WTO criteria above and propose, when available, the ad-valorem tariff equivalent as estimated in Carrère and De Melo (2009). The last column also suggests measures that should be replaced by
transparent and non-discriminatory measures which nevertheless achieve the same policy goals.
The difficulty is that in a number of cases an NTM can be WTO-compatible but also discriminatory or it may create an obstacle to trade due to its implementation. This why the new UNCTAD/WTO (ITC) classification also introduces the concept of “procedural obstacles” which refers to issues related to the process of application of an NTM, rather than to the measure itself (see box 2). It was decided that information on problems or other excessive burdens related to implementation of NTMs were to be collected through survey data under the broad term of procedural obstacles (see section 2). But for the moment, such information is not available on a cross-section basis and thus we continue to refer to the best criteria currently available, i.e the WTO-compatibility criterion.
As shown in Carrère and De Melo (2009) where a tally is taken of the frequency of the main NTMs from the UNCTAD TRAINS data base, technical regulations (often in the form of SPS measures) is the most frequently used NTM (probably followed by RoO if only because of the growing number of PTAs around the world).
In table 2, the most difficult NTMs to characterize are the technical regulations relating to sanitary measures (for the protection of human beings and animals) and the phytosanitary measures (for the protection of plant health). To be WTO-compatible, SPS measures should be
harmonized to the standards guidelines and recommendations of the ‘three sisters’ (CODEX, IOE, IPPC) with LDCs having S&D treatment. The difficulties involved with SPS are evident from the relatively large number of complaints related to the DSU. 9
9 As of December 2008, 35 violations to the SPS agreement had been reported with 10
Type of NTM Objective
Potential for non transparent and discriminatory application Scientific basis Tariff AVE a) possible levels of negoc. b)
Alternative measure that can achieve objective in less distortive manner
1400 –Tariff quota
duties Protection
None since based on predetermined criteria such as
product type and amount but discriminates between products
None National(N) Regional(R) Multilateral(M) N/R Tariffs 2200 – Additional charges Revenue
None since transparent and
applied uniformly on imports None
N/R Uniform tax on both domestic and imported products
2300 – Internal taxes and charges levied on imports
Revenue or to cover administrative costs
None since transparent and
applied uniformly on imports None
N/R
Uniform tax on both domestic and imported products 3100 – Administrative pricing Protection through price control
Non-transparent basis for price; discriminates between
products None 36.7% N Tariffs 3400 – Antidumping measures Protection through price control
None since transparent,
covered by WTO Agreement None
N/R Remedy already provided for under WTO
rules 4300 – Restrictive official foreign exchange allocation Control outflow of foreign exchange
Transparent but may
discriminate between importers None
N Uniform surcharge on imports, or tax on all foreign exchange transactions or some
otherform of capital control 5100 – Automatic
licensing Monitor imports None since freely granted None
N Ex-post reporting of imports based on
customs entries 6100 – Non- automatic licensing Protection through quantity control Can be nontransparent, unpredictable, arbitrary, discriminatory None 38.1% N Tariffs
6200 – Quotas Protection through quantity control
Basis for quota may be non-transparent; discriminates between products None 42.6% N Tariffs 6300 – Prohibitions Protection through quantity control; also
for public health and
safety, security, Transparent but discriminates between products
Covers sensitive products, to protect health, safety, morals,
46.4% N/R/M
First establish that prohibition is not related to an SPS measure; Tariffs if rationale is protection; domestic tax or regulation of
Type of NTM Objective
Potential for non transparent and discriminatory application Scientific basis Tariff AVE a) possible levels of negoc. b)
Alternative measure that can achieve objective in less distortive manner 6700 – Enterprise-
specific restrictions Selective protection
Procedures and their application can be non-transparent and discriminate between products
None
N/R
Tariffs; fiscal incentives given to selected sectors
7100 – Single channel for imports
Fiscal, economic, or social
Transparent but discriminates
between products None
39.8% N
Tax if fiscal; incentives if economic; tax or controls on domestic consumption, or
operation of buffer stock if social
8100 – Technical regulations
Protect health, safety, environment, security
Transparent administration and equal application on domestic and imported products is likely;
however, discriminates against subjected products
Yes for health, safety, environment or security reasons
43.3% N/R At national level, comply with standards in CODEX, IPPC and IOE; at regional level; harmonization and mutual recognition of standards as in the EU and to a lesser extent
the ASEAN
8200 – Pre-shipment inspection
Protect government revenue
Basis for quality, quantity or price evaluation can be non- transparent; discriminates between products and origins
unless comprehensive
None
N
Risk management at Customs with post-entry audit
Customs and Administrative
procedures (Rules of Origin)
Prevent transhipment Usually multiple and Complex,
but non-discriminatory Ambiguous
N/R/M
Simplify multiple PSRO and use a uniform criterion across broad category of sectors Source: Adapted from World Bank report (2008a) – table 3 page 25
a) estimates obtained from the companion paper Carrère and De Melo (2009) b) Classification by the authors
Next, whether NTMs are to be dealt with at the national, regional, or multilateral level, a sensible approach would be to classify them further as: - NTMs unnecessary (such as automatic licensing)
- NTMs potentially non transparent and discriminatory (RoO) - NTMs that are transparent but discriminatory (selected technical
regulations)
- NTMs that are transparent and apply to both domestic and imported goods could be retained (unless they are welfare-reducing).
Based on this classification, elimination could then proceed in the order classified above, starting with automatic licensing and other unnecessary NTMs, then proceeding with the others.
Two approaches at eliminating NTMS have been/can be pursued: (i) The vertical approach which would identify the NTMs measures which are most welfare-reducing. This is for instance the strategy proposed in World Bank (2008b) for the EAC. NTMs are identified in function of how much they restrain Intra-EAC trade and of their political economic complexity. Hence, as reported in figure 2, 4 quadrants are defined (from A to D).
Figure 2:
Categorization of NTMs in EAC: a ranking by the ease of action for removal
Source: World Bank 2008b, figure 3.1 page 16
Given capacity constraints in the regional economic community and its member governments, EAC wants to first target action on these first quadrant (A and B) reflecting NTMs that are both relatively
noncontroversial for EAC-wide consensus building for removal and have a negative impact on trade (see the World Bank report on EAC, 2008b, pages 15-16). The intra-EAC trade would benefit more from EAC’s
prioritizing those NTMs located in quadrant B during the preparation of action plans for implementation of reduction/removal.
(ii) the horizontal approach which identifies priority sectors and then eliminates NTMs plaguing these sectors;. The ASEAN approach at
eliminating NTMs chose the horizontal approach, identifying 11 priority sectors (see box 6) and classifying the NTMs into Red, Amber and Green boxes according to their restrictiveness, regulatory objectives and WTO consistency - see the discussion on the criteria for identifying priority sectors in World Bank (2008a, p. 24-6).10
Box 6
Priority Sector Criterion*
In 2004, ASEAN singled out eleven sectors as priority integration sectors (independent of the NTM process), based on their great potential for: (a) combining the economic strengths of ASEAN members for regional advantage, (b) facilitating and promoting intra-ASEAN investments, (c) attracting and retaining manufacturing and other activities within the region, (d) promoting outsourcing within ASEAN, (e) developing “made in ASEAN” products and services.” These priority sectors include nine goods sectors (agro-based products, fisheries, healthcare, rubber, wood, textiles, information technology, electronics, and automotive) and two service sectors (air-transport and tourism).
The ASEAN Secretariat identified that reducing the incidence of NTMs in these critical sectors is important for the development of these sectors. This is
particularly relevant since an analysis by the ASEAN Secretariat (ASEAN Program for Regional Integration Support, 2005) shows that more often than not, the products with high NTM incidence fall under one of the eleven priority sectors: NTMs seem to be particularly prevalent in electrical equipment, organic chemicals, motor vehicles, tobacco, cereals, sugar, cosmetics, beverages,
cereal/flour/milk preparations, edible fruit and nuts, pharmaceuticals, cocoa, dairy products, coffee/tea/spices, live animals, vegetables, meat/fish
preparations, vegetable preparations, waste from the food industry, seeds, live trees, meat and edible offal.
* extract from the World Bank report, 2008a, page 24
10 Based on the combined insights regarding sectoral importance, trade restrictiveness,
regulatory objectives and WTO consistency of a given measure, ASEAN has proposed to subsequently classify NTMs into the following categories:
Either approach may be adopted but the examples in section 3 show that it is difficult to estimate the welfare effects of NTMs which is necessary whether a horizontal or vertical strategy at NTM is pursued.
Elimination of NTMs can be pursued: (i) at the national level; (ii) at the regional level in the context of an Regional Integration Agreement in which the country participates; (iii) Multilateral, as in e.g. the Trade Facilitation negotiations at the WTO.
(i) National. When pursued at the national level, there is no concern about delegation of authority to a supra-national level. Since today the vast majority of DCs and LDCs are involved in multiple reciprocal PTAs, the goal should be harmonization and recognition at the regional level so that the RIA is ‘deep’ and hence welfare-enhancing for all members.
Mexico presents an interesting national program of NTM elimination. As described by Cadot (2009), the Mexican experience highlights the benefits that come from the streamlining of NTMs when it is part of a broader regulatory-reform agenda. The number of licenses, permits and other information requirements in the commerce and transport sectors, for instance, was cut from about one thousand in 1995 to fewer than 400 in 2000 and the Economic Deregulation Unit (UDE), created as early as 1989, reviewed over 500 regulatory proposals between 1995 and 2000. All in all, about 90% of Mexico’s regulatory framework was affected by the process.
Box 7
A roadmap for NTM streamlining based on the Mexican experience*
The review of the Mexican experience suggests that the NTM/regulatory
improvement toolbox has essentially four elements, each of which can play a role separately or in combination with the others:
1. A consistent and mutually-reinforcing reform agenda, and a strong and permanent political anchor, such as a binding trade agreement (like NAFTA) 2. International support in the form of technical assistance to the regulatory-improvement body, and international (typically regional) cooperation in the elimination of NTM;
3. A credible institutional setup revolving around a strong oversight body with independence, competence, and high-level political support.
4. Engagement of national administrations, in particular middle-level civil servants, in a Regulatory Impact Assessments process for new regulations and NTMs, taken seriously and used in conjunction with systematic exposure and consultation with stakeholders;
(ii) Regional. To be successful, NTM removal at the regional level
requires some delegation of authority to the supra-national level. The case of the EU summarized in box 8 is the example of the deepest form of NTM removal among sovereign States. However, other efforts have met with some degree of success.
Some examples in developing countries
APEC adopted a Trade Facilitation Plan in 1995 aiming to reduce
transaction costs for businesses by 5% by 2006. As detailed in World Bank (2008a), the ASEAN has implemented a coherent strategy for overcoming NTMs. Even if the elimination of NTMs has been moving more slowly that tariff reduction (partly due to difficult measurement issues), the ASEAN roadmap for integration specifies that NTMs are to be eliminated by 2010 for the ASEAN6, and 2018 for Cambodia, Laos, Myanmar and Vietnam. It is also noteworthy that AFTA which includes ASEAN members has
adopted the simplest origin requirement to meet origin (40 regional value content or wholly obtained) for all products, which is significantly less restrictive than the more complex system of RoO adopted by virtually all other PTAs.11
Several ASEAN regional initiatives have been already eliminated some NTMs through the implementation, for instance, of the new ASEAN harmonized tariff nomenclature at the customs level in 2002, the full harmonization to international standards for some TBT dealing with consumer health and safety for 20 priory products in 2003, and for some standards with respect to electrical safety aspects in 2004. ASEAN has also followed the horizontal approach described above.12
Another noteworthy regional initiative is the one of the EAC, already described above. EAC wants to consider the elimination of NTMs within the context of its evolving common trade policy (see World Bank 2008b).13
Why a regional approach to the elimination of NTMs ?
Two main reasons to pursue a regional approach emerge from the regional and country experiences previously discussed:
- Some NTMs on intra-regional trade can be eliminated. These
include: (i) border checks and other customs formalities on regional goods; (ii) harmonized legislation on health, safety or
environmental protection. Examples of elimination of this kind of
11 See Cadot et al. (2007).
12 See details on the ASEAN website and in the ASEAN program for Regional Integration
NTMs can be found in the EU case (see box 8), the ASEAN case (with for instance the Agreement on Mutual Recognition
Arrangements – MRA - intended as “agreements between two or more parties to mutually recognize or accept some or all aspects of one another’s conformity assessment results”), or again the EAC case discussed above.
- Some NTMs on multilateral trade can be alleviated thanks to a supra-national delegation of authority. This is obvious through for instance the Single Action Plan of the EU on Public-Sector
purchases of non-domestic origin; or the AFTA initiative to adopt the simplest origin requirement to meet origin, or the ASEAN harmonization to international standards for some TBTs dealing with consumer health and safety; Or the EAC that wants to consider the elimination of the NTMs within the context of its evolving
common trade policy. This advantage of “external or supra-national commitment” is also clearly significant in the Mexican case where NAFTA provided a strong impetus for NTM streamlining in Mexico by providing a political anchor to the domestic reform agenda (see Cadot 2009).
(iii) Multilateral. Little progress has been made so far under the Doha Round except for Trade Facilitation. Making trade easier or “Trade
Facilitation” (TF) as it has come to be called is an integral part of reforms aimed at reducing trade costs (simplification of trade procedures,
harmonization of commercial rules and transparent information and procedures as well as the recourse to new technologies allowing trade promotion and more secure means of payment). Indeed, negotiations on Trade Facilitation are the only item among the Singapore to have been included in the “July package” of 2004 and to attract relative consensus across countries. This consensus is explainable by the sharp rise in intra-industry trade, the rising exchange of intermediate goods, and the
verticalization of production in the supply chains that has accompanied the delocalization of activities from developed to developing The TF negotiations which are to deal with articles V (‘transit freedom’ which is extremely important for LDCs, 16 of the 50 being landlocked), VIII (‘fees and formalities Related to the Import and export’, i.e. red-tape) and X (‘publication and application of rules related to international trade’). A second reason for the consensus in carrying out TF negotiations is that the elimination of the red-tape creates relatively few rents and these measures are not easily subject to capture by officials. In spite of significant fixed costs for LDCs (which could be borne by technical assistance), it is
expected that significant market access and increased competitiveness will be achieved by the TF negotiations.
Box 8
The Elimination of NTMs in the EU
The single market of the EU is the most comprehensive example of economic integration and elimination of NTBs based on the three principles of (i) non-discrimination; (ii) mutual recognition; (iii) Community legislation to ensure the functioning of the common market. The so-called four ‘freedoms’ that cover the movement for goods, persons, services and capital is the result of the abolition of customs duties, QRs, and measures having equivalent effect to customs duties and QRs. Measures having equivalent effect have been defined by the European Court of Justice as “All trading rules enacted by Member States which are capable of hindering, directly or indirectly, actually or potentially, intra-Community trade are considered as having an effect equivalent to QRs.” Some sixteen measures have been identified as having equivalent effects. The EC also prohibits all types of trade remedies which include Anti-dumping, safeguards and countervailing measures. In addition, under Mutual Recognition, a Member State may not prohibit the sale of goods lawfully produced in another Member State (the 1979 Cassis de Dijon Case). New law (harmonized legislation) was adopted when existing rules (mostly on health, safety or environmental protection) differed too much across Members and starting in 1985 physical barriers (border checks and customs formalities) were eliminated.
In spite of substantial supra-national delegation of authority to the European Commission, progress in some areas having equivalent effects like public sector purchases of non-domestic origin were slow, so the Single Action Plan was adopted in 1997 to speed up the necessary integration of the Single Market with a scoreboard of implementation put in place. The Action Plan also dealt with formal infringement procedures. If the country fails to comply after the procedure, the European Court of Justice has the power to impose penalty payments and take away privileges under the trader from the country as a last resort
6. Conclusions
Estimates of trade costs are high so the issue is to detect where these trade costs come from. The literature has shown that trade flows are sensitive to both NTMs and BTB measures, some estimates suggesting that BTB
measures are higher than NTM measures. Much progress is forthcoming on selected BTB measure via initiatives on Trade Facilitation at the multilateral level. This paper concentrates on NTMs: detecting their effects, and finding out if the reduction in trade flows is welfare reducing.
With the elimination of t bulk of QRs, VERs and other ‘traditional’ welfare-reducing NTMs, the remaining NTMS are technical barriers to trade. Examples in the paper show that it is difficult to detect when these
regulations are ‘actionable’, i.e. welfare reducing because their intent is not easy to detect. This is particularly the case for SPS measures for which is it difficult to ascertain if they have protectionist intent. In the case of Rules of Origin which have the legitimate objective of preventing trade
deflection, in practice, they have been captured by protectionist interest groups and are more clearly actionable.
Proceeding forward requires first a classification of NTMs as to their usefulness regardless of intent (for example automatic licensing can be removed) then figuring out if they are discriminatory against imports or have a welfare cost in which case they should be removed. Some countries have used a vertical approach (identifying priority sectors as in ASEAN) and others a horizontal (eliminating NTMs in sectors where consensus will be easiest to achieve as in the EAC) approach. As discussed in the text, each has its advantage and the appropriateness depends on circumstances The sequencing of removal has varied across countries and depends on the context.
Another dimension is whether removal is best pursued nationally, regionally or multilaterally. Here too, there are differences in experience across countries and regions. Some NTMs can be removed unilaterally but, given that most countries are engaged in RIAs, a regional approach would be preferable since it brings into focus the gains from harmonization across countries. Multilateral approaches are also desirable but more difficult to achieve because countries are hesitant to give up the necessary sovereignty to move forward.
References
Anderson, J., J. Bergstrand, P. Egger, and J. Francois (2008) “Non-Tariff Barrier Study Methodology”, mimeo ECORYS
Anderson, J. and E. Van Wincoop (2004) “Trade Costs”, Journal of Economic Literature, 42(3), 691-751.
Andriamananjara S., Dean J.M., Feinberg R., Ferrantino M.J., R. Ludema and M. Tsigas (2004°, “The effects of Non-Tariff Measures on Prices, Trade and Welfare: CGE Implementation of Policy-Based Price Comparisons”, US international trade commission WP #2004-04-A
Anson, J., O. Cadot, et M. Olarreaga (2006): “Tariff Evasion and Customs Corruption: Does Pre-Shipment Inspection Help?” Contributions to Economic Analysis & Policy, 5(1), 1600—1600.
APEC Secretariat (2005) Quantitative Methods for Assessing the Effects of NTM and Trade Facilitation, World Scientific,
Becker G., 2005, “Non-Tariff Measures –Issues for Sub-Saharan Africa”, UNDP report
Beghin J.C. and J.C. Bureau, 2001, “Quantification of Sanitary,
Phytosanitary and Technical Barriers to trade for Trade Policy Analysis”, Center for Agricultural and Rural Development Working Paper WP291 Beghin J.C., 2006, “Nontariff Barriers”, forthcoming in the New Palgrave Dictionary of Economics .
Berthelon, M., and C. Freund (2008), “On the Conservation of Distance in International Trade”, Journal of International Economics, 75, 310-20. Bora B., Kuwahara A. and S. Laird, 2002, “Quantification of non-tariff measures”, UNCTAD Policy issues series #18
Cadot, O. (2009)“Streamlining NTMs through regulatory reform: Lessons from the Mexican experience”, World Bank mimeo.
Cadot, O. , A. Estevadeordal, A. Suwa-Eisenmann and T. Verdier eds. (2006), TheOrigin of Goods: Rules of Origin in Regional Trade
Agreements, Oxford.
Cadot, O. and J. de Melo (2008) “Why the OECD Should Reform their Rules of Origin”, World Bank Research Observer,