HAL Id: hal-02899005
https://hal.archives-ouvertes.fr/hal-02899005
Submitted on 21 Jul 2020
HAL is a multi-disciplinary open access
archive for the deposit and dissemination of
sci-entific research documents, whether they are
pub-lished or not. The documents may come from
teaching and research institutions in France or
abroad, or from public or private research centers.
L’archive ouverte pluridisciplinaire HAL, est
destinée au dépôt et à la diffusion de documents
scientifiques de niveau recherche, publiés ou non,
émanant des établissements d’enseignement et de
recherche français ou étrangers, des laboratoires
publics ou privés.
Design and manufacturing of a multi-zone phase-shifting
coronagraph mask for extremely large telescopes
P. Martinez, M. Beaulieu, K. Barjot, O. Guyon, C. Gouvret, A. Marcotto, M.
Belhadi, A. Caillat, T. Behaghel, S. Tisserand, et al.
To cite this version:
P. Martinez, M. Beaulieu, K. Barjot, O. Guyon, C. Gouvret, et al.. Design and manufacturing of
a multi-zone phase-shifting coronagraph mask for extremely large telescopes. Astronomy and
Astro-physics - A&A, EDP Sciences, 2020, 635, pp.A126. �10.1051/0004-6361/201936903�. �hal-02899005�
https://doi.org/10.1051/0004-6361/201936903 c P. Martinez et al. 2020
Astronomy
&
Astrophysics
Design and manufacturing of a multi-zone phase-shifting
coronagraph mask for extremely large telescopes
P. Martinez
1, M. Beaulieu
1, K. Barjot
1, O. Guyon
2,3,4, C. Gouvret
1, A. Marcotto
1, M. Belhadi
5, A. Caillat
5,
T. Behaghel
5, S. Tisserand
6, V. Sauget
6, S. Gautier
6, J. M. Le Duigou
7, J. M. Knight
8, K. Dohlen
5, A. Vigan
5,
L. Abe
1, O. Preis
1, A. Spang
1, J. Dejonghe
1, and M. N’Diaye
11 Université Côte d’Azur, Observatoire de la Côte d’Azur, CNRS, Laboratoire Lagrange, Nice, France
e-mail: patrice.martinez@oca.eu
2 Astrobiology Center, National Institutes of Natural Sciences, 2-21-1, Osawa, Mitaka, Tokyo, Japan 3 Steward Observatory, University of Arizona, Tucson, AZ 85721, USA
4 National Astronomical Observatory of Japan, Subaru Telescope, National Institutes of Natural Sciences, Hilo, HI 96720, USA 5 Aix Marseille Univ., CNRS, CNES, LAM, Marseille, France
6 Silios Technologies, Rue Gaston Imbert prolonge, ZI de Peynier-Rousset, 13790 Peynier, France 7 Centre National d’Etudes Spatiales, 18 avenue Edouard Belin, 31401 Toulouse cedex 9, France 8 University of Arizona, Steward Observatory, 933 N. Cherry Ave., Tucson, AZ 85719, USA
Received 11 October 2019/ Accepted 30 January 2020
ABSTRACT
Context.High-contrast imaging of exoplanets around nearby stars with future large-segmented apertures requires starlight suppres-sion systems optimized for complex aperture geometries. Future extremely large telescopes (ELTs) equipped with high-contrast instruments operating as close as possible to the diffraction limit will open a bulk of targets in the habitable zone around M-stars. In this context, the phase-induced amplitude apodization complex mask coronagraph (PIAACMC) is a promising concept for high-efficiency coronagraphic imaging at small angular separations with segmented telescopes.
Aims.The complex focal plane mask of the PIAACMC is a multi-zone, phase-shifting mask comprised of tiled hexagons that vary in depth. The mask requires micro-fabrication techniques because it is generally made of hundreds micron-scale hexagonal zones with depths ranging over a few microns. We aim to demonstrate that the complex focal plane mask of a PIAACMC with a small inner working angle can be designed and manufactured for segmented apertures.
Methods.We report on the numerical design, specifications, manufacturing, and characterization of a PIAACMC complex focal plane mask for the segmented pupil experiment for exoplanet detection facility.
Results.Our PIAACMC design offers an inner working angle of 1.3 λ/D and is optimized for a 30% telescope-central-obscuration ratio including six secondary support structures (ESO/ELT design). The fabricated reflective focal plane mask is made of 499 hexagons, and the characteristic size of the mask features is 25 µm, with depths ranging over ±0.4 µm. The mask sag local devi-ation is measured to an average error of 3 nm and standard devidevi-ation of 6 nm rms. The metrological analysis of the mask using interferential microscopy gives access to an in-depth understanding of the component’s optical quality, including a complete mapping of the zone depth distribution zone-depth distribution. The amplitude of the errors in the fabricated mask are within the wavefront control dynamic range.
Conclusions.We demonstrate the feasibility of fabricating and characterizing high-quality PIAA complex focal plane masks.
Key words. instrumentation: high angular resolution – techniques: high angular resolution
1. Introduction
Exploring the planetary paradigm to heretofore unseen regions including terrestrial planets represents an outstanding technolog-ical breakthrough for the forthcoming decades. Because the dis-tance between the habitable zone and the star decreases along with decreasing stellar mass, and the brightness of an exoplanet increases along with decreasing squared distance, nearby M-stars are ideal candidates for detecting potentially habitable planets. Extending the exoplanet hunt domain to small angular separa-tions is critical because it makes it possible to detect exoplanets that are brighter (in reflected light), more numerous, and more relevant for habitability studies than widely separated planets. Taking full advantage of the angular resolution of future obser-vatories would fundamentally impact the observing program detection yields (e.g.,Stark et al. 2015). A throughput improve-ment is also critical because it leads to: (i) faster and better
correction of dynamical speckles with wavefront control systems; (ii) better correction of quasi-static speckles with wavefront shap-ing systems; (iii) better sensitivity to planets in the post-processed images. All these aspects improve contrast levels and detection sensitivity, and highlight the influence and importance of reach-ing small inner workreach-ing angles (IWAs) and high throughput.
In this context, the extremely large telescopes (ELTs, e.g.,
de Zeeuw et al. 2014;Sanders 2013) offer unprecedented gain in
spatial angular resolution and collecting area. Nonetheless, ELTs add various inherent structural complications that impose ques-tioning on the contrast capability of high-contrast instruments with the next generation of observatories. Coronagraphic con-cepts that deliver high contrast levels on centrally obscured and segmented apertures are mandatory.
The phase-induced amplitude apodization complex mask cor-onagraph (PIAACMC,Guyon et al. 2014) is a high-performance coronagraph approaching fundamental limits for any theoretically
Open Access article,published by EDP Sciences, under the terms of the Creative Commons Attribution License (https://creativecommons.org/licenses/by/4.0),
possible telescope architecture. The PIAACMC is appealing because it allows for a small IWA, high throughput, and sufficient starlight suppression with a complex telescope aperture. Among the small IWA coronagraphs (Mawet et al. 2012), very few solu-tions emerge as being as efficient as the PIAACMC in terms of adaptability to pupil complexity and useful throughput. The phase-induced amplitude apodization (Guyon 2003, PIAA) uses beam remapping for lossless transmission apodization and can be combined with opaque masks (Guyon et al. 2010a). The con-cept of a complex focal plane mask (FPM) – a partially trans-missive phase-shifting mask – was introduced byGuyon et al. (2014) to improve the performance of the former designs to cope with arbitrarily shaped telescope apertures. The PIAACMC the-oretically offers complete coronagraphic extinction of a point source, with high throughput and sub-λ/D IWA (where λ is the imaging wavelength and D the telescope diameter), regardless of the aperture shape. While PIAA optics benefit from exten-sive manufacturing developments and testing over the past years (e.g., Balasubramanian et al. 2010, 2011; Guyon et al. 2010b), complex phase-shifting masks remain relatively less explored in laboratory settings. The PIAACMC focal plane phase masks are, however, a key part of the technology. The FPM design involves dividing a mask into zones and optimizing the depth of each zone to provide an accurate phase shift for optimal stel-lar light cancellation. The multi-zone FPM consists of a tiling of rings, sectors, or hexagons. Newman et al. (2016) investi-gated ring and sector designs, while more recently,Knight et al. (2017) initiated the exploration of a hexagonal shape for the FPM zones (for a transmissive mask of 6 λ/D spatial extent in H-band with depths ranging over 1 µm). The most advanced study of PIAACMC FPM has been the WFIRST-AFTA coro-nagraph Milestone (Kern et al. 2016), but the analysis used a FPM designed with sectors and did not test a highly segmented ground-based pupil. In this paper, we demonstrate the feasibility of fabricating and characterizing a reflective multi-zone phase-shifting tiling of hexagons with 4 λ/D spatial extent in H-band, with depths ranging over 0.4 µm. While Knight et al. (2017) demonstrated reliable means for evaluating the cosmetic quality of the FPM, as well as 1D-cut mask depth profile measurements and evaluation, we provide extensive analysis of our prototype with 2D mask depth measurements, hexagon by hexagon. This allows us to model a numerical map of the purpose-built proto-type that can be used in simulation for: (i) reliable performance evaluation, (ii) assessing the impact of manufacturing errors on the contrast.
The paper is structured as follows: in Sect.2, the FPM design optimization process is detailed, and we discuss the PIAACMC design simplification offered by the small IWA objective; in Sect. 3, the manufacturing process and the characterization of the prototype are presented; Sect.4investigates the expected per-formance of the purpose-built FPM with numerical simulations; finally, in Sect.5, we draw our conclusions.
2. Design optimization
In this section, we discuss the various aspects of the design optimization from the numerical modeling process to the down-selected design specifications.
2.1. Rationale
The PIAACMC is designed for the segmented pupil experiment for exoplanet detection (SPEED) test bed, under development at the Lagrange laboratory in Nice, France. The SPEED facility
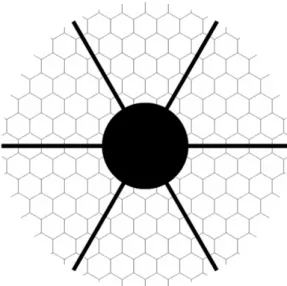
Fig. 1.Telescope pupil assumed for the PIAACMC design and devel-opment for the SPEED facility.
offers an adequate playground for optimizing high-contrast imaging techniques with complex telescope apertures. The sci-entific emphasis around the SPEED project (Martinez et al. 2018, and subsequent papers) concentrates on some of the main instrumental challenges (phasing optics, wavefront shaping, coronagraphy) that are essential for the discovery of low-mass planets in very tight orbits, ultimately reaching the habitable zone (HZ) around M-dwarfs. The SPEED entrance pupil pre-sented in Fig.1 constitutes the main obstacle for high-contrast imaging. The pupil exhibits 163 segments over a circular aper-ture shape to produce a complexity in the pupil similar to that of the ESO/ELT primary mirror, with five times fewer segments, but 1.8 to 4.5 times more segments than any currently operat-ing segmented telescopes, such as the SALT (Buckley 2001) or Keck (Nelson 1990) observatories, respectively, and a 30% cen-tral obscuration ratio with six spider struts separated by 60◦for the ESO/ELT secondary mirror. The segment-to-gap ratio of the pupil is 150, similar to that of the ESO/ELT (145). The SPEED targeted field of view (FoV) is limited to 8 λ/D in radius. In this context, the PIAACMC design guidelines must: (i) accommo-date the SPEED pupil architecture and targeted FoV; (ii) provide deep contrast of ∼10−6 at the IWA for a point-like source; (iii) deliver an IWA close to 1 λ/D; (iv) be made of reflective optics; and (v) use a unique Lyot stop. We do not explore the chromaticity of the PIAACMC in this study.
2.2. Small inner working angle impulse
The selected PIAACMC design for SPEED achieves starlight suppression by combining three elements: (i) a lossless apodiza-tion with aspheric mirrors to provide a point-spread funcapodiza-tion (PSF) with attenuated bright diffraction rings: the first mirror, namely PIAA-M1, compresses the beam into the desired pupil apodization profile and the second mirror, PIAA-M2, corrects optical path length errors that are introduced by the remapping; (ii) a complex focal plane mask that induces destructive inter-ference inside the downstream pupil; (iii) a single Lyot stop that blocks diffracted light.
Inverse PIAA optics, generally associated with classical PIAA (Guyon 2003), are omitted in the SPEED facility, because fairly weak apodization due to a small IWA combined with small
FoV induces weak field dependence in the PSF (Guyon et al.
2010a; Krist et al. 2015). The field PSF varies, but only by
a small amount, over the SPEED FoV. This also simplifies the optical design, alignment, and manufacturing pressure for a laboratory development. In addition, it is worth noting that the SPEED wavefront shaping (dual-DM system) location has been optimized for very small dark hole sizes (Beaulieu et al. 2017), smaller than the SPEED FoV, where the weak PSF field dependence is minimal. Avoiding inverse PIAA optics is also considered for future instrumental developments such as the WFIRST-AFTA coronagraphs development (Krist et al. 2015). It is indeed remarkable to see how targeting a small IWA simpli-fies the PIAACMC design. In classical PIAA concepts (Guyon 2003), mild or strong apodization requires a transmissive pre-apodization component to relax the constraints over the PIAA optics for ease of manufacture. In small IWA PIAACMC, and because the bulk of diffraction suppression is achieved by the small size complex FPM (though this rule of thumb depends on the contrast goal), the apodization delivered by the pair of optics is much less aggressive. This results in numerous advantages: it relaxes the apodization requirement down to weak apodization, making the pre-apodizer useless; it makes the optical surfaces easier to fabricate; and it reduces the off-axis PSF distortion (in classical PIAA, the wavefront remapping of PIAA-M2 introduces a significant off-axis distortion of the field PSF, and a reverse pair of PIAA optics are required to undistort the wavefront). 2.3. Numerical modeling process
The PIAACMC optimization (combined optimization of PIAA mirrors and FPM) is iterative and uses a code written in C lan-guage based on a numerical propagator specifically developed for propagation through PIAA optics (Pueyo et al. 2009), and it uses matrix Fourier transforms (Soummer et al. 2007) for the FPM. The computed optics’ shapes assume nominal flat optics (collimated beam in, collimated beam out). Various regulariza-tion parameters can be tuned to constrain the optics shape and FPM sag. Regularization coefficients are used to restrict the sag depth to a limited peak-to-valley (PV) range. To facilitate man-ufacturing, the PIAA-M1 and PIAA-M2 shapes are forced to remain rotationally symmetric. While the departure from the rotational symmetry can be of the same order or even lower than the fabrication errors, we noticed that digging deeper than 10−6
contrast breaks the rotational symmetry in the optics’ shapes. In this regime, the PIAA optics do indeed start to perform as a wavefront control system by creating a dark hole in the image at the cost of strong high-frequency ripples in the optic phase pro-file. A trade-off must be found between the authority one wants to leave to the coronagraph (with a dichotomy between the optics and the FPM leverage) or to the wavefront control system, if any. In the following part, we present a brief description of the gen-eral scheme of the numerical optimization process, which is sim-plified to a few steps for the sake of simplicity and clarity. We remind the reader that the numerical optimization is monochro-matic and for a point-like source. The coronagraph’s sensitivity to chromaticism and stellar diameter can be included in the opti-mization design process, but these effects will be considered in future work.
Step 0 – pre-compensation of errors: Usually, the entrance pupil feeding the code is degraded (gaps and spiders are enlarged) to anticipate pupil shear errors within the instrument. Step 0 has been omitted for this laboratory development.
Step 1 – optimization of optics and Lyot stop shapes and positions: The objective of this first step is to define the
PIAA-M1 and M2 shapes in monochromatic light with a point-like source under the SPEED guideline constraints (architec-ture, contrast goal, IWA, FoV). This step assumes a nonphysical FPM (ideal from a numerical point of view) and several loops of optimization. At the end of step 1, the optics and Lyot stop are fixed in shapes and positions. Step 1 combines intermedi-ate sequences: (i) an idealized monochromatic PIAACMC for centrally obscured aperture is first designed; (ii) the PIAACMC is then re-adapted to the more general complexity of the pupil design including the spiders and possibly the gaps; and (iii) the design is made achromatic with a multi-zone nonphysical FPM. For each sequence, PIAA optics and Lyot stop shapes and posi-tions are re-optimized and finely tuned (obtained PIAA optics are presented in AppendixA).
Step 2 – optimization of the FPM: The objective of this step is to transform the FPM into a manufacturable mask. The FPM is a multi-zone, phase-shifting mask, and several input parame-ters can be defined before processing the optimization, such as defining the mask geometry, zone number, shape of the zone, and material (of different thickness). The goal is to pattern the FPM with various zones, and to find optimal material thickness for each zone that can be considered manufacturable. Various geo-metrical solutions are offered by the code (ring, sector, hexago-nal tiling). For the SPEED test bed, a hexagohexago-nal tiling has been adopted for ease of manufacture.
Step 3 – validation and cross-checking: At the end of the design process, the code delivers coronagraphic images, o ff-axis PSF images, contrast curves, IWA evaluation, and sys-tem positioning and throughput. The field-dependence of an off-axis source is verified. All these estimates and results are then cross-checked with an independent coronagraphic code
(Beaulieu et al. 2018) written in IDL including Fresnel
propa-gation using PROPER (Krist 2007) to confirm the performance of the design. An independent second code is then used for tol-erancing analysis of the PIAACMC components for defining the specification for the manufacturer. A third numerical code, the end-to-end SPEED modeling code (Beaulieu et al. 2017), incorporating Fresnel diffraction propagation within a realistic system model with simulated wavefront sensing and control, including purpose-built optics with measured wavefront errors is also used independently to guarantee that the PIAACMC design meets the SPEED optical contrast goal (Beaulieu et al. 2017; Martinez et al. 2018).
2.4. Down-selected design and specifications
Some of the characteristic dimensions of the mask features are defined during the numerical modeling process based on a mul-tiparameter optimization taking into account: (i) the IWA; (ii) the targeted contrast; (iii) the spectral bandwidth; and (iv) the stellar angular size. Because the FPM prototype is the first FPM manufactured for the SPEED facility, (i) and (ii) were the main drivers for the optimization process. Here we do not explore the chromaticity and stellar angular resolution effects. The design optimization is rather complex, but some rules of thumb can be derived for design guidelines. The higher the number of zones, the better the performance. A high number of zones provides high degrees of freedom during the FPM performance optimiza-tion. However, a high number of zones is CPU time-consuming, and the manufacturing process also plays a significant role in the selection because small zones are more difficult to produce, and etch depth capability is not infinite. A reflective mask was adopted because the SPEED testbed is made of reflective optics, and it relaxes the constraint on the zone depths since the phase
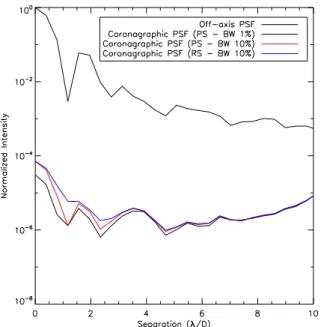
shift is naturally doubled for a given zone depth. The SPEED F-number at the coronagraphic focus is 78, leading to a λ/D of 128 µm at 1.65 µm, constraining the width of the hexagons. We found that 25 µm was a good trade-off between optical need and ease of manufacture. The down-selected SPEED FPM design is depicted in Fig.2. The multi-zone FPM consists of 20 concen-tric hexagons, each of which is 25 µm (circumscribed diameter). The spatial extent of the FPM is 525 µm, equivalent to 4 λ/D. The FPM is made of 499 hexagons over a continuous range of depths, varying by a maximum of 0.4 µm relative to the outer region of the mask. The resulting PIAACMC IWA is 1.26 λ/D (Fig. 3, right), and the contrast evaluation in monochromatic light for a point-like source is shown in Fig. 3(left). The the-oretical raw contrast delivered is 2.9 × 10⁻⁶at the IWA, and
bet-ter than 10−6at farther angular separations than 3 λ/D. On-axis PSFs with and without the FPM are shown in Fig.4, and off-axis PSFs are observable in Fig.5.
The specifications of the FPM given to the manufacturer are based on a numerical tolerancing study including expected purpose-built fabrication errors. Among the various tests con-ducted, we assessed the impact of the FPM local sag error by assuming random realizations (for statistical analysis) and fol-lowing a normal error distribution of various amounts of sag error. Figure 6 (left) shows the impact of 5 nm rms local sag error with a zero-mean bias and demonstrates the importance of pushing the manufacturing limit for the FPM. The specification was set to 5 nm rms (3 nm rms best effort), and the hexagons’ dimension tolerance to ±0.5 µm (best effort ±0.25 µm). Align-ment error impact of the FPM (in rotation) is presented in Fig.6 (center) to help in the definition of reference marks for ease of alignment, and because the FPM hexagonal tiling is not cen-trally symmetric. Rotating the FPM has negligible impact on the contrast performance (Fig.6, center). The SPEED PIAACMC is intended to operate in combination with a dual deformable mir-ror (DM) wavefront sensing and control system (Beaulieu et al. 2017), which might correct the difference between the purpose-built surface profile and the profile specifications, thus tempering some optics’ specifications.
2.5. Impact of nonzero angle of incidence on FPM
The design process discussed previously assumed a nonphysical zero angle of incidence on the FPM. Generally speaking, con-verting the PIAACMC design to a real physical configuration (nonzero angle of incidence) in agreement with the actual opti-cal layout is essential. Nonetheless, the conversion to the ade-quate angle of incidence is not trivial (Pluzhnik et al. 2016). In the SPEED test bed, the beam angle, with respect to the PIAA mirrors and FPM, is 5◦. An estimation of the impact of the 5◦ angle to the zero angle of incidence PIAACMC design was
investigated. To evaluate its impact, we first determined the con-trast degradation when the beam angle is considered using the FPM sag map times cos (5◦) instead of the sag map only. This emulates the first-order effect of the beam angle to the optics: reduced optical path lengths due to non-normal incidence. The results presented in Fig.6(right) show a fairly negligible impact for the FPM (similarly to the PIAA-M1 and M2, but they are not presented here). We found that minor alteration of the perfor-mance is observable for an angle of 20◦. A second-order effect
of the off-axis term is a shape distortion as the viewing angle changes, but this second-order off-axis effect only leaves sub-nanometric residuals and can be neglected.
Wavefront aberration terms associated with translating the zero angle of incidence PIAACMC to nonzero angle of
Fig. 2.Mapping of FPM depths obtained from the PIAACMC optimiza-tion process and as used for specificaoptimiza-tion (1 pixel= 0.27 µm).
incidence PIAACMC for SPEED does not affect the specified performance. The zero angle of incidence FPM phase map is thus left unchanged for the SPEED test bed.
3. Manufacturing
In this section, we present and discuss the fabrication process and the prototype characterization.
3.1. Fabrication processes
The vendor Silios Technologies manufactured the FPM using microtechnology processes in a cleanroom environment. The basic principle for encoding the phase maps of these components is to apply several successive individual steps of photolithogra-phy and etching. This way, any complex staircase phase profile can be manufactured. A maximum of 2N phase levels can be
achieved through N individual etching steps, which either cumu-late or do not. In the case of the FPM, 128 (27) levels were
generated with seven photolithography and etching steps. The components were manufactured into specific fused-silica sub-strates (Corning FPHS 7980). The diameter of the subsub-strates was 100 mm to fit with the four-inch semiconductor standards adapted to the SILIOS microtechnology equipment. The thick-ness was 3 mm, and the substrates were polished to reach a wave-front roughness better than λ/20 PV at 633 nm over a surface of 15 × 15 mm2. The size of the components allows SILIOS to inte-grate several units within a single 100 mm diameter substrate to benefit from the well-known collective manufacturing process in the field of the semiconductor industry. The components were extracted from the substrate via a dicing process (diamond saw) with a centering accuracy of ±50 microns.
The etching process is done using a reactive ion etching (RIE) reactor. This equipment generates a plasma (from flu-oride precursor gases) in the chamber where the substrate is placed. The RIE process is based on two main principles: chem-ical etching and physchem-ical etching. The chemchem-ical etching consists of etching the SiO2 surface by the fluoride ions, whereas the physical etching involves the sputtering of the SiO2 surface due to the accelerated ions. Both etching processes show different
Fig. 3.Ideal PIAACMC azimuthally averaged intensity profile of the image (left) with (black) and without (red) the focal plane mask, and IWA (right) evaluation. Simulations assume a monochromatic light and a point-like source.
Fig. 4.On-axis PSFs with and without the FPM (left and right, respectively) on a logarithmic scale. The size of the image is ∼44 λ/D square.
Fig. 5.Evolution of the PSF on logarithmic scale as a function of off-axis position near the focal plane mask from on-axis to 8 λ/D off-axis (from left to right: 0, 1, 3, 6 and 8 λ/D). The size of the image is ∼44 λ/D square.
behavior. The chemical etching leads to low roughness of the etched surface, but the process is isotropic with potential mask under-etching issues. On the contrary, the physical etching pro-cess is highly anisotropic, but can lead to roughness issues. A tradeoff between these two effects has been found to optimize both the roughness and the pattern definition.
3.2. Prototype characterization
An initial metrology inspection of the FPM was realized using a binocular microscope (x100, see Fig.7, left) to qualitatively
observe the global shape of the hexagonal tiling. A fair agree-ment is found with the zone distribution in the designed FPM (see Fig. 2). A second metrology inspection of the FPM was realized using an interferential microscope (WYKO NT9100). Cosmetic analysis of the FPM demonstrates that very few arti-facts or defects are present over the component, mostly outside the useful area (the hexagonal tiling area), with micron-scale size (with no expected impact considering their relative sur-face to the overall sursur-face of the FPM pattern). The character-istic size of the mask features is measured at 24.5 ± 0.07 µm (specified to 25.0 ± 0.5 µm). The overall hexagonal tiling width
Fig. 6.FPM tolerancing: local sag deviation (5 nm) from specification (left), FPM rotation error (middle), and FPM tilt error of a 5◦
angle (right).
Fig. 7.FPM metrological evaluation: binocular microscopy (x100, left) and interferential microscopy (x5, right). The FPM is 525 µm width.
Fig. 8.FPM metrological evaluation: 3D rendering of segments obtained with interferential microscopy (x100). Individual segments are 25 µm wide.
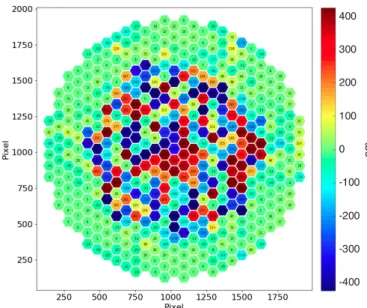
(circumscribed diameter) is measured at 531 ± 1 µm (525 µm in the designed FPM). Large-scale measured inspection of the FPM sag map is shown in Fig.7(right), where the depth scale color goes from blue to red corresponding to negative and positive val-ues, respectively. Small-scale inspection (see Fig.8) shows the high quality of the etch over the hexagonal zones (left image shows the surface of five hexagons) and its uniformity over the
hexagon surface (right image shows a single hexagon). The etch uniformity is also observable in Fig. 8 and translates into a measured roughness quality using two estimates: the averaged roughness (Ra), and the rms roughness (Rq), calculated over a
surface area of 16 µm diameter per hexagon, thus covering most of the hexagon’s total surface, but excluding potential edge fea-tures from the measurement. Both Raand Rq are evaluated over
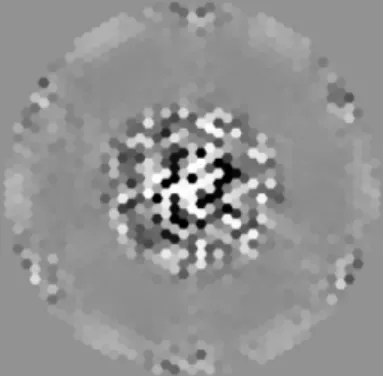
Fig. 9.Mapping of FPM depths as measured by interferential microscopy and averaged for each segment (left) and map of the difference between
specification and measured depths (right).
Fig. 10.Left: histogram of the difference between measured and specified segment depths. Right: theoretical off-axis and on-axis PSFs compared to the expected on-axis PSF obtained with the purpose-built FPM.
the whole set of hexagons present in the FPM. We found an average of 2.81 nm for Ra (standard deviation of 1.57 nm), and
3.61 nm rms for Rq(standard deviation of 2.13 nm rms). Depth
measurements are presented in Fig. 9 (left), where each zone depth has been measured with interferential microscopy (low magnification to get the full FPM in the instrument field of view, x5) and can be compared with the designed FPM depth map in Fig.2. The comparison can be performed zone by zone, that is, segment by segment between measurements and specifications. Individual segment depths were compared with higher magnifi-cation rate (x100) for the sake of accuracy. This makes it pos-sible to establish a complete as-measured 2D map of the FPM depth (Fig. 9, left). The difference between the measured 2D FPM depth map and the prescribed one is presented in the form of a histogram (Fig.10, left) and shows that the etch error is, on average, estimated at 3 nm with a standard deviation of 6.07 nm rms, where the depth error varies from −10 to 15 nm. This is
close to the specification (5 nm rms). In addition, the 2D map of the difference between the specification and the measured depths is presented in Fig.9(right).
Furthermore, we analyze, in greater detail, the measured FPM sag map by comparing measured to prescribed values for: (i) the maximal and minimal sag depth in the FPM, and (ii) the maximal and minimal sag variation over neighboring seg-ments. The maximal specified sag is 425 nm (common to sev-eral hexagons), and measurements vary from 427.3 ± 0.4 nm to 432.8 ± 0.4 nm. The minimal specified sag is −424 nm (common to several hexagons), and measurements vary from −421.1 ± 0.4 nm to −421.9 ± 0.4 nm. This also means that seg-ments that are specified to the same depth value differ from ∼0.5 nm. The maximum sag variation from one segment to another is 844 nm and the corresponding measured value is 846.2 ± 0.4 nm. Similarly, the minimal sag variation in the FPM is 2 nm, and the corresponding measured value is 3.5 ± 0.4 nm.
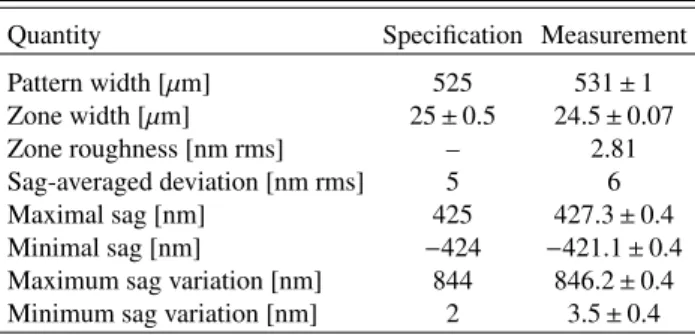
Table 1. Summary of specified values and metrology measurements.
Quantity Specification Measurement Pattern width [µm] 525 531 ± 1 Zone width [µm] 25 ± 0.5 24.5 ± 0.07 Zone roughness [nm rms] – 2.81 Sag-averaged deviation [nm rms] 5 6 Maximal sag [nm] 425 427.3 ± 0.4 Minimal sag [nm] −424 −421.1 ± 0.4 Maximum sag variation [nm] 844 846.2 ± 0.4 Minimum sag variation [nm] 2 3.5 ± 0.4
These variations from the specifications are very limited, and at the level of a few nanometers, enlightening the high optical quality of the FPM. A summary of this quantitative information is available in Table1.
3.3. Edge effects
In the designed FPM, adjacent zones differ from their depths, and the transition between zones is made of sharp edges that can, in principle, be manufactured with microtechnology pro-cesses. Figure 8 illustrates the quality of the zone boundaries and transitions, where small-scale edge defects are observable. We observed in the data that the transitions between consecu-tive zones exhibit edge effects in the form of hollows or bumps. The origin of these errors may be: (i) issues with multiple steps during etching (the zones are obtained by successive etchings under a photolithography mask, and the repositioning accu-racy of the mask is limited, which would result in an enlarge-ment of the physical transitions between zones of the order of 0.25 to 0.5 µm), and (ii) intrinsic error from depth scanning with interferential microscopy (Lehmann & Xie 2015). Interfer-ential microscopy measurements obtained at various magnifi-cation levels show that the observed edge effects significantly decrease when the magnification is increased. This would mean that the observed nonideal edge effects that result from misalign-ment between multiple levels during the manufacturing process are possibly amplified by the interferential microscopy mea-surements. Using the interferential microscopy measurements (x100), we found that the nonideal edge effects (hollow or bump) are of a few tens to hundreds of nanometers in height with sub-micron width. In addition, we find that the slope of the transition between two adjacent zone depths is ≥ 1 (by excluding the edge effects from the estimation) or at the level of two to three (includ-ing the edge effects) over a submicron transition width. A higher quality measurement of the transition regions with an adequate optical instrument is required to provide a reliable estimation of the edge effect characteristics. The estimated characteristics mentioned heretofore should thus be understand as upper limits. It is uncertain if these manufacturing errors would limit the per-formance of the FPM. They need to be studied more precisely to quantify their potential impact on coronagraph performance. 3.4. Discussion
The manufacturing process for such small and precise compo-nents is not a trivial task. Various PIAACMC FPMs have been manufactured recently (e.g., Newman et al. 2016; Kern et al.
2016;Knight et al. 2017), achieving good results from
manufac-turing. However, they all present residual manufacturing errors, the most common of which are: (i) a difference between the
designed and manufactured depth for a particular zone in the mask; (ii) depth-error distribution inhomogeneity over the mask pattern: (iii) surface roughness quality of the zones; and (iv) errors in manufacturing the sharp edges at the zone boundaries. Typically, manufactured depth errors represent few percent of the mask sag PV and deviate from the center to the zones clos-est to the outer edge of the mask. Errors in this central zone of the mask have the greatest impact on the phase shift, because this corresponds to the mask area where the starlight intensity is maximal.
Most recent FPM developments (Knight et al. 2017) demon-strate, with a transmissive mask, a sag standard deviation of 36 nm rms for a 0.8 µm sag PV, which represents 4.5 % aver-aged deviation of the mask sag PV. Our prototype presents a sag standard deviation of 0.7% of the mask sag PV (6 nm rms for a 0.85 µm sag PV), demonstrating the high quality of the manufacturing. Our manufactured FPM exhibits outstanding low depth errors: (i) independently from the zone position within the mask; (ii) with high surface quality; and (iii) with proper, steeply sloped transition regions. Consistency is also demonstrated with the evaluation of a spare FPM component (see AppendixB). In this context, the manufactured FPM presented in this paper can be considered as a leading-edge development for ground-based telescopes. However, a fair comparison with developments dis-cussed, for instance, inKnight et al.(2017), is difficult because some FPM parameters may add a layer of complexity to the manufacturing process. In particular, inKnight et al.(2017), the scaling of the mask feature sizes is smaller by a factor of 2.5, with similar sag PV to that of our development. The complex mask material may also impact the etch depth errors (our mask is made of SiO2 while the mask discussed inKnight et al.(2017) is fabricated with Si).
A couple of guidelines for the mask design can make the manufacturing process easier and more accurate: (i) an advanced and mindful optimization algorithm could impose a continuity constraint on heights of adjacent zones to achieve a smoothly varying phase profile and restrict the zone depths, or set a limit to the maximum depth of a single zone and/or set a minimum width-to-depth aspect ratio, etc.; and (ii) test bed optical param-eters and choices (f-number and wavelength impact-zone width and zone number, reflective mask vs. transmissive mask impact-zozone depths, mask material, etc.) can also ease the mask design, thus tempering manufacturing. The FPM design, that breaks the mask in zones of different depths, is a multiparameter space problem to optimize in order to meet the scientific require-ments. In our case, and because of the SPEED test bed optical characteristics and specified performance, the FPM design can accommodate a relatively low number of rings of the hexago-nal zone, reasonably large-scale zones compared to the operating wavelength with low sag (submicron sag). These mask-d-design parameters may have a favorable impact on the manufacturing accuracy.
4. Expected performance
In this section, we quanrify the impact of manufacturing errors on the FPM performance.
4.1. Purpose-built mask modeling
The metrology analysis of the FPM prototype gives access to depth measurements to all hexagonal zones present in the FPM. From the complete mapping of measured FPM (Fig.9, left) we numerically modeled an purpose-built 2D map of the FPM that
Table 2. Designs parameters.
Parameter FPM #1 FPM #2
Spectral bandwidth [%] 1 10
Stellar angular size [λ/D] − 0.03
IWA [λ/D] 1.26 1.13 M1/M2 separation [mm] 150 150 Sag M1/M2 [± µm] 4.3 3 Sag FPM [± µm] 0.425 2 Hexagon number 499 583 Hexagon size [µm] 25 20 FPM radius [λ/D] 2 3
we can use in simulations. The purpose-built map takes into account the measured depth values but excludes the potential edge effects discussed previously, as well as surface roughness. We did not include the edge effects, because the magnification required to get the entire field of the FPM is low (x5) and is inac-curate for resolving and measuring these small scale effects (see Sect.3.3). Surface roughness and sharp features like edge effects represent high frequency noise on the FPM, filtered by the Lyot stop. These errors are not expected to impact the performance of the PIAACMC system within the SPEED FoV.
4.2. Impact of the manufacturing errors
To assess the expected performance of the purpose-built FPM and to understand manufacturing error propagation and effects on performance, we use a coronagraphic numerical code
(Beaulieu et al. 2018). The simulations assume the SPEED pupil
(Fig.1), the theoretical PIAA mirrors and Lyot stop (Fig.3, left), and the purpose-built FPM. The wavelength is set to 1.65 µm (H-band), and the source is point-like. No other wavefront errors except the FPM errors are considered. The contrast evalua-tion in monochromatic light is shown in Fig.10(right), where the expected contrast curve (blue curve) can be compared to specifications (red curve). The degradation factor in the peak rejection is 3.5 (from 4 × 10⁻⁵ to 1.4 × 10⁻⁴) and the average contrast degradation factor (from IWA to 8 λ/D, SPEED FoV) is 4.1 (from 8.8 × 10⁻⁷to 3.6 × 10⁻⁶). The contrast degradation factor at the IWA is 8.6 (from 2.9 × 10⁻⁶to 2.5 × 10⁻⁵). At
far-ther angular separations than ∼10 λ/D, no degradation is observ-able. The depth errors in the purpose-built FPM thus mainly impact performance at small angular separations, particularly the contrast at the IWA, as well as from the IWA to ∼5 λ/D. The results presented here are conservative because the degradation impact is similar to the impact of the Fresnel propagation on the performance when considering the SPEED optical layout, which includes 20 aberration-free optics with the SPEED end-to-end simulator (Beaulieu et al. 2017). A wavefront control and shaping algorithm, assuming purpose-built optics aberrations, is capable of greatly enhancing the performance (Beaulieu et al. 2018). The next step is to test the PIAACMC prototype in a coro-nagraph test bed with deformable mirrors (SPEED) to assess the limiting contrast achievable with such components.
5. Impact of fundamental contrast limitations
Extrapolating the development of our PIAACMC FPM for realistic scenarios requires us to account for some contrast lim-itations in the FPM design, such as the spectral bandwidth and stellar angular size. As mentioned in Sect.2.4and discussed with
Fig. 11.Example of FPM design accounting for 10% spectral band-width and 0.03 λ/D stellar angular size (FPM #2 of Table2).
various optimized FPM designs inGuyon et al. (2010a), these contrast limitations can be handled in the coronagraph optimiza-tion process. In this secoptimiza-tion, we provide an example of a FPM design, namely FPM #2, that accounts for 10% spectral band-width and a 0.03 λ/D resolved star (e.g., M-type star diameter at 10 pc with an ELT in the near-infrared) and discuss similarities and differences between the FPM manufactured and discussed through the paper, namely FPM #1, and FPM #2. The main char-acteristics of both designs are summarized in Table2. The FPM #2 zone distribution is presented in Fig.11and can be compared to the FPM #1 in Fig.2.
Both designs share the same depth-distribution inhomogene-ity over the mask pattern: large depth distribution in the central zone of the mask, low depth distribution at a farther distance from the central area of the mask, and finally a sag increase in some of the boundary parts of the mask. From a geometri-cal point of view, there are no relevant differences between both designs. However, FPM #2 exhibits smaller zone depth sizes, and thus more hexagons to provide a higher degree of freedom during the FPM optimization (considering the contrast limita-tions it accounts for). Accounting for broadband light and the partially resolved star has a slight impact on the sag amplitude and the physical extent of the FPM (see Table2). The sag PV evolves from ±0.425 µm (FPM #1) to ±2 µm (FPM #2), and the mask spatial extent from 2 to 3 λ/D with no IWA loss. The per-formance obtained with FPM #2 is shown in Fig. 12, where the design robustness to the spectral bandwidth and the par-tially resolved star is demonstrated. This performance can be compared to the ones obtained with FPM #1 (Fig. 10, right), where the contrast levels are roughly of the same order. This first order design comparison emphasizes the relevance and maturity of such FPM developments for future on-sky observations.
Smaller zones and/or larger sag get harder to realize (Knight et al. 2017) and the ratio of the sag PV to the zone size is also less favorable than for the FPM #1 which may impact the fabrication accuracy and increase edge effects. Without going to the realization process, it is hard to anticipate to what level of accuracy the FPM #2 can be manufactured. Indeed, the devel-opment of FPM #1 is a first step in the understanding of the manufacturing capabilities and limits. Further, micro-fabrication is a fast-evolving domain. Nonetheless, the zone size is an input parameter that can be thoroughly defined, and the sag can be constrained in the early stage of the design process. Manufac-turing constraints can thus be anticipated during the optimiza-tion process, if required, so that FPM #2 could be redesigned to accommodate for such constraints.
The elements discussed here cannot, however, be general-ized, because the PIAACMC design optimization is nothing but
Fig. 12.FPM #2: theoretical off-axis and on-axis PSFs (PS: point-like
source, RS: resolved star (0.03 λ/D), BW: spectral bandwidth).
a case to case process. The optimization process is a multipa-rameter space problem, which, as discussed in Sect. 3.3 (last paragraph), accounts for (apart from contrast, throughput, and IWA specifications) material choices, sag (FPM and mirrors -at an acceptable level also considering manufacturing aspects and design constraints, i.e. conserving or not conserving the mir-ror rotational symmetry), mirmir-ror optical separation, FPM geom-etry, FPM zone size and number, coronagraphic plane F-number, observing wavelength, multiple or single Lyot stops, etc. For instance, the optical constraint to avoid beam vignetting in the SPEED bench obliges us to set a distance of 150 mm between PIAA-M1 and PIAA-M2. The performance would be better with 100 mm separation than 150 mm, because diffraction effects get harder to manage in broadband light. In most designs, there is indeed room for improvement and compromises, and running multiple cases to assess fundamental design optimization lim-its is necessary. In the designs discussed here, no fundamental limitations have been met during the optimization process.
Furthermore, it is commonly accepted that wavefront control can improve contrast and could therefore relax design constraints or handle manufacturing errors to some extent. Such tolerance is a function of the residual error concerned and the wavefront control architecture: single or multiple deformable mirrors that would have the necessary stroke to make up for the residual errors. All the results currently discussed in this paper assume no wavefront control. While it is a key point, it is as yet unclear what level of manufacturing error can be absorbed by the wave-front control system, and of course, extra light due to partially resolved sources would not be resolved.
6. Conclusion
We demonstrate the feasibility of manufacturing high-quality PIAA complex masks with expected high performance. The depth of the manufactured FPM zones matches the design
profile with an average error of 3 nm and a standard devi-ation of 6 nm rms. Our measurements provide a model of the FPM which, when used in simulations, demonstrates the expected coronagraphic performance given the manufacturing errors. The purpose-built FPM shows a limited impact on the raw coronagraphic contrast, where most of the contrast degra-dation occurs at small angular separations, and in particular at the IWA. Because the PIAACMC is a low-IWA concept, and the SPEED facility is designed for a small field of view, it is worth pushing further the understanding and capabilities of the manufacturing limits. On the other side, the SPEED PIAACMC is intended to operate in combination with a wavefront shaping system, which could correct the difference between the purpose-built and the specified surfaces. As the depth errors involved are of the order of few nanometers, comparable to wavefront error on optics, wavefront control can, in principle, compensate them (Beaulieu et al. 2017), and thus recover the theoretical FPM per-formance. However, even if it is true, this statement needs to be tempered, because in practice, wavefront shaping at small angle fields is more difficult than at greater angular separations. The capacity of a dual-DM system to compensate for the FPM errors will be studied on the SPEED facility in a future work.
Acknowledgements. This activity received funding from CNES under contract 4500049994/DIA094. We thank the directors of the Laboratoire d’Astrophysique de Marseille for giving us access to the optical metrology equipment of the POLARIS platform. We thank the anonymous referee for his useful suggestions and comments.
References
Balasubramanian, K., Shaklan, S. B., Pueyo, L., Wilson, D. W., & Guyon, O. 2010,Proc. SPIE, 7731, 77314U
Balasubramanian, K., Cady, E., Pueyo, L., et al. 2011,Proceedings of SPIE - The
International Society for Optical Engineering, 8151
Beaulieu, M., Abe, L., Martinez, P., et al. 2017,MNRAS, 469, 218
Beaulieu, M., Martinez, P., Abe, L., et al. 2018,Proc. SPIE, 10700, 107003O
Buckley, D. A. H. 2001,New Astron. Rev., 45, 13
de Zeeuw, T., Tamai, R., & Liske, J. 2014,The Messenger, 158, 3
Guyon, O. 2003,A&A, 404, 379
Guyon, O., Martinache, F., Belikov, R., & Soummer, R. 2010a, ApJS, 190, 220
Guyon, O., Pluzhnik, E., Martinache, F., et al. 2010b,PASP, 122, 71
Guyon, O., Hinz, P. M., Cady, E., Belikov, R., & Martinache, F. 2014,ApJ, 780, 171
Kern, B. D., Guyon, O., Belikov, R., Wilson, D., & Poberezhskiy, I. 2016,
American Astronomical Society Meeting Abstracts, 227, 206.03
Knight, J. M., Brewer, J., Hamilton, R., et al. 2017,Proc. SPIE, 10400, 104000N
Krist, J. E. 2007,Proc. SPIE, 6675, 66750P
Krist, J., Nemati, B., Zhou, H., & Sidick, E. 2015,Proc. SPIE, 9605, 960505
Lehmann, P., & Xie, W. 2015,Proceedings of SPIE - The International Society
for Optical Engineering, 9660
Martinez, P., Janin-Potiron, P., Beaulieu, M., et al. 2018,Proc. SPIE, 10703, 1070357
Mawet, D., Pueyo, L., Lawson, P., et al. 2012,Proc. SPIE, 8442, 844204
Nelson, J. 1990, inThe Next Generation Space Telescope, eds. P.-Y. Bely, C. J. Burrows, & G. D. Illingworth, 99
Newman, K., Conway, J., Belikov, R., & Guyon, O. 2016,PASP, 128, 055003
Pluzhnik, E., Guyon, O., Belikov, R., & Bendek, E. 2016,J. Astron. Telesc. Instrum. Syst., 2, 011018
Pueyo, L., Shaklan, S., Give’On, A., & Krist, J. 2009,Proc. SPIE, 7440, 74400E
Sanders, G. H. 2013,JApA, 34, 81
Soummer, R., Pueyo, L., Sivaramakrishnan, A., & Vanderbei, R. J. 2007,Opt. Express, 15, 15935
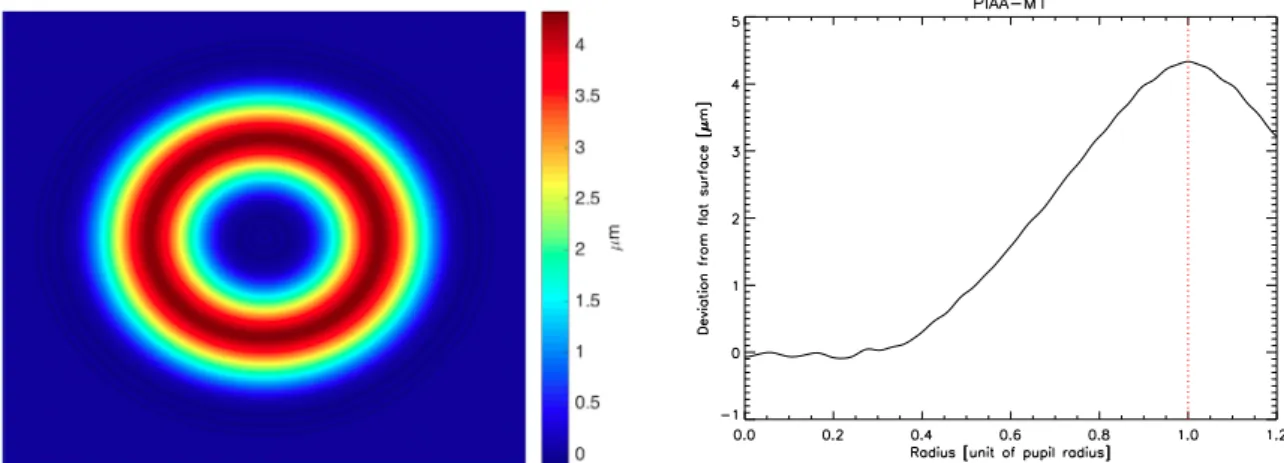
Appendix A: PIAACMC mirrors
Fig. A.1.PIAA-M1 2D simulated maps (left) and azimuthally averaged mirror sag profiles (right).
Fig. A.2.PIAA-M2 2D simulated maps (left) and azimuthally averaged mirror sag profiles (right).
The PIAACMC design consists in PIAA reflective optics, namely PIAA-M1 and PIAA-M2, a reflective FPM (discussed in the paper), and a single Lyot stop. Because the targeted PIAACMC IWA is small (1.26 λ/D) and the SPEED FoV lim-ited (from IWA to 8 λ/D), the requirement on the apodiza-tion is relaxed, and the off-axis PSF distortion moderated (see Sect. 2.2). The PIAA mirror sags resulting from the numeri-cal optimization process discussed in Sect. 2.3 are presented in Figs. A.1 and A.2 (PIAA-M1 and M2, respectively). The PIAA-M1 and PIAA-M2 sag presented (Figs.A.1andA.2) are azimuthally averaged profiles from the PIAA mirrors 2D map, express in deviation from the flat reference mirror surface. The sag depth is ∼4.3 µm for both PIAA-M1 and PIAA-M2 over the pupil radius (3.85 mm). Even though spiders are present in the pupil (see Fig. 3, left), the PIAA surfaces remain rotationally symmetric. The mirror design takes into account some SPEED optical design constraints: the size of the pupil plane is 7.7 mm, the distance between PIAA-M1 (in pupil plane) and PIAA-M2 (out of the pupil plane but in a collimated beam) is 150 mm.
Appendix B: Spare prototype
A spare FPM prototype was evaluated similarly to the proto-type discussed in the paper. The etch uniformity translates into a measured roughness quality of 3.22 nm in average with a stan-dard deviation of 1.68 nm rms. The difference of the measured 2D spare FPM depth map to the prescribed one is presented in
Fig.B.1and shows that the etch error is on average estimated at 4.5 nm with a standard deviation of 8.25 nm rms, where the depth error varies from −17 to 27 nm. The spare also demonstrates high manufacturing quality, and highlights the consistency of the process.
Fig. B.1.Histogram of the difference between measurements and