HAL Id: hal-01608102
https://hal.archives-ouvertes.fr/hal-01608102
Submitted on 19 Nov 2019
HAL is a multi-disciplinary open access
archive for the deposit and dissemination of
sci-entific research documents, whether they are
pub-lished or not. The documents may come from
teaching and research institutions in France or
abroad, or from public or private research centers.
L’archive ouverte pluridisciplinaire HAL, est
destinée au dépôt et à la diffusion de documents
scientifiques de niveau recherche, publiés ou non,
émanant des établissements d’enseignement et de
recherche français ou étrangers, des laboratoires
publics ou privés.
Distributed under a Creative Commons Attribution| 4.0 International License
Awaz Mohamed, Yogan Monnier, Zhun Mao, Guillaume Lobet, Jean-Luc
Maeght, Merlin Ramel, Alexia Stokes
To cite this version:
Awaz Mohamed, Yogan Monnier, Zhun Mao, Guillaume Lobet, Jean-Luc Maeght, et al.. An evaluation
of inexpensive methods for root image acquisition when using rhizotrons. Plant Methods, BioMed
Central, 2017, 13 (1), pp.1-13. �10.1186/s13007-017-0160-z�. �hal-01608102�
METHODOLOGY
An evaluation of inexpensive methods
for root image acquisition when using
rhizotrons
Awaz Mohamed
1*, Yogan Monnier
1, Zhun Mao
1, Guillaume Lobet
2,3, Jean‑Luc Maeght
4, Merlin Ramel
1and Alexia Stokes
1Abstract
Background: Belowground processes play an essential role in ecosystem nutrient cycling and the global carbon
budget cycle. Quantifying fine root growth is crucial to the understanding of ecosystem structure and function and in predicting how ecosystems respond to climate variability. A better understanding of root system growth is neces‑ sary, but choosing the best method of observation is complex, especially in the natural soil environment. Here, we compare five methods of root image acquisition using inexpensive technology that is currently available on the mar‑ ket: flatbed scanner, handheld scanner, manual tracing, a smartphone application scanner and a time‑lapse camera. Using the five methods, root elongation rate (RER) was measured for three months, on roots of hybrid walnut (Juglans
nigra × Juglans regia L.) in rhizotrons installed in agroforests.
Results: When all methods were compared together, there were no significant differences in relative cumulative
root length. However, the time‑lapse camera and the manual tracing method significantly overestimated the relative mean diameter of roots compared to the three scanning methods. The smartphone scanning application was found to perform best overall when considering image quality and ease of use in the field. The automatic time‑lapse camera was useful for measuring RER over several months without any human intervention.
Conclusion: Our results show that inexpensive scanning and automated methods provide correct measurements
of root elongation and length (but not diameter when using the time‑lapse camera). These methods are capable of detecting fine roots to a diameter of 0.1 mm and can therefore be selected by the user depending on the data required.
Keywords: Fine root elongation rate, Flatbed scanner, Handheld scanner, Smartphone, Time‑lapse camera
© The Author(s) 2017. This article is distributed under the terms of the Creative Commons Attribution 4.0 International License (http://creativecommons.org/licenses/by/4.0/), which permits unrestricted use, distribution, and reproduction in any medium, provided you give appropriate credit to the original author(s) and the source, provide a link to the Creative Commons license, and indicate if changes were made. The Creative Commons Public Domain Dedication waiver (http://creativecommons.org/ publicdomain/zero/1.0/) applies to the data made available in this article, unless otherwise stated.
Background
Fine root growth, defined as apical elongation over time [1–3], plays an essential role in the cycling and alloca-tion of carbon and nutrients in ecosystems [4]. Due to the inaccessibility of root systems, special techniques are required to investigate the distribution and dynam-ics of roots, as well as to estimate belowground car-bon budgets [5, 6]. Today, a number of methods have been used to estimate root growth. These methods can
be grouped into indirect and direct techniques [5, 7], both of which have advantages and drawbacks. Indi-rect methods include the use of empirical models [8], estimations of nitrogen budget and carbon budget [7]. Direct methods can be classified into (i) destructive techniques such as soil coring [9], sequential soil cor-ing [5], in-growth cores [5, 10], monoliths [11–13] and soil pits [14–16], and (ii) nondestructive in situ methods including isotope quantification [17], ‘root windows’ or rhizotrons [18–21] and minirhizotrons [3, 22, 23]. Although there are several criticisms concerning these techniques [17], rhizotrons and minirhizotrons are considered as efficient approaches and are commonly
Open Access
*Correspondence: [email protected]
1 AMAP, INRA, CNRS, IRD, Université de Montpellier, Montpellier, France
used to characterize fine root growth [24–26]. Rhizo-trons can be used to monitor (from initiation to mor-tality) specific root segments at frequent time intervals without significantly impacting root processes [15]. However, the drawbacks of these techniques are related to the cost of installation and potential changes in soil hydrology and physics, which would affect estimates of root production [7, 27].
Although many studies on root growth using minirhi-zotrons have been performed [23, 28], only a small part of the root system can be observed. Techniques for observing root growth include recording root images with digital cameras [23, 29] and rotating scanners (CID, Inc., WA, USA) [3], but equipment is expensive. Results from contrasting methods on one single species can also be highly variable [15]. The disparity in results obtained from different methods [15, 16, 30–33] has also been attributed to differences in the software used for image analysis [34–36].
The quality of images obtained from minirhizotrons and rhizotrons is extremely important for an accurate quantification of root growth through image analysis. The advantage of rhizotrons over minirhizotrons, is that a variety of inexpensive techniques exist for quantifying root growth in the field. Root systems can be measured by tracing onto a transparent plastic sheet [21], scanning with a flatbed scanner [30, 32, 34], or a handheld scanner [37]. Scanners have often been considered as the most useful tool for obtaining high quality images, but neces-sitate the use of a power supply in the field and are not yet fully automated. A detailed comparison of the dif-ferent types of scanners available has also not yet been performed, especially with regard to the scanners now available as digital applications on smartphones and tab-lets. Such a comparative study would be highly useful, especially when choosing a particular scanner for a given application and considering its cost, robustness, automa-tion and the quality of the images produced.
With regard to recording automatically images in the field, systems that are independent of an electrical power supply are not yet available, although automated flatbed scanners using 12v batteries for several days have been tested successfully in a teak (Tectona grandis) plantation in Lao PDR (Maeght, unpublished data). A fully auto-mated method for measuring root elongation in the field would permit studies of growth in poorly accessible areas or with a poor power supply, as well as detailed measure-ments of e.g. effects of the circadian clock on root growth in situ [38]. To date, most circadian clock studies have been performed in the laboratory on young plants [38,
39]. Therefore, the necessity of developing a fully auto-mated technique to measure root growth in the field is of major importance.
We compared the quality of images obtained, and the advantages or disadvantages when using several different types of scanner to measure root growth in the field. We focused on inexpensive technology that is currently avail-able on the market and so is accessible to a wide range of potential users. We assessed these scanning techniques in conjunction with a fully manual method (tracing onto a plastic sheet) and a fully automated method (time-lapse camera). Measurements were performed in hybrid walnut (Juglans nigra × regia L.) agroforests in France. Results are discussed with regard to quality, time, and cost criteria.
Methods
Comparison of methods for acquiring images
We examined five methods for acquiring images of root systems growing in rhizotrons:
Flatbed scanner
There are two common types of flatbed scanner, the CIS (Contact Image Sensor) and the CCD (Charge Coupled Device) scanners. A CIS scanner is more compact and requires less power than a CCD scanners and can usu-ally run off battery power or the power from a USB port. CCD scanners, however, provide higher-resolution scans and are capable of scanning with a good depth of field. Accordingly, we used an Epson Perfection V370, high optical resolution of 4800 dpi and CCD technology that relies on a system of mirrors and lenses to project the scanned image onto the arrays. The lid of the scanner can be removed and the scanner connected to the computer via a USB cable and to a 15 V external battery (Fig. 1). The scanner can be placed horizontally or vertically. Four horizontal scans and a resolution of 300 dpi are needed for one 50 × 50 cm rhizotron.
Handheld scanner
Scanners are lightweight (Fig. 1) and portable. We used a Vista Quest HS-500 (USA) to take images at 300 dpi. Scans were taken by moving the scanner manually down-wards on the surface of the rhizotron window. Three A4 (21 cm wide and 45 cm long) images are needed for one 50 × 50 cm surface in order to include the borders of our rhizotrons (see section on “Rhizotron installation”). The images can be saved on a micro Secure Digital memory card and the scanner requires only two AA alkaline bat-teries to function.
Manual tracing
If no electronic devices are available in the field, roots can be drawn manually with permanent color pens onto a transparent sheet placed over the rhizotron win-dow. Colors indicate different observation times and
the date of the observation is noted on the transparent sheet. Transparent sheets are then scanned in the labo-ratory using e.g. a scanner at a resolution of 300 dpi. (Sharp MX-3640 N PCL6, Canada). The manual tracing technique is not usually adequate for measuring root diameter precisely, because root diameter is not known, therefore it is not possible to select a pen with the appro-priate point thickness. Nevertheless, manual tracing can be suitable for giving an estimate of root diameter class (e.g. Mao et al. [21]). In this study, we visually estimated root thickness and tried to use pens with the correct point thickness for tracing roots, so that we could com-pare results with those from the other methods.
Smartphone scanner application
To our knowledge, smartphone scanners have not yet been used for imaging root system growth. We took images using a scanning application on a smartphone (CamScanner INTSIG Information Co., Ltd, Shanghai, China) (version 3.9.5). The CamScanner application auto-matically detects object borders and removes background noise using image-processing technologies. This software
adjusts image details, brightness and contrast and can return processed data in a JPG or PDF format. We also compared several generations of smartphone (iphone6, iphone4, and CAT® S40) to compare the performance of the smartphone technology. To use the application on a rhizotron in the field, the smartphone must be held at a given distance (68 cm in our case) and a fixed scale (tape measure) must be scanned simultaneously to calibrate the scan (Fig. 2).
Time‑lapse camera
Although often used to monitor the aerial phenology of vegetation, to our knowledge, time-lapse cameras have not yet been used for automated measurements of root growth and phenology in situ. Time-lapse cameras take photo-graphs at regular intervals, determined by the user before-hand. We tested a Cuddeback Attack (U.S.A.) time-lapse camera with flash that takes photographs in color using LED bulbs (Fig. 1). Each camera was placed on a wooden cleat at a distance of 90 cm from the rhizotron. Photographs can be taken every 30 s (in our case, we took one photo-graph at 2 a.m. and at 12 h intervals thereafter). Time-lapse Fig. 1 Four different methods were used to take images of walnut tree roots in rhizotrons: a flatbed scanner, b handheld scanner, c smartphone scanning application and d time‑lapse camera. In (d), the time‑lapse camera and rhizotron were placed into insulated boxes so that variations in temperature did not affect root growth. In the other rhizotrons, insulating material was placed over the rhizotron Plexiglas pane and removed before scanning
cameras can run for several months on an Alkaline battery (C (LR14) 1.5 V) without any human intervention.
Comparison of methods
Test 1: previously scanned and measured root systems
To allow for a fully comprehensive comparison of data between scanning, manual and automated methods, we tested each method on previously scanned and measured root system (n = 35), and likewise on a measuring tape placed in different positions (Fig. 3) of known dimensions in a rhizotron (50 × 50 cm). The scanned root systems were measured using four methods: flatbed scanner, handheld scanner, smartphone scanners and the time-lapse camera. Data were imported to the SmartRoot software.
Test 2: Measurements in rhizotrons using scanners and manual tracing
We performed measurements at Le Beil, Madic, in the Cantal region, France (45°22′7.95″N, 2°28′1.46″E) (see section on study site for more details). We started the
observations in October 2014 and fine root growth was measured every month from April to June 2015 using four methods: flatbed scanner, handheld scan-ner, smartphone scanner (iphone4) and the manual tracing (n = 25). Walnut fine roots are quite thick and so roots ≤ 4 mm in diameter were classed as fine roots.
Test 3: Measurements in rhizotrons using a time‑lapse camera
A third set of measurements was performed at Cor-mont, in the Pas de Calais region, France (50°33′27.87″N, 1°44′3.08″E), (see section on study site for more details). Root growth was monitored in six rhizotrons twice a day from May to September. We focused our study on 21 roots growing over a period of 10 days for un easier understanding and comparison of results.
Image analysis
Once images of root growth had been acquired, we con-ducted analyses of images using the semi-automated Fig. 2 Examples of images taken by a flatbed scanner, b handheld scanner, c manual tracing on a transparent sheet and d smartphone scanner in the same rhizotron at the same date
SmartRoot software [36]. SmartRoot is an operating system independent freeware based on ImageJ and uses cross-platform standards (RSML, SQL, and Java) for communication with data analysis softwares [36, 40]. Before analyzing roots with SmartRoot, when necessary, images need “stitching” together (e.g. with Adobe Pho-toshop CS3 software), if several have been taken (when the rhizotron surface area was greater than the field of the scanner). In our case, we transformed all images to 8 bit gray scale and then inverted them using ImageJ software so that roots were darker than the background of the image. The length and diameter of each root pro-duced during one interval time (i.e. one month) were calculated for each rhizotron. Before analyzing a new sequence of images, SmartRoot provides the user with an icon to import the traces of the same roots from the previous image data file to superimpose them on this new image, which helps root elongation. This pre-ceding image also helps determine whether the root is live (usually cream in color) or in a phase of senescence (shriveled, transparent or turning black) [3, 41–44]. We declared a root dead when it became completely black in color.
Study sites
We measured fine root growth in situ in two agrofor-ests. One was located at Le Beil, Madic, in the Cantal region, France (45°22′7.95″N, 2°28′1.46″E) at an eleva-tion of 530 m, hereafter termed ‘continental’ climate. The agroforest comprised three transplanted tree spe-cies: hybrid walnut (Juglans major (MJ209) × Juglans
regia L.), cherry (Prunus avium L.), sycamore maple
(Acer pseudoplatanus L.) at 12 m × 8 m tree spacing and intercropped with permanent pasture (ovine or bovine pasture). All national guidelines and legisla-tion were complied with when using these cultivars. Mean diameter at breast height (DBH) of all walnut trees at the site was 0.20 ± 0.02 m and mean height was 12.09 ± 1.30 m. Data are mean ± standard error. All trees were planted in 1994 at a density of 100 trees ha−1. Hybrid walnut at this study site starts leafing in early May and shedding in mid-November. The cli-mate is continental with a mean annual temperature of 9.95 °C and a mean annual rainfall of 1174 mm (Météo France). The soil is silty and not deep, attaining an average maximum depth to bedrock of approximately 110 cm, on a 5°–10° slope.
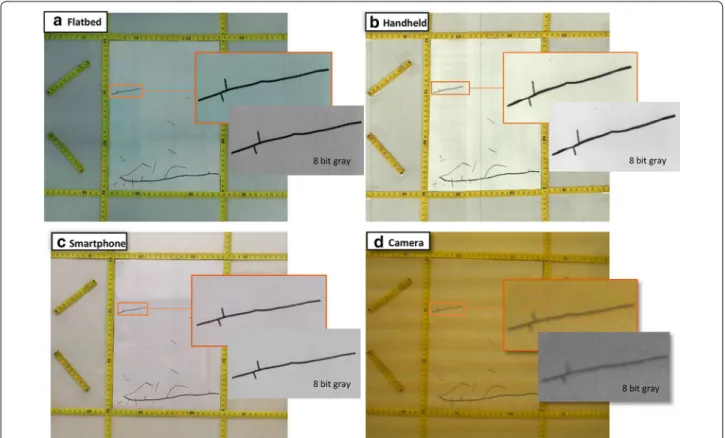
Fig. 3 We tested the accuracy of a flatbed scanner, b handheld scanner, c smartphone scanner and d time‑lapse camera by measuring root systems of known dimensions in the laboratory. A zoom of one root shows the quality of the images taken using each method before and after transforming the image to an 8 bit gray scale
The second agroforest was located at Cormont, in the Pas de Calais region, France (50°33′27.87″N, 1°44′3.08″E), hereafter termed ‘oceanic’ climate. The site is at an altitude of 40 m. The climate is oceanic, with a mean annual temperature of 11 °C and a mean annual rainfall of 777.9 mm (Météo France). Tree species comprised hybrid walnut (Juglans nigra × regia L.) and Maple (Acer
laurinum L.) at 13 × 7.5 m tree spacing intercropped
permanent pasture (ovine pasture). All trees were planted in 1999. The soil is silty clay and <2.5 m deep. The site is next to La Dordonne River. Mean DBH of walnut trees at the site was 0.30 ± 0.03 m and mean height was 14.75 ± 3.50 m. Hybrid walnut at this site starts leafing in early May and shedding in mid-November.
Rhizotron installation
In the continental agroforest (Madic), we dug eight (1 m × 1 m × 1 m) trenches by hand in three rows of trees. Each trench was at a distance of 2 m from the near-est tree stem. Eight rhizotrons, or root windows (50 cm long × 50 cm wide × 0.5 cm thick), were installed. In the oceanic agroforest (Cormont), soil was deep (4 m) and comprised four (2 m long × 1 m wide × 2 m depth) trenches in one row of trees placed at 2 m from the near-est tree stem. One rhizotron was installed on two oppos-ing faces of the trench (n = 8 rhizotrons in total). All rhizotrons were placed vertically at an angle of 15° from the face of the profile. This angle will permit the roots to grow downwards due to positive geotropism [21, 41]. Where the rhizotrons were to be placed on the trench, we gently removed the soil to make a flat surface and cut all roots on the profile with secateurs. The soil removed dur-ing the diggdur-ing of the trenches was kept aside, and then sieved through a 5 mm size sieve and air-dried for several hours. The sieved and air-dried soil was then poured into the space between the window and the soil profile and slowly compacted using a wooden plank. Each rhizotron was covered with foil backed felt insulation and black plastic sheeting to protect roots from light and air tem-perature variations. All trenches were then covered with wooden boards and corrugated plastic to avoid damage from passing animals and to prevent direct rainfall and sunlight onto the rhizotrons. In the first three months after installation, no root growth was recorded to avoid over estimations of root growth [17].
Root indicator calculation
We used the following method to estimate root elonga-tion rate: individual root growth was evaluated by calcu-lating the difference between the root length at t−1 and at t. To determine the daily root elongation rate (RER), the mean of all individual root lengths produced between time t and t−1 was divided by the duration of the
corresponding period [3]. According to the literature, the characterization of dead roots is not obvious, particularly behind a transparent window [42]. We considered a root as live when it had a cream color and dead when it had turned black with no growth between two or more suc-cessive sessions until the last observation date occurred [3].
The equation we used to calculate RER was:
where, RERt−1, t is the daily root elongation rate (in mm/
day) from inventory time t-1 to t; lent−1 and lent are the
lengths of the root n at inventory time t−1 and t, respec-tively; pt−1, t is the period in days between inventory time
t−1 and t.
At the oceanic site, as we took two photos per day (using the time-lapse camera), we aimed at testing whether our method could be used to estimate differ-ences in RER during the day and at night [38]. Root elon-gation during 12 h during the daytime and night was calculated using:
where REday and REnight are root elongation lengths (in mm) during 12 h during daytime and night, repectively;
lentd1, lentn1 and lentd2 are the lengths of a root
succes-sively observed at daytime 1 (2 pm), night time (2 am) and daytime 2 (2 pm), respectively.
Semi‑quantitative scoring decision matrix
Three criteria were taken into account to evaluate the five methods: (i) accuracy (image quality and resolu-tion, deformation and contrast), (ii) effectiveness (time, expenditure and labour) and (iii) adaptability (ease of use in field and necessity of accessories).
Statistical analysis
Root length and diameter obtained using each method were correlated with the previously scanned and meas-ured root systems, to determine which method gave the best fit. Similarly, results from different generations of smartphones were compared. We then calculated rela-tive values for cumularela-tive length, mean diameter and RER, with regard to the flatbed scanner (reference value), which we assumed gave the most accurate dimensions [30, 32]. To calculate the relative value, we divided the value obtained for individual roots (using each method) by that obtained using the flatbed scanner.
A Shapiro–Wilk test was performed before each test to ensure if the investigated indicator followed a normal or non-normal distribution. Homogeneity of variances
RERt−1, t =
lent− lent−1 Pt-1, t
REday= lentn1− lentd1 REnight= lentd2− lentn1
was checked. For data not normally distributed, analyses were followed by a Kruskal–Wallis Test for each factor. A post hoc analysis between root diameters was performed using the Nemenyi test of Kruskal–Wallis at p < 0.05 to determine which levels of the independent variable differ from every other level. All analyses were performed using R software, Version 2.15.3 (R Development Core Team 2013) at a significance level of <0.05.
Results
Test 1: Previously scanned and measured root systems When images from the different generations of smart-phone were compared, no significant differences were found with regard to root length and diameter between any models. When all methods (except for manual trac-ing) were compared together, there were no significant differences in the relative cumulative length of previ-ously scanned and measured root systems. However, the time-lapse camera significantly overestimated the relative mean diameter of previously scanned and measured root systems compared to the other three methods (p < 0.001, Fig. 4). Although our time-lapse cameras had a high reso-lution (20 megapixels), this overestimation was likely due to the low optical resolution leading to a poorer quality of image. The SmartRoot software estimates the diameter of
the root by diagonally measuring nodes along each root, but if the image is of low quality, SmartRoot will not be able to detect and distinguish correctly the border of the root (Fig. 3).
Test 2: Measurements in rhizotrons using scanners and manual tracing
There were no significant differences in relative RER between the four scanning methods (Fig. 5). However, manual tracing on transparent sheets significantly over-estimated the relative mean diameter of roots (p < 0.001, Fig. 6). This overestimation was due partly to human error, as the Plexiglas window and the plastic sheet resulting in multiple layers, obscuring the root outlines, as well as the pens being either too thick or too fine for matching root diameter exactly.
Test 3: Measurements in rhizotrons using a time‑lapse camera
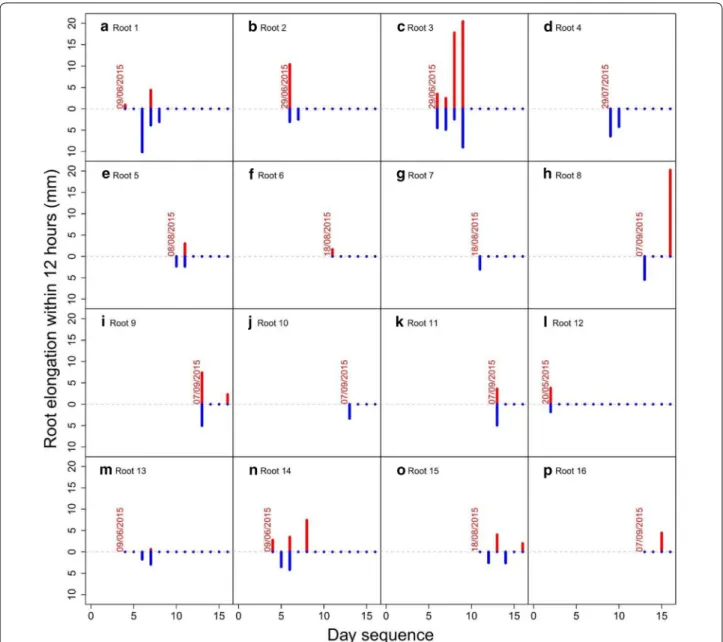
Some individual roots were found to elongate up to 20 mm in a single day (Fig. 7) and when mean elon-gation was cumulated over a period of 10 days, up to 48 mm of growth occurred (Fig. 8). When comparing root elongation between day and night (with a period
Fig. 4 Comparison of the relative mean diameter (mm) of roots from root systems of known dimensions. The time‑lapse camera signifi‑ cantly overestimated the diameter of roots compared to the three scanning methods (p < 0.001). Each circle represents diameter data for one root. Differences in shading intensity of circles indicate that one or more data points are superimposed. The lower edge of the box corresponds to the 25th percentile (Q1) data point, while the top edge
of the box corresponds to the 75th percentile data point (Q3). The line within the box represents the median and the whiskers indicate the
range of the data. The two horizontal dashed lines represent an interval of 10% above and below the median of the reference method (flat‑ bed scanner). Different letters above the boxplots indicate statistically significant differences (p < 0.05) between methods
Fig. 5 Comparison of the relative root elongation rate (RER) between the different image acquisition methods. Each circle represents RER for one root. Differences in shading intensity of circles indicate that one or more data points are superimposed. There were no significant differences in RER between the four methods. Each circle represents diameter data for one root. Differences in shading intensity of circles indicate that one or more data points are superimposed. The lower
edge of the box corresponds to the 25th percentile (Q1) data point,
while the top edge of the box corresponds to the 75th percentile data point (Q3). The line within the box represents the median and the
whiskers indicate the range of the data. The two horizontal dashed lines represent an interval of 10% above and below the median of the
reference method (flatbed scanner). Different letters above the boxplots indicate statistically significant differences (p < 0.05) between meth‑ ods
of 12 h between the two measurements) no overall sig-nificant differences were found over the 10 day period examined (Fig. 7) or over the whole lifetime of individual roots (Fig. 8). This method therefore also allowed us to estimate differences in root elongation between day and night.
Discussion
Studies on root growth have been numerous over the last decade and a significant progress in evaluating root mor-phology has been made. However, research remains chal-lenging and costly especially in the natural environment. Many nondestructive methods, such as rhizotrons [18–
21] and minirhizotrons [3, 22, 23] have been developed to overcome some of the limitations of observing root sys-tems in the natural environment and to offer direct and repeated observations of root system morphology. Image quality obtained from rhizotrons and minirhizotrons is crucial for an accurate quantification of root growth through image analysis.
We showed that all five methods for imaging root sys-tems can be used to determine root length, but that if accurate measurements of root diameter are required, a scanner must be used, and not the time-lapse camera nor manual tracing. The smartphone scanning application
was found to be perform best overall when considering image quality. Images were sharply contrasted, of high resolution and deformation was minimal. The applica-tion was free for smartphones and did not need any accessories. Only a short amount of time was spent in the field acquiring data and image treatment can be car-ried out directly in the application (Table 1). Another advantage of the smartphone is its genericity and wide community of developers and any of the models tested could be used, with no consequences for results obtained. Many third party hardwares (such as additional lenses, holders, batteries) and software tools (automated cloud backup, automated geographical tagging, etc.) are avail-able, often at minimal cost. It should also be noted that the quality of the smartphone camera and the lifetime of batteries have been constantly improved by manu-facturers, probably at a much faster rate than for spe-cialized equipment. In contrast, the flatbed scanner has many accessories so it is not easily transportable and needs four images for one 50 × 50 cm rhizotron, there-fore much time is needed in the laboratory to merge images before analyzing them. Additionally, automatic flatbed scanners have not been developed yet. Thus, the scanner cannot automatically acquire images in the field over a long period because of the need for a power sup-ply in the field. However, the method was rapid, easy to use and inexpensive. Image quality was very high as also found by other users [30, 32, 45] (Table 1). Likewise, the advantage of the handheld scanner is that it is quick, portable and the images are of good quality [37]. Three images were needed for one 50 × 50 cm surface with this method, and the major constraint with this scanner is the size of images (29.7 × 21.0 cm), so more time is needed for merging images manually before analyzing them (Table 1). The distinct advantage of tracing onto transparent sheets is their inexpensive price (Table 1), but inaccuracies due to human error and optical effects occur, resulting in an overestimation of root diameter. As scanning methods are not yet automated for use in the field, the main advantage of the time-lapse camera is that it can be left in place for several months without any manual intervention and it is relatively inexpensive (Table 1). However, the quality of images taken with the time-lapse cameras was poor and a certain amount of reflection occurs due to the flash, leading to an ulti-mate overestimation of root diameter. The low quality of images taken is because the lenses have less optical reso-lution compared to e.g. a smartphone camera, resulting in blurred photos. The optical resolution represents the physical resolution to resolve detail in the object that is being imaged via an imaging system. Smartphone cam-eras and digital camcam-eras have been developed to be capa-ble of defining the smallest discernicapa-ble detail in an image, Fig. 6 Comparison of the relative mean diameter (mm) of roots
growing in rhizotrons in situ. Manual drawing on transparent sheets significantly overestimated the mean diameter of roots compared to the three scanning methods (p < 0.001). Each circle represents diam‑ eter data for one root. Differences in shading intensity of circles indi‑ cate that one or more data points are superimposed. The lower edge
of the box corresponds to the 25th percentile (Q1) data point, while
the top edge of the box corresponds to the 75th percentile data point (Q3). The line within the box represents the median and the whiskers indicate the range of the data. The two horizontal dashed lines repre‑ sent an interval of 10% above and below the median of the reference method (flatbed scanner). Different letters above the boxplots indicate statistically significant differences (p < 0.05) between methods
resulting in a better spatial resolution which states the clarity of an image and this resolution refers to the num-ber of pixels used to construct the image. This spatial resolution depends on properties of the system creating the image, not just the pixel resolution (pixels per inch). For example, in our study, although the smartphone had less resolution (5 megapixels) than the time-lapse camera (20 megapixels), it produced a better quality of image. This quality is because the smartphone imaging system can detect spatial differences and this spatial resolution can be influenced by diffraction, aberrations, imperfect
focus, lens, size of the sensor and other imaging system components. Furthermore, as the automated time-lapse camera was programmed to autofocus mode, the cam-era may focus on the wrong part of the image depend-ing on the environment where the image is captured. We successfully used the time-lapse camera to compare root elongation during the day and at night, but no significant differences were found. Nevertheless, from Figs. 7 and 8, it can be seen that some roots grow mostly at night and others grow mostly during the day, although the reason for this disparity between roots is not known.
Fig. 7 Root elongation reached 20 mm day−1 in certain roots. No significant differences were found in elongation between day and night over an
interval of 10 days measured using a time‑lapse camera. The red color represents root elongation during the day (data above the 0 on y axis) and the blue color represents root elongation during the night (data below the 0 on y axis). If no bars are present, roots did not grow during that period (even though they were still alive). The date above the first data point indicates when root growth started
To the best of our knowledge, the smartphone scanning application and an automated time-lapse camera have never been used to measure root growth in the field. Both methods are inexpensive and easy to use, especially com-pared to more sophisticated techniques such as minirhi-zotron scanners. The advantage of rhiminirhi-zotrons over minirhizotrons is that the above variety of inexpensive techniques exist worldwide for quantifying root growth
in the field. The equipment needed to observe and record color video pictures of roots in minirhizotrons [9, 46] is commercially available at a cost of approximately 10,000 euros for one circular scanner [3] or one camera video. Additionally, the field of vision in a minirhizotron is small (20 × 20 cm) and is not suitable for heterogeneous for-est stands, where the spatial position of roots of differ-ent diameter classes can lead to root-free patches in the Fig. 8 Root elongation (mm) in the daytime and at night, estimated using a time‑lapse camera. Symbols: circles root elongation during the day,
triangles root elongation during the night. For (a–s), each graph represents the elongation rate of one root randomly selected from a rhizotron
soil. The 50 × 50 cm rhizotrons we used in our study enable more tree roots to be captured in one image, thus increasing statistical robustness.
Conclusion
We tested several methods for monitoring root growth and acquiring images in rhizotrons in the field. Our results show that scanners and time-lapse cameras pro-vide correct measurements of root growth and length in the field but users should be aware of possible arti-facts. Time-lapse cameras overestimate root diameter but are useful for taking frequent images of root elon-gation in the field over several months, without any manual intervention. Taking into account image accu-racy, time spent and cost, we found the smartphone scanner to be the optimal method for monitoring root growth in the field. Future generations of smartphones could scan images and transfer data automatically, with a minimum of human intervention, thus improving the methodology. Likewise, the development of digital time-lapse cameras with a higher optical resolution, or similar to the optical resolution of smartphones, should also be undertaken.
Abbreviations
RER: root elongation rate; RE: root elongation.
Authors’ contributions
AM, YM and AS designed the study. AM, YM, AS, ZM and MR conducted field‑ work. AM, ZM and GL contributed to data analysis. AM and AS wrote the paper with contributions from YM, ZM, JLM and GL. All authors read and approved the final manuscript.
Author details
1 AMAP, INRA, CNRS, IRD, Université de Montpellier, Montpellier, France. 2 Earth
and Life Institute, Université catholique de Louvain, 1348 Louvain‑la‑Neuve, Belgium. 3 Agrosphere‑IBG3, Forschungszentrum Juelich GmbH, 52428 Juelich,
Germany. 4 iEES‑Paris (IRD, Sorbonne Universités, UPMC Univ Paris 06, CNRS,
INRA, UPEC, Université Paris Diderot), Soils and Fertilizers Research Institute (SFRI), Duc Thang Ward, Bac Tu Liem District, IRD, Hanoi, Vietnam.
Acknowledgements
Thanks are due to François Pailler and Stéphane Fourtier (INRA) for techni‑ cal assistance, to Camille Béral (Agroof ) for help finding field sites, to Jérôme Nespoulous (INRA) for his help with field and laboratory work and to the farm‑ ers M. Queuille and M. Becue for letting us work in their agroforests.
Availability of data and materials
The datasets generated and/or analysed during the current study are available in the [Zenodo] repository, [https://doi.org/10.5281/zenodo.266959]
Competing interests
The authors declare that they have no competing interests.
Funding
Funding for a Ph.D. bursary was provided by Campus France and the Kurdish Institute, France (AM) and fieldwork was funded by the FOARDAPT pro‑ ject, INRA metaprogram AAFCC (Adaptation of Agriculture and Forests to Climate Change), France.
Received: 12 August 2016 Accepted: 22 February 2017
References
1. Barley KP, Greacen EL. Mechanical resistance as a soil factor influenc‑ ing the growth of roots and underground shoots. In: Norman AG, editors. Advances in agronomy, vol 19. Academic Press; 1967. p. 1–43. doi:10.1016/S0065‑2113(08)60731‑2.
2. Jourdan C, Silva EV, Gonçalves JLM, Ranger J, Moreira MR, Laclau J‑P. Fine root production and turnover in Brazilian Eucalyptus plantations under contrasting nitrogen fertilization regimes. For Ecol Manag. 2008;256:396– 404. doi:10.1016/j.foreco.2008.04.034.
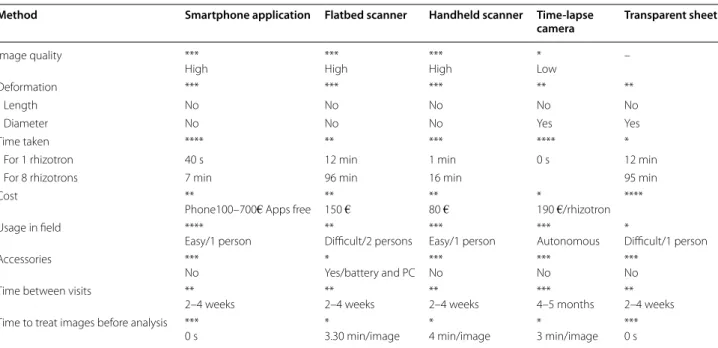
Table 1 Multiple criteria evaluation/semi-quantitative scoring decision matrix
**** Optimal, *** good, ** fair, * poor, – not applicable
Method Smartphone application Flatbed scanner Handheld scanner Time‑lapse
camera Transparent sheet
Image quality ***
High ***High ***High *Low –
Deformation *** *** *** ** **
Length No No No No No
Diameter No No No Yes Yes
Time taken **** ** *** **** *
For 1 rhizotron 40 s 12 min 1 min 0 s 12 min
For 8 rhizotrons 7 min 96 min 16 min 95 min
Cost **
Phone100–700€ Apps free **150 € **80 € *190 €/rhizotron **** Usage in field ****
Easy/1 person **Difficult/2 persons ***Easy/1 person ***Autonomous *Difficult/1 person
Accessories ***
No *Yes/battery and PC ***No ***No ***No Time between visits **
2–4 weeks **2–4 weeks **2–4 weeks ***4–5 months **2–4 weeks Time to treat images before analysis ***
3. Germon A, Cardinael R, Prieto I, Mao Z, Kim J, Stokes A, Dupraz C, Laclau JP, Jourdan C. Unexpected phenology and lifespan of shallow and deep fine roots of walnut trees grown in a silvoarable Mediterranean agrofor‑ estry system. Plant Soil. 2016;401:409–26. doi:10.1007/s11104‑015‑2753‑5. 4. Gill RA, Jackson RB. Global patterns of root turnover for terrestrial ecosys‑
tems. New Phytol. 2000;147:13–31. doi:10.1046/j.1469‑8137.2000.00681.x. 5. Vogt KA, Vogt DJ, Bloomfield J. Analysis of some direct and indirect
methods for estimating root biomass and production of forests at an ecosystem level. In: Box J Jr editor.Root demographics and their efficiencies in sustainable agriculture, grasslands and forest ecosystems, vol 82. Springer; 1998. p. 687–720. Dev Plant Soil Sci. doi:10.1007/978‑94‑011‑5270‑9_61.
6. Maeght J‑L, Clément C, Gonkhamdee S, Isarangkool Na Ayutthaya S, Stokes A, Pierret A. Seasonal patterns of fine root production and turno‑ ver in a mature rubber tree (Hevea brasiliensis Müll. Arg.) stand—differen‑ tiation with soil depth and implications for soil carbon stocks. Front Plant Sci. 2015; 6. doi:10.3389/fpls.2015.01022.
7. Hendricks JJ, Hendrick RL, Wilson CA, Mitchell RJ, Pecot SD, Guo D. Assessing the patterns and controls of fine root dynamics: an empirical test and methodological review. J Ecol. 2006;94:40–57. doi:10.1111/j.1365‑2745.2005.01067.x.
8. Kurz WA, Beukema SJ, Apps MJ. Estimation of root biomass and dynamics for the carbon budget model of the Canadian forest sector. Can J For Res. 1996;26:1973–9. doi:10.1139/x26‑223.
9. Box JE, Ramsuer EL. Minirhizotron wheat root data: comparisons to soil core root data. Agron J. 1993;85:1058–60. doi:10.2134/agronj1993.000219 62008500050019x.
10. Makkonen K, Helmisaari H‑S. Assessing fine‑root biomass and production in a Scots pine stand—comparison of soil core and root ingrowth core methods. Plant Soil. 1999;210:43–50. doi:10.1023/a:1004629212604. 11. Majdi H, Smucker AJM, Persson H. A comparison between minirhizotron
and monolith sampling methods for measuring root growth of maize (Zea mays L.). Plant Soil. 1992;147:127–34. doi:10.1007/bf00009378. 12. Arnone JA, Zaller JG, Spehn EM, Niklaus PA, Wells CE, Körner C. Dynamics
of root systems in native grasslands: effects of elevated atmospheric CO2. New Phytol. 2000;147:73–85. doi:10.1046/j.1469‑8137.2000.00685.x. 13. Gautam TP, Mandal TN. Effect of disturbance on fine root biomass in
the tropical moist forest of eastern Nepal. Nepal J Biosci. 2013;2:10–6. doi:10.1186/s40663‑016‑0070‑y.
14. Heeraman DA, Juma NG. A comparison of minirhizotron, core and mono‑ lith methods for quantifying barley (Hordeum vulgare L.) and faba bean (Vicia faba L.) root distribution. Plant Soil. 1993;148:29–41. doi:10.1007/ bf02185382.
15. Yuan ZY, Chen HYH. Indirect methods produce higher estimates of fine root production and turnover rates than direct methods. PLoS ONE. 2012;7:e48989. doi:10.1371/journal.pone.0048989.
16. Addo‑Danso SD, Prescott CE, Smith AR. Methods for estimating root biomass and production in forest and woodland ecosystem carbon studies: a review. For Ecol Manag. 2016;359:332–51. doi:10.1016/j. foreco.2015.08.015.
17. Strand AE, Pritchard SG, McCormack ML, Davis MA, Oren R. Irreconcilable differences: fine‑root life spans and soil carbon persistence. Science. 2008;319:456–8. doi:10.1126/science.1151382.
18. Bates G. A device for the observation of root growth in the soil. Nature. 1937;139:966–7.
19. Reich P, Teskey R, Johnson P, Hinckley T. Periodic root and shoot growth in oak. For Sci. 1980, 26:590–598. https://www.researchgate.net/ publication/233573117_Periodic_Root_and_Shoot_Growth_in_Oak. 20. Burke M, Raynal D. Fine root growth phenology, production, and turnover
in a northern hardwood forest ecosystem. Plant Soil. 1994;162:135–46. doi:10.1007/bf01416099.
21. Mao Z, Bonis M‑L, Rey H, Saint‑André L, Stokes A, Jourdan C. Which pro‑ cesses drive fine root elongation in a natural mountain forest ecosystem? Plant Ecol Divers. 2013;6:231–43. doi:10.1080/17550874.2013.788567. 22. West JB, Espeleta JF, Donovan LA. Fine root production and turnover across a
complex edaphic gradient of a Pinus palustris–Aristida stricta savanna ecosys‑ tem. For Ecol Manag. 2004;189:397–406. doi:10.1016/j.foreco.2003.09.009. 23. Steinaker DF, Wilson SD, Peltzer DA. Asynchronicity in root and shoot phe‑
nology in grasses and woody plants. Glob Change Biol. 2010;16:2241–51. doi:10.1111/j.1365‑2486.2009.02065.x.
24. Eissenstat DM, Caldwell MM. Competitive ability is linked to rates of water extraction. Oecologia. 1988;75:1–7. doi:10.1007/bf00378806.
25. Hendrick RL, Pregitzer KS. Applications of minirhizotrons to under‑ stand root function in forests and other natural ecosystems. Plant Soil. 1996;185:293–304. doi:10.1007/bf02257535.
26. Majdi H. Root sampling methods ‑ applications and limitations of the minirhi‑ zotron technique. Plant Soil. 1996;185:255–8. doi:10.1007/bf02257530. 27. Taylor HM, Upchurch DR, McMichael BL. Applications and limitations
of rhizotrons and minirhizotrons for root studies. In: Keister DL, Cregan PB, editors. The rhizosphere and plant growth: papers presented at a symposium held May 8–11, 1989, at the Beltsville Agricultural Research Center (BARC), Beltsville, MD. Dordrecht: Springer; 1991. p. 91–97. doi:10.1007/978‑94‑011‑3336‑4_10.
28. Tanner SC, Reighard GL, Wells CE. Soil treatments differentially affect peach tree root development and demography in a replant site. In: Infante R, editor. Proceedings of the VIth international peach symposium. 2006. p. 381–387. Acta Hortic.//WOS:000242404500055.
29. Fukuzawa K, Shibata H, Takagi K, Satoh F, Koike T, Sasa K. Temporal varia‑ tion in fine‑root biomass, production and mortality in a cool temperate forest covered with dense understory vegetation in northern Japan. For Ecol Manage. 2013;310:700–10. doi:10.1016/j.foreco.2013.09.015. 30. Dong S, Neilsen D, Neilsen GH, Weis M. A scanner‑based root image acquisi‑
tion technique for measuring roots on a rhizotron window. HortScience. 2003; 38:1385–1388. http://hortsci.ashspublications.org/content/38/7/1385. abstract.
31. Kern CC, Friend AL, Johnson JM‑F, Coleman MD. Fine root dynamics in a developing Populus deltoides plantation. Tree Physiol. 2004;24:651–60. doi:10.1093/treephys/24.6.651.
32. Dannoura M, Kominami Y, Oguma H, Kanazawa Y. The development of an optical scanner method for observation of plant root dynamics. Plant Root. 2008;2:14–8. doi:10.3117/plantroot.2.14.
33. Adu MO, Chatot A, Wiesel L, Bennett MJ, Broadley MR, White PJ, Dupuy LX. A scanner system for high‑resolution quantification of variation in root growth dynamics of Brassica rapa genotypes. J Exp Bot. 2014;. doi:10.1093/jxb/eru048.
34. Himmelbauer ML, Loiskandl AW, Kastanek AF. Estimating length, average diameter and surface area of roots using two different Image analyses systems. Plant Soil. 2004;260:111–20. doi:10.1023/b:p lso.0000030171.28821.55.
35. Pierret A, Gonkhamdee S, Jourdan C, Maeght JL. IJ_Rhizo: an open‑ source software to measure scanned images of root samples. Plant Soil. 2013;373:531–9. doi:10.1007/s11104‑013‑1795‑9.
36. Lobet G, Pagès L, Draye X. A novel image‑analysis toolbox enabling quantitative analysis of root system architecture. Plant Physiol. 2011; 157:29–39. http://www.plantphysiol.org/content/157/1/29.abstract. 37. Pan WL, Bolton RP, Lundquist EJ, Hiller LK. Portable rhizotron and
color scanner system for monitoring root development. Plant Soil. 1998;200:107–12. doi:10.1023/a:1004277118087.
38. Halter R, Sands R, Nambiar EKS, Ashton DH. Elongation of Eucalyptus roots during day and night. Tree Physiol. 1996;16:877–81. doi:10.1093/ treephys/16.11‑12.877.
39. Willaume M, Pagès L. How periodic growth pattern and source/sink rela‑ tions affect root growth in oak tree seedlings. J Exp Bot. 2006;57:815–26. doi:10.1093/jxb/erj059.
40. Mathieu L, Lobet G, Tocquin P, Périlleux C. “Rhizoponics”: a novel hydroponic rhizotron for root system analyses on mature
Arabi-dopsis thaliana plants. Plant Methods. 2015;11:1–8. doi:10.1186/ s13007‑015‑0046‑x.
41. Huck MG, Taylor HM. The rhizotron as a tool for root research. In: Brady NC, editor. Advances in agronomy, vol 35. Academic Press; 1982. p. 1–35. doi:10.1016/S0065‑2113(08)60320‑X.
42. Tierney GL, Fahey TJ. Fine root turnover in a northern hardwood forest: a direct comparison of the radiocarbon and minirhizotron methods. Can J For Res. 2002;32:1692–7. doi:10.1139/x02‑123.
43. Anderson L, Comas L, Lakso A, Eissenstat D. Multiple risk factors in root survivorship: a 4‑year study in Concord grape. New Phytol. 2003;158:489– 501. doi:10.1046/j.1469‑8137.2003.00757.x.
44. Graefe S, Hertel D, Leuschner C. Estimating fine root turnover in tropical forests along an elevational transect using minirhizotrons. Biotropica. 2008;40:536–42.
• We accept pre-submission inquiries
• Our selector tool helps you to find the most relevant journal
• We provide round the clock customer support
• Convenient online submission
• Thorough peer review
• Inclusion in PubMed and all major indexing services
• Maximum visibility for your research Submit your manuscript at
www.biomedcentral.com/submit
Submit your next manuscript to BioMed Central
and we will help you at every step:
45. Dauer JM, Withington JM, Oleksyn J, Chorover J, Chadwick OA, Reich PB, Eissenstat DM. A scanner‑based approach to soil profile‑wall mapping of root distribution. Dendrobiology. 2009;62:35–40.
46. Patena G, Ingram KT. Digital acquisition and measurement of pea‑ nut root minirhizotron images. Agron J. 2000;92:541–4. doi:10.2134/ agronj2000.923541x.