HAL Id: hal-01352998
https://hal.archives-ouvertes.fr/hal-01352998
Submitted on 4 Dec 2020
HAL is a multi-disciplinary open access
archive for the deposit and dissemination of
sci-entific research documents, whether they are
pub-lished or not. The documents may come from
teaching and research institutions in France or
abroad, or from public or private research centers.
L’archive ouverte pluridisciplinaire HAL, est
destinée au dépôt et à la diffusion de documents
scientifiques de niveau recherche, publiés ou non,
émanant des établissements d’enseignement et de
recherche français ou étrangers, des laboratoires
publics ou privés.
Sensor Data Quality for Geospatial Monitoring
Applications
Claudia Gutierrez Rodriguez, Sylvie Servigne
To cite this version:
Claudia Gutierrez Rodriguez, Sylvie Servigne. Sensor Data Quality for Geospatial Monitoring
Appli-cations. AGILE 2012, 15th Internationale Conference on Geographic Information Science„ Apr 2012,
Avignon, France. pp.111-116, ISBN: 978-90-816960-0-5. �hal-01352998�
1
Introduction
Embedded with mobility, communication and processing capabilities, sensors and sensor networks are more and more employed in numerous applications domains such as military, environmental, healthcare, etc. More particularly, the use of sensors in geospatial applications like environmental monitoring (i.e. floodings, volcanoes...), allows a better interpretation of the real world and supports crisis and risk management. However, and despite a strong interest from geospatial domain, the integration of sensors and sensor networks raises new technical and data management challenges. In fact, sensor data turns imprecise and uncertain considering the hardware restrictions of sensor devices and the collection of data in hostile environments at variable rates and positions. These backwards thus necessitate for quality mechanisms capable to guarantee the achievement of
monitoring applications and assist expert in decision making. Data quality management has been strongly integrated on
geographic domain. Actually, thanks to research and standardisation programs in this domain [3, 5], Geographic Information Systems (GIS) are able to assess and improve the quality of geographic data. Moreover, other international organizations as Open Geospatial Consortium (OGC) or the National Oceanic and Atmospheric Administration (NOAA), have also recently raised the importance of sensor data quality issue and strongly advice to perform further studies.
In this paper, we address sensor data quality issue with an approach inspired both by current methodologies and approaches managing data quality. This approach focuses on the specificities of sensor data in a monitoring context.
The rest of this document is organized as follows: Section 2 introduces an overview of our research context. Section 3 details the specificities of sensor data and monitoring systems. Section 4 introduces our approach for sensor data quality analysis. In Section 5 we describe a proposal of visualization
interface for sensor data quality discovery. We conclude in Section 6.
2
Overview
For years, data quality characterizes a key problem for all kind of organizations [15]. Actually, emerging applications and manipulating sensor data, like environmental monitoring, also reveal this important issue. Considering monitoring as a primary key on environmental crisis management system, an early and reliable detection of critical events is crucial for the achievement of such kind of systems. Environmental monitoring thus requires an efficient acquisition of information coming from sensors (spread over large areas), the interpretation of complex observation patterns at different temporal and spatial scales, as well as reliable and understandable results. These facts led us to wonder how to evaluate and provide users with quality information. We believe that such complementary information can support users (i.e. environmental scientists, urban planners...) to make decisions in a more trustworthy way.
According to the literature, data quality issue has been the subject of numerous studies, especially for Information Systems [7]. As a result, several models and methodologies oriented to manage quality in different application domains (e.g. medical, geographic…) have been proposed [2]. Also, evaluation and improvement techniques have been subject of standardizations and being the core of data management approaches as for Geographic Information Systems [3, 4]. We note that these studies provide excellent quality approaches, enhancing the basic perception of data quality and mainly focused on so-called traditional applications, where static data is managed in databases management systems or datawarehouses. Withal, we identify that such approaches do
I3S, Nice Sophia-Antipolis University,
930 Route des Colles, BP 145 06903 Sophia Antipolis, France
LIRIS – UMR 5205, INSA de Lyon,
Université de Lyon, 69621 Villeurbanne, France [email protected]
Abstract
Nowadays, emerging applications in the geographic domain, exploit more and more geospatial data coming from sensors like the environmental monitoring systems. Increasingly, this kind of systems reveals their concern about the quality of discovered data. Considering monitoring as a main component of environmental crisis management system, an early and reliable detection of critical events is crucial. Thus, in order to make meaningful decisions with sensor data, the quality of data exploited through the system must be ensured. In this paper, we address this issue with an approach oriented to define and manage the quality of sensor data for geospatial applications, especially in a monitoring context. More specifically, our approach proposes a study and modelling of quality properties with considering sensor data specificities and the collateral factors impacting its quality. In order to qualify data, we adopt a product-oriented view supported by the management of metadata in real time; we analyze sensor data from acquisition to discovery. We also propose a visualization interface for sensor data quality discovery.
AGILE 2012 – Avignon, April 24-27, 2012
not sufficiently take into account the properties of sensor data, namely their dynamicity, temporality and heterogeneity. Besides, several sensor management approaches propose to analyze sensor as a service and qualify them as such [1]; others propose filtering, cleaning or clustering techniques to limit faulty data propagation [8]. Although these approaches contribute to the management of sensor data, the necessity to tackle the quality of sensor data over monitoring systems remains a relevant research topic.
2.1 Geospatial Monitoring Applications:
Environmental Phenomena Surveillance In our case of study, we are particularly interested on the study of data quality for geospatial monitoring applications. With our approach, we aim to identify and tackle the most transcendental aspects of this problematic.
Geospatial monitoring applications refers to the environmental monitoring systems composed by a set of wireless, geolocalised and heterogeneous sensors (i.e.
geosensors) [14]. These sensors are typically organized in
networks, measuring one or several parameters like temperature, movement and especially deployed in contexts where an environmental activity carry a risk of harmful effects both for human safety and/or for the natural environment.
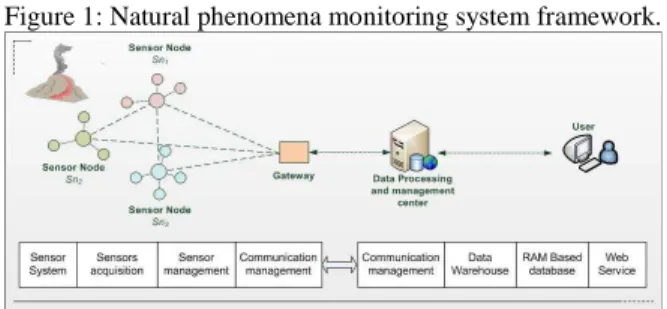
Figure 1: Natural phenomena monitoring system framework.
Figure 1 depicts a typical framework for this kind of systems. Here, sensor data are collected and transferred (directly or through a gateway) to the data processing and management center. Data can be visualized and further analyzed by a Geographic Information System (GIS), for example. Data can be also integrated with other information as satellite images and maps or published and analyzed through the Web by specialized services. This kind of framework is also employed to monitor farmlands, animals or smart buildings, for example [14].
2.2 Data Quality Issues and Requirements
The surveillance of environmental phenomena is a critical process and using monitoring systems based on sensors and sensor networks raise also several concerns. First, such monitoring systems impose sensors to operate in difficult conditions. In addition, sensors perform measurements according to their restricted storage, processing and communication capabilities. In both cases, sensors can provide unreliable information. This effect is very critical because, an erroneous data can be propagated and provide a misinterpretation of the real world.
However, we note that a given data may not only be
erroneous because of a faulty sensor; deployment conditions of the sensor and their use have also an impact. Generally, erroneous data coming from sensors can be identified in two categories: intentional or unintentional errors [8,12]. Intentional data errors can be caused by physical or logical attacks over sensors (i.e. malicious attacks) and unintentional data errors are generally caused by hardware malfunction (or stochastic errors), misplacement (conditional errors) or exhausted resources (systematic errors).
Regarding unintentional errors, sensors used to monitor environmental phenomena are exposed to unpredictable situations. For example, if we consider a motion sensor localized on the surrounding of a volcano, it may temporarily experiment some vibrations that are not necessarily related to the volcano activity. These vibrations can come from a helicopter landing and performing a field survey. Further, multiple problems can also be derived from or caused by animals surrounding the detection area.
Considering these facts, monitoring systems based on sensors and sensor networks must be reliable enough to guarantee system achievement and assist experts on decision making. We have to provide and communicate, as much as possible, the quality of the information managed through the system.
In order to better understand the elements required to define and manage the quality of sensor data, we introduce next the study of sensor data specificities in a monitoring context.
3
Sensor Data Modeling and Specificities
In a monitoring context, sensor data has several specificities comparing to data exploited in traditional applications. To the best of our knowledge, existing approaches base their data analysis only on sensed data and do not take into account all the life cycle of data through the system [8, 10]. To better explain this aspect, we propose the modeling of sensor data specificities, from its acquisition to its discovery.3.1 Sensor Data Specificities
We analyze sensor data from a product-oriented point of view: from acquisition to discovery. For this, we organize the typical framework of environmental monitoring systems (Figure 1) in three main layers: acquisition, processing and
discovery. This organization allows us to analyze sensor data
all through the system.
The acquisition layer refers to the sensor data collection system and thus to raw (or sensed) and pre-processed data. The processing layer involves data resulting from data processing and management center where energy, storage and analyze capabilities are more significant. Finally, at discovery
layer, we talk about delivered data (or post-processed data)
exploited over a GIS or combined with a Web service or application.
According to these layers, we distinguish several specificities. For example, data coming from sensors are geolocalised and time stamped values. Sensor data have then spatiotemporal properties and mainly stored over temporal and spatial relations. Also, for environmental monitoring
systems, “real-time” processing does not means “fast”, it means that processing time is limited, predictable and manageable (soft real-time). In fact, to process all data, monitoring systems must adopt priority policies as preferring most recent data and store them according to temporality properties. Finally, sensor data can be further processed by users, together with complementary information as producing statistics, sorting or geo-locating data in a map.
3.2 Sensor Data Modeling : Observation Data
The spatial and temporal properties of data coming from geosensors introduce a new scheme of data collection. Since
observation is the principal goal of monitoring systems, we
base our modeling on this concept (also used by OGC – SWE [10]). We call observation data those data used to describe a phenomenon. Such data has spatial, temporal, semantic and dynamic properties as well as complementary information contained in metadata.
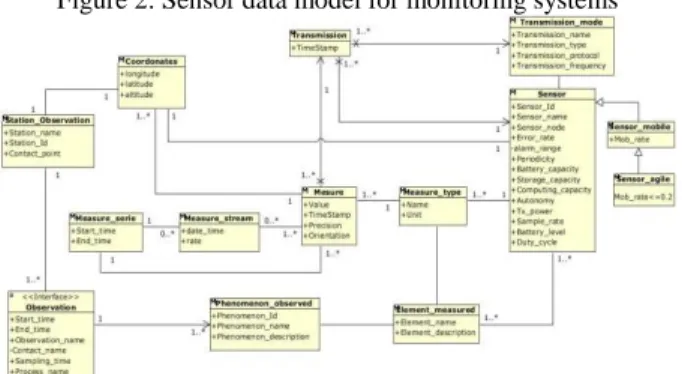
With this modeling (Figure 2), we attempt to provide a picture of data coming from sensors and the complementary information (metadata) which characterizes data in a monitoring context.
Figure 2: Sensor data model for monitoring systems
Being compatible with current applications [10, 11, 13] in geospatial domain, our model consider that a sensor network is composed by a set of sensors, located on the same observation area and allowed to collect and transfer data at fixed and variable positions (fixed, agile and mobile). Such sensors are related to observation stations (meteorological, agricultural stations…) responsible for observing different phenomena (i.e. tsunamis, volcanoes …), and where one or more elements are used to determine the evolution of such phenomena (i.e. temperature, gas, etc.).
We note in this sensor data modeling, that not all observation data has the same behavior over time and belong to different aspects of the system. We thus identify dynamic
elements which refer to objects changing over time and
according to the observed phenomenon (e.g. measures, agile or mobile sensor location…); and static elements which remain the same throughout an observation (e.g. observation station, phenomenon, measured elements).
In the remaining of this paper, we will note that sensor data quality management requires also an adapted management of dynamic and static attributes of data.
4
Quality for Sensor Data in Geospatial
Monitoring Applications
Traditionally, data quality was perceived as a simple correctness [15]. Nevertheless, quality is more than that, it is a multifaceted concept, in which different elements (as dimensions, attributes, criteria…) are used to described it [7]. Accordingly, to estimate the quality of sensor data, we must consider also the quality of their sources and process. In other words, we believe that the quality of data from an intrinsic (or internal) point of view is not sufficient to describe the quality of a system like an environmental monitoring system. This fact reveals the necessity to determine and formalize the set of attributes and properties required to evaluate the quality of sensor data.
In order to reach our goal, we propose in this section an approach to define and manage the quality of sensor data. This approach takes mainly into account: the characteristics of sensor data, a set of criteria related the factors impacting the quality of sensor data, as well as the use of metadata to manage quality information.
4.1 Data quality Model for Sensor Data
In order to categorize the set of quality elements necessaries to define and evaluate the quality of sensor data, we first expose the set of factors impacting the quality of sensor data through the system. Based on these factors, the specificities of sensor data and inspired by quality modelling approaches and standardizations, we associate a set of quality criteria capable to estimate their impact. A data quality model will formalize all these elements.
4.1.1 Impacting the Quality of Sensor Data
Sensor data is processed at different levels of the monitoring system (see Section 3.1). At each level, the quality of sensor data can be impacted by several factors and thus, erroneous or poor quality of data can reach the final user.
First, we analyze data at acquisition layer according to three main aspects: measurement context, sensor and
transmission. The analysis of these aspects allow us to
identify several factors such as sensor calibration and
performance, battery level, storage and processing capacity, measurement rate, accuracy and precision, transmission rate and type. Secondly, at processing layer the quality of data
strongly depends on the processing mechanisms used to transform data as: raw sensor data gathering and validation,
data processing and storage. More explicitly, like processing mechanisms (e.g. aggregation), the presence or absence of data validation mechanisms (e.g. filtering), the quality of service of the main server (storage level, availability, server
load...) as well as the processing time and temporality of sensor data (i.e. update, historical, recent). Finally, at the
discovery layer quality factors are related to how data is
extracted, represented and queried. In this instance, we
identify factors like automatic extraction mechanisms,
AGILE 2012 – Avignon, April 24-27, 2012
4.1.2 Sensor Data Quality Criteria
Considering the nature of impact factors, we estimate that sensor data quality is mainly defined by “the accuracy and
reliability of sensor data sources and concerns also the temporality and adequacy of data used for an intended goal”.
In fact, from acquisition to delivery, sensor data can experiment quality degradation. Inspired on existing data quality management approaches [2], we describe the quality criteria adapted in our approach.
In accordance with the nature of impact factors, we have analyzed the criteria proposed to evaluate the quality of geographic data and the quality of services [3, 5, 6]. We illustrate in Figure 3 the results of our study.
Figure 3: Sensor Data Quality Criteria
Regarding the three processing layers (acquisition, processing and discovery) and their impact factors, we classify quality criteria into three categories: context, internal and usage. The first category regroups the set of criteria selected to estimate the quality of raw sensor data at the acquisition layer: accuracy, reliability, spatial precision,
completeness and communication reliability. Selected criteria
allow us to estimate the quality on data sources, their context of acquisition and their transmission to the data management and processing center. The internal category integrates quality criteria such as consistency, currency and volatility. Their main goal is to avoid inconsistent information and to maintain the temporality of sensor data at a processing level. Finally, usage category includes criteria such as timeliness,
availability and adequacy. We formalize such categories and
criteria as follows.
4.1.3 Sensor data quality modeling
According to the literature, each data quality model has its own description level according to their goals and application domain [2]. Our concept of data quality is hence inspired on several data quality management approaches and standardizations defined for the GIS [3, 5, 6].
Even if a generic model seems, at present, difficult to conceive, we propose a vision of data quality providing important genericity and enabling us to include this model at different application contexts. This model is mainly characterized by quality categories, criteria, indicators and
measures. Each category can be associated to a particular
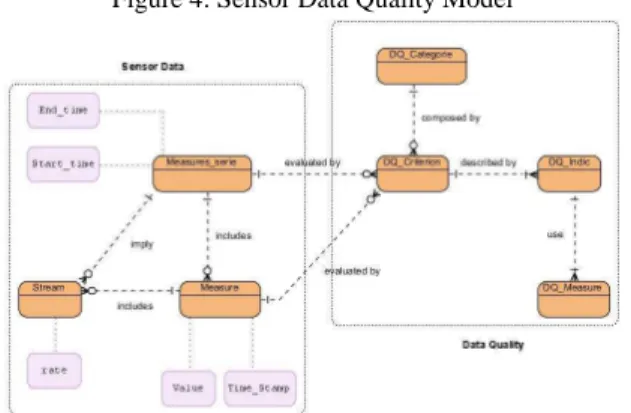
property of data and each criterion can be associated to one or more indicators accordingly. A given indicator may correspond to a measure or a set of measures related to several quality criteria. In Figure 4, we depicted the correlation of our
quality principles and the sensor data modeling. Here, quality information is related to sensor data at different granularity levels. A data quality criterion can be defined to evaluate measure series during an instant or period of time (i.e. phenomenon observation). Thus, one or several criteria can be related to a particular measure, to a set of measures or to a stream of measures. Evaluation results can thus be depicted by quality indicators.
Accordingly, a data quality category may refers to a quality component within a monitoring system (i.e. context, internal and usage). A data quality criterion must be considered as an extension of data (qualitative or quantitative) and referring to factors impacting quality as reliability, accuracy, etc.
Figure 4: Sensor Data Quality Model
A data quality indicator is a value resulting from a measure or a set of quality measures and a data quality
measure corresponds to the evaluation method applied to data
in order to qualify it. Due to the lack of space, evaluation algorithms are not described in this paper.
4.2 Management of sensor data quality
In a dynamic context as environmental monitoring, sensor data are enhanced with contextual or complementary information as sensor battery level, position, etc. In our approach, we consider also quality information as complementary information describing the reliability of sensor data. Any further information describing data is called
metadata, which means “data about data” [9].
Manage data together with quality information, and thus with metadata in a real-time context reveals several challenges. We propose as follows, a metadata based approach oriented to manage quality information in real-time.
4.2.1 Modeling quality information : sensor data and metadata
Managing quality information in a monitoring context implies a strong correlation between sensor data and the processing of data quality. Here, sensors mean the source of measures and quality information is considered as complementary information to enhance sensor data understanding.
It is worth to mention that in monitoring applications, the management of quality information requires updated metadata, capable to represent and explain the evolution and
behaviour of observed data. In this context, metadata are data related to sensors behaviour and monitoring context as well as closely linked to data quality information. We hence consider metadata as “data about data that meets user requirements
for a specific location and instant of time”.
According to these facts, we propose a metadata modeling oriented to structure complementary information about sensor data in a monitoring system. This model respects the dynamicity (time and space), granularity (abstraction level) and generality (generic or applicative) of data.
Basically, metadata in our context must take into consideration information about: Observation, Sensor and
Quality (Figure 5).
Figure 5: General Metadata Model
Observation metadata refers to information describing the
specificities of an observation. For this kind of metadata, complementary information is identified as general or referring to observation’s responsible. Sensor metadata refers to static and dynamic information about a sensor, allowing us to identify and evaluate the capacities of a sensor at an instant of time. Data quality metadata refers to information indicating the properties of data that we are evaluating such as criteria, measure, indicator etc. Such metadata includes the description of quality assessment principles.
4.2.2 Managing the quality of sensor data
The management of sensor data quality implies information about the dynamic changes of quality values as well as the methods used to access to information. In a general way, our solution to manage data quality consists in the estimation of quality criteria at each processing layer. During this process, quality information is cached at a sensor, gateway and server level. Here, our quality model is applied and supported by metadata in order to provide users with more complete information about sensor data.
More specifically, if we consider that in an observation, a sensor or sensor node provides information related to measured values and metadata. Measures are the sensed values (temperature, pressure…) and metadata refers to information like sensor lineage, behavior or the quality. During sensor data processing, a complex quality function is employed to determine the quality of data sensor data at each processing layer and according to the selected quality criteria. In this way, each object resulting from a data, a dataset or a data stream is linked to quality criteria and then allowed to be estimated. Results from the estimation of sensor data quality criteria will be transmitted to the user by the means of quality indicators or data quality reports.
In our approach, we chose to characterize indicators in a
graphical way, using icons exploited in an user interface. Besides, data quality reports can be setting and generated according to experts requirements.
5
Discovery of Sensor Data Quality
Information
In order to assist experts in the assessment of sensor data quality, we propose a prototype of visualization interface. Our prototype allows the visualization and discovery of data coming from sensors together with the communication of contextual information such as monitoring information and the quality of sensor data. This prototype allows us to validate our approach and implement several mechanisms as geospatial data discovery, sensor data quality management, as well as the use of visual quality indicators and reports. This prototype proposes users a way to interact with sensor data and quality information in a monitoring system.
5.1 Scenario: volcano activity
We take as an example the surveillance of a Mexican volcano: Popocatepetl. The Popocatepetl is localized at 60 kilometers from Mexico City and placed under the surveillance of the National Center for Disaster and Prevention of Mexico (Cenapred). The Cenapred uses a set of sensors distributed on 25 stations and process approximately 64 telemetry signals with 16 computers. Such monitoring system supervises in a visual, seismic, geodetic and geochemical way the behavior of the volcano. As this case of study shows, users of environmental monitoring systems are interested on discovering information about the evolution of the observed phenomena.
5.2 MoSDaQ prototype
The MoSDaQ (Monitoring Sensor Data Quality) prototype refers to a web-oriented user interface intended to monitor natural phenomena. This prototype attempts to be exploited by experts (locally or remotely) at a client side (Figure 6).
Figure 6: MoSDaQ web-based user interface.
This proposal is composed by five main sections: mapping,
AGILE 2012 – Avignon, April 24-27, 2012
indicators). Mapping section refers to the localization of
sensor objects in the cartographic space, what we call observation zone. In this zone, we place several sensors in a given position (by coordinates) and characterized by an icon according to its type and status. By clicking on each sensor icon, we have access to sensor information (static and dynamic). Observation section introduces all the information related to observed phenomena and elements. This section notify four important aspects: observed phenomenon, observation features, measured elements and coordinates of observation zone. Also, query section allows querying current or historical observation data according to its spatial, temporal, quality or semantic properties.
Sensor description section provides all technical information about each sensor located in the observation zone, as type, supplier, operational features and constraints. Besides,
quality indicators section enables the access to quality
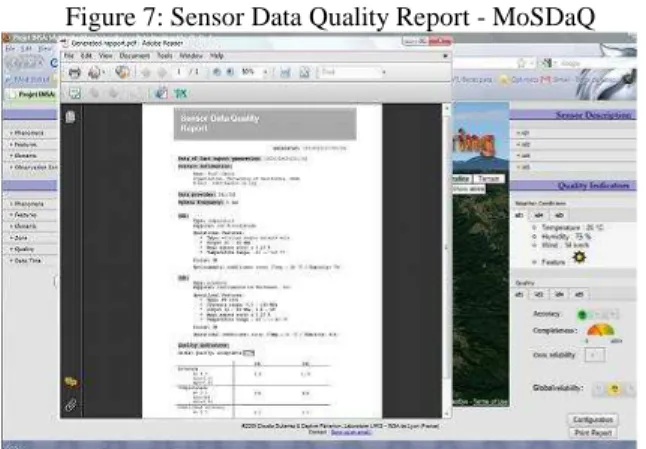
properties of sensor data, to setting them and to visualize them. A data quality report can be also produced and visualized (Figure 7).
Figure 7: Sensor Data Quality Report - MoSDaQ
With this prototype we made a first attempt discovering sensor data together with complementary information as quality information.
6
Conclusion
This paper introduces our proposal for the definition and evaluation of sensor data quality in a geospatial monitoring context. Our study of quality over sensor data implied the analysis of sensor data specificities. Accordingly, we propose a model attempting to formalize sensor quality properties (categories, criteria and indicators) and the corresponding measures. Our approach allows representing such properties and employs a product approach to evaluate them; qualifying data from acquisition to discovery. This contribution is mainly supported by metadata as a complementary information source. Regarding sensor data specificities, we analyzed and modeled metadata from a dynamic point of view, considering their granularity, generality and their spatiotemporal properties.
In order to complement our approach, a web-oriented user interface for sensor data quality discovery in real-time has been implemented. This interface is based on the specificities of a volcano monitoring system.
References
[1] P. Ahluwalia and U. Varshney. Composite quality of service and decision making perspectives in wireless networks. Decision Support Systems, 46(2): 542-551. 2009.
[2] C. Batini, C. Capiello, C. Francalaci and A. Maurino, editors, Methodologies for data quality assessment and
improvement, ACM Comput. Surv. 41 (3), 2009.
[3] R. Devillers and R. Jeansoulin editors. Fundamentals of
Spatial Data Quality, ISTE, London, UK, 312p. 2006.
[4] Goodchild, M. J. Data quality in geographic information : from error to uncertainty. In Goodchild M., Jeansoulin R editors, 1998.
[5] International Standardization Organization. Geographic
Information - Quality Principles. ISO 19113. 2002.
[6] International Standardization Organization. Quality of
service - Guide to methods and mechanisms. JTC 1/SC 6.
ISO/IEC TR 13243:1999, 1999.
[7] F. Naumann and M. Roth. Information Quality. In J. Erickson editor, Database Technologies: Concepts,
Methodologies, Tools, and Applications, 2140-2156. IGI
Global, 2009.
[8] K. Ni, N. Ramanathan, M. Nabil and al. Sensor network data fault types. ACM Trans. Sen. Netw.5(3): 29pp, 2009.
[9] NISO – National Information Standards Organization. Understanding Metadata. NISO Press. 2004.
[10] Sensor Web Enablement. OGC: accessed January 2012
http://www.opengeospatial.org/ogc/markets-technologies/swe.
[11] Semantic Sensor Network Incubator Group. SSN Sensor. W3C : accessed January 2012.
http://www.w3.org/2005/Incubator/ssn/wiki/SSN_Sensor
[12] E. Shi and A. Perrig. Designing secure sensor networks.
IEEE Wireless Commun. Mag. 11(6). 2004.
[13] Swiss Experiment: accessed January 2012
http://www.swiss-experiment.ch/index.php/Main:Home
[14] N. Trigoni, A. Markham and S. Nawaz editors. Proc.
GeoSensor Networks, 3rd Intl. Conf. GSN2009. 149-157.
LNCS, UK, 2009.
[15] Wang, R. Y. and Strong, D. M. “Beyond accuracy: what data quality means to data consumers”. Journal of