HAL Id: hal-00440443
https://hal.archives-ouvertes.fr/hal-00440443
Submitted on 10 Dec 2009HAL is a multi-disciplinary open access archive for the deposit and dissemination of sci-entific research documents, whether they are pub-lished or not. The documents may come from teaching and research institutions in France or abroad, or from public or private research centers.
L’archive ouverte pluridisciplinaire HAL, est destinée au dépôt et à la diffusion de documents scientifiques de niveau recherche, publiés ou non, émanant des établissements d’enseignement et de recherche français ou étrangers, des laboratoires publics ou privés.
surge-generating winds changing ?
Paolo Pirazzoli, A. Tomasin, Albin Ullmann
To cite this version:
Paolo Pirazzoli, A. Tomasin, Albin Ullmann. Air-sea interaction in the Central Mediterranean: are surge-generating winds changing ?. Bollettino Geofisico, 2009, 3 (4), pp.5-21. �hal-00440443�
Bollettino Geofisico, a. XXXII, n. 3-4 luglio-dicembre 2009 5
AIR-SEA INTERACTION IN THE CENTRAL MEDITERRANEAN: ARE SURGE-GENERATING WINDS CHANGING?
PAOLO ANTONIO PIRAZZOLIa ,ALBERTO TOMASINb,ALBIN ULLMANNc a CNRS-Laboratoire de Géographie Physique, 1 Place Aristide Briand, 92195 Meudon cedex, France b ISMAR-CNR, Venezia and Università “Ca’ Foscari” di Venezia, Italy; tomasin@unive.it
c Centre de Recherche de Climatologie, Faculté des Sciences Gabriel, Université de Bourgogne, BP138, 210004, Dijon cedex, France
Riassunto: Per ventisette porti del Mediterraneo centrale si è studiata la relazione tra vento e sovralzi di livello marino (“surges”) con particolare attenzione alle variazioni nel tempo dei fenomeni, e quindi a suggerimenti di tendenze climatiche. Precisamente, per le varie stazioni mareografiche dei cui dati si dispone, si sono ricercate le stazioni meteorologiche più vicine e le loro registrazioni di vento. È notissimo che il livello del mare varia costantemente per effetti gravitazionali (marea astronomica) ma pure, in modo aperiodico, per disturbi meteorologici che possono provocare sovralzi. Tra queste forzanti atmosferiche la più significativa è il vento, che quasi sempre prevale come efficacia rispetto a variazioni di pressione atmosferica o di temperatura, ovvero sugli effetti delle precipitazioni. Nello studio del vento emerge la natura vettoriale dello stesso, e facilmente si ottengono conclusioni separate per la direzione e l’intensità.
È facile poi afferrare l’importanza della morfologia nelle analisi, ovvero della profondità dei fondali e dell’orientazione e costituzione delle coste, sia allo stato naturale che con manufatti di protezione. Per questo è necessario approfondire con pazienza ciascuna conclusione.
Sistemato il lavoro descrittivo ed esplicativo, si traggono evidenze di variazioni nei decenni recenti, con mutamenti nella direzione prevalente dei venti e, fatto forse più significativo, con diminuzione delle maggiori intensità.
Questo risultato (da intendere come un contributo, una tessera nel mosaico globale) potrebbe rafforzare quanto emerge da altri studi, che cioè l’evoluzione climatica in corso tenda a deviare verso l’Europa centrale le perturbazioni che altrimenti transiterebbero sul Mediterraneo, portatrici di valori estremi dell’intensità del vento. Emergono in questo senso le differenze di tendenza tra l’area qui considerata e le altre regioni del continente.
Abstract: Hourly sea surges from the records of 9 French and 19 Italian tide-gauge stations have been computed and the wind directions corresponding to significant surge heights have been determined. The frequency of such surge-related wind directions tends to increase almost everywhere, while extreme wind speeds (that are most effective to produce high surges) tend generally to decrease; this may be a consequence of the northward displacement of storm trajectories on the European area. There is, however, an exception in the Gulf of Lions (the most westward area considered), where surge height may reach higher elevations, with a recent dangerous increase of southerlies.
Bollettino Geofisico, a. XXXII, n. 3-4 luglio-dicembre 2009 6
1. Introduction
Recent climatic models, summarized by the last reports of the Intergovernmental Panel on Climate Change (IPCC 2001, 2007), have predicted for this century a significant warming and a global sea-level rise that is expected to increase the flooding risk on low coasts. However, flooding will not occur gradually, following the average rate of a few millimetres per year expected for the sea-level rise, but occasionally, at the time of storms that may produce overwash and erosion phenomena, especially if they occur at high tide.
In the central Mediterranean area the astronomical tide is quite limited (generally less than ±20 cm), but sea level may be increased several decimetres by meteorological factors producing sea surges. The main meteorological surge-related factor is, indeed, strong wind, especially if it pushes the water towards the coast, whereas atmospheric depressions, though tending to raise sea level for inverted barometric effect, have usually less consequences, while rainfall can almost be neglected distant from river mouths. It is therefore important to improve our understanding of the possible trends of change for surge-related winds. While a wide variety of studies on climate variability in the Mediterranean is available, especially for regional temperature and precipitation reconstruction (many references e.g. in Bolle, (2003) and Lionello et al. (2006)) the quantification and variability of surges remains much less studied.
C.S. et al. (2004) have published an atlas with several maps and many histograms of wind speed-wind direction for the Mediterranean, with data estimated from satellite radar altimeters and from models. This work provides useful statistical information, without however any trend of recent variability. Tsimplis et al. (2005) have compared the recent sea-level evolution in the Mediterranean with the output of a barotropic model forced by atmospheric pressure and wind, finding that meteorological forcing has contributed to large residual trends in mean sea level; Gomis et al. (2008) have studied the contribution to low frequency sea-level variability obtained from simulations of air pressure and wind values deduced from reanalysis. However both the preceding studies did not extend their analysis also to the surge domain.Following a similar approach already carried out for the Adriatic area (Pirazzoli and Tomasin, 2002, 2008a), the eastern coasts of the English Channel (Pirazzoli et al., 2006), the Camargue area (Ullmann et al., 2007) and the Atlantic coasts of France (Pirazzoli, 2008), the aim of this study is to: 1) compute systematically hourly values of the astronomical tide and surges from the records observed at tide-gauge stations; 2) specify the wind directions at nearby meteorological stations that correspond to significant surge heights; and 3) estimate the recent trend in the frequency and extreme values of wind speed which coincided with wind directions that can be related to surge events.
2. Data and methods
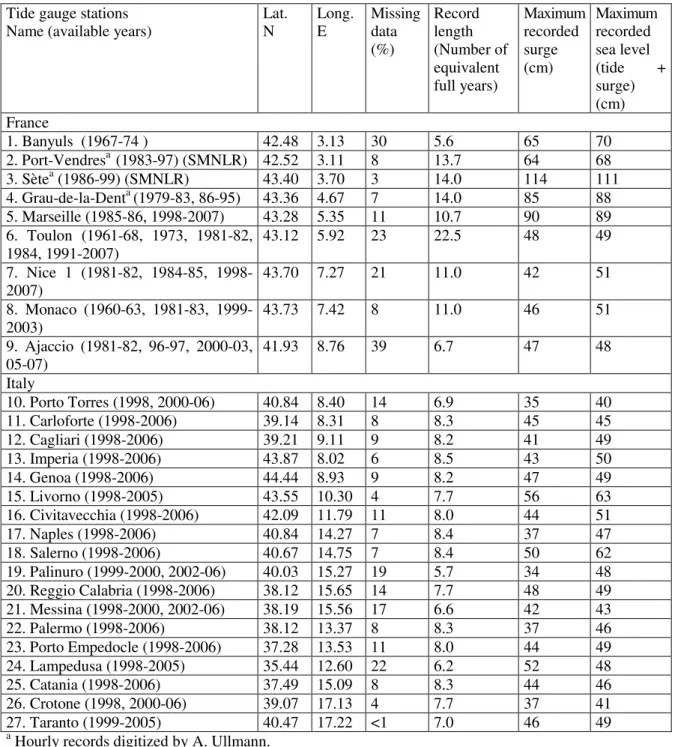
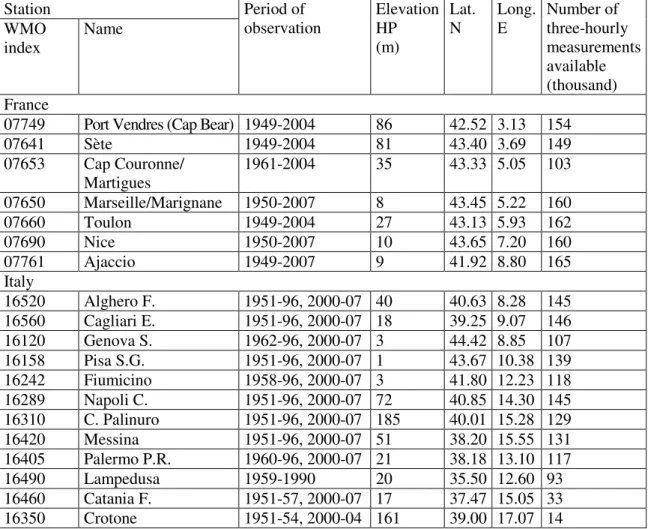
This work is based on the analysis of hourly records from the same 27 tidal stations (9 in southern France and 18 in Italy), for which return time of extreme sea levels have been estimated by Pirazzoli and Tomasin (2008b). The tidal records (about 250 equivalent full years) have been correlated with over two and a half million three-hourly wind measurements from 19 nearby meteorological stations (Fig. 1). The time reference of the data ranges from the most recent years back to the start of 2nd half of the past century (Table 1, Table 2).
Bollettino Geofisico, a. XXXII, n. 3-4 luglio-dicembre 2009 7 35 36 37 38 39 40 41 42 43 44 45 46 2 3 4 5 6 7 8 9 10 11 12 13 14 15 16 17 18 19 20 Longitude (° E) L a ti tu d e ( ° N )
Shoreline Tide gauge Meteorological station
France
Italy
Algeria
Tunisia
M
M
M
1-2 3 4 5 6 7-8 13 14 9 10 11 12 15 16 17 18 19 20-21 22 23 24 25 26 27 C P F A LFig. 1 – Location of the tide-gauge stations: 1: Banyuls; 2: Port-Vendres; 3: Sète; 4:
Grau-Fig. 1. Location of tide gauge stations: 1: Banyuls; 2: Port-Vendres; 3: Sète; 4: Grau-de-la-Dent; 5: Marseille (Marseilles); 6: Toulon; 7: Nice; 8: Monaco; 9: Ajaccio; 10: Porto Torres; 11: Carloforte; 12: Cagliari; 13: Imperia; 14: Genova (Genoa); 15: Livorno; 16: Civitavecchia; 17: Napoli (Naples); 18: Salerno; 19: Palinuro; 20: Reggio Calabria; 21: Messina; 22: Palermo; 23: Porto Empedocle; 24: Lampedusa; 25: Catania; 26: Crotone; 27: Taranto.
Location of meteorological stations (when the name of their location differs from the name of the tide gauge station): A: Alghero; C: Cap Couronne; F: Fiumicino; L: Leuca; P: Pisa.
Bollettino Geofisico, a. XXXII, n. 3-4 luglio-dicembre 2009 8
Tide gauge stations
Name (available years) Lat. N Long. E Missing data
(%) Record length (Number of equivalent full years) Maximum recorded surge (cm) Maximum recorded sea level (tide + surge) (cm) France 1. Banyuls (1967-74 ) 42.48 3.13 30 5.6 65 70 2. Port-Vendresa (1983-97) (SMNLR) 42.52 3.11 8 13.7 64 68 3. Sètea (1986-99) (SMNLR) 43.40 3.70 3 14.0 114 111 4. Grau-de-la-Denta (1979-83, 86-95) 43.36 4.67 7 14.0 85 88 5. Marseille (1985-86, 1998-2007) 43.28 5.35 11 10.7 90 89 6. Toulon (1961-68, 1973, 1981-82, 1984, 1991-2007) 43.12 5.92 23 22.5 48 49 7. Nice 1 (1981-82, 1984-85, 1998-2007) 43.70 7.27 21 11.0 42 51 8. Monaco (1960-63, 1981-83, 1999-2003) 43.73 7.42 8 11.0 46 51 9. Ajaccio (1981-82, 96-97, 2000-03, 05-07) 41.93 8.76 39 6.7 47 48 Italy 10. Porto Torres (1998, 2000-06) 40.84 8.40 14 6.9 35 40 11. Carloforte (1998-2006) 39.14 8.31 8 8.3 45 45 12. Cagliari (1998-2006) 39.21 9.11 9 8.2 41 49 13. Imperia (1998-2006) 43.87 8.02 6 8.5 43 50 14. Genoa (1998-2006) 44.44 8.93 9 8.2 47 49 15. Livorno (1998-2005) 43.55 10.30 4 7.7 56 63 16. Civitavecchia (1998-2006) 42.09 11.79 11 8.0 44 51 17. Naples (1998-2006) 40.84 14.27 7 8.4 37 47 18. Salerno (1998-2006) 40.67 14.75 7 8.4 50 62 19. Palinuro (1999-2000, 2002-06) 40.03 15.27 19 5.7 34 48 20. Reggio Calabria (1998-2006) 38.12 15.65 14 7.7 48 49 21. Messina (1998-2000, 2002-06) 38.19 15.56 17 6.6 42 43 22. Palermo (1998-2006) 38.12 13.37 8 8.3 37 46 23. Porto Empedocle (1998-2006) 37.28 13.53 11 8.0 44 49 24. Lampedusa (1998-2005) 35.44 12.60 22 6.2 52 48 25. Catania (1998-2006) 37.49 15.09 8 8.3 44 46 26. Crotone (1998, 2000-06) 39.07 17.13 4 7.7 37 41 27. Taranto (1999-2005) 40.47 17.22 <1 7.0 46 49
a Hourly records digitized by A. Ullmann.
Table 1. List of hourly tidal records available from the central Mediterranean area. All heights are related to the yearly running MSL.
Bollettino Geofisico, a. XXXII, n. 3-4 luglio-dicembre 2009 9 Station WMO index Name Period of observation Elevation HP (m) Lat. N Long. E Number of three-hourly measurements available (thousand) France
07749 Port Vendres (Cap Bear) 1949-2004 86 42.52 3.13 154
07641 Sète 1949-2004 81 43.40 3.69 149 07653 Cap Couronne/ Martigues 1961-2004 35 43.33 5.05 103 07650 Marseille/Marignane 1950-2007 8 43.45 5.22 160 07660 Toulon 1949-2004 27 43.13 5.93 162 07690 Nice 1950-2007 10 43.65 7.20 160 07761 Ajaccio 1949-2007 9 41.92 8.80 165 Italy 16520 Alghero F. 1951-96, 2000-07 40 40.63 8.28 145 16560 Cagliari E. 1951-96, 2000-07 18 39.25 9.07 146 16120 Genova S. 1962-96, 2000-07 3 44.42 8.85 107 16158 Pisa S.G. 1951-96, 2000-07 1 43.67 10.38 139 16242 Fiumicino 1958-96, 2000-07 3 41.80 12.23 118 16289 Napoli C. 1951-96, 2000-07 72 40.85 14.30 145 16310 C. Palinuro 1951-96, 2000-07 185 40.01 15.28 129 16420 Messina 1951-96, 2000-07 51 38.20 15.55 131 16405 Palermo P.R. 1960-96, 2000-07 21 38.18 13.10 117 16490 Lampedusa 1959-1990 20 35.50 12.60 93 16460 Catania F. 1951-57, 2000-07 17 37.47 15.05 33 16350 Crotone 1951-54, 2000-04 161 39.00 17.07 14
Table 2. Location and observation periods of the three-hourly meteorological data considered.
French tidal data have generally been provided by the Service Hydrographique et Océanographique de la Marine (SHOM) or downloaded from the Système d’Observation des Niveaux des Eaux Littorales (www.sonel.org) (accessed March 2008). For three stations (Port-Vendres, Sète and Grau-de-la-Dent), the data have been digitized from maregrams of the Direction Régionale de l’Equipement (DRE) du Languedoc-Roussillon and the Compagnie Nationale des Salins du Midi et de l’Est (CNSME) first of all.
Italian tidal data have been provided by the Servizio Idrografico e Mareografico of the Agenzia nazionale per la Protezione dell’Ambiente e servizi Tecnici (ex-APAT, now ISPRA).
Bollettino Geofisico, a. XXXII, n. 3-4 luglio-dicembre 2009 10
Meteorological data have been provided mainly by Météo France for French stations and by ITAV - Servizio Meteorologico dell’Aeronautica Militare, that made available digitised data until 1996 for Italian stations. Since the year 2000, meteorological data have been implemented with six-hourly measurements downloaded from the weather archive of Russia’s weather server (http://meteo.infospace.ru/wcarch/html/) (accessed March 2008). Wind directions are generally recorded in 10° or 20° increments calculated clockwise from the geographical north and correspond to the average direction during the 10 minutes preceding the measurement time. Wind speed corresponds to the average speed during the same 10-minute period to which the direction is referred. Since wind speed is expressed in knots by ITAV and in m/s by Météo France and by the Russia’s Server, all the values have been converted to m/s in this paper.
After a preliminary inspection and removal of obviously wrong data from the data set, following criteria already specified by Pirazzoli et al. (2006) for tide-gauge data and by Pirazzoli and Tomasin (2003) for wind data, a doubt, however, may remain on the reality of certain relatively isolated high values of three-hourly wind speeds. To avoid this problem, that might lead to wrong trend estimates based on isolated values, statistics of the 99th percentile of annual wind speeds has been generally preferred in this paper to estreme estimations based on annual maximum values.
For all tide-gauge stations, the Polifemo software (Tomasin, 2005) has been used to compute hourly astronomical tide and surges in relation to the running mean sea level (MSL). This software performs a least-squares fit for harmonic constants, that can vary slightly with morphological changes in the harbour basin considered. One of the advantages of this least-squares algorithm is its ability to deal with incomplete series of data and even with variable time steps.
For each hourly surge greater than or equal to a given locally significant height, the wind direction has been determined at the nearest meteorological station at the time of the surge and during the preceding 5 h (to have at least two three-hourly wind measurements for each hourly surge value). Linear trends have been determined by regressions, the slopes of which have been compared to the data’s standard deviations (±σ), to estimate, at least roughly, their statistical confidence. Sigma (σ) gives the likelihood of a non-zero, or non-horizontal slope with 68% probability (or 1.96σ gives p=95%; 2.58σ gives p=99%).
3. Results
As noted by Ullmann et al. (2008), who used the frequency of 45°-class direction of local winds, regional-scale surges occur in the Gulf of Lions, according to the general orientation, when the wind blows from between 90° and 180°. By using a narrower class direction, such range can be even narrowed to 20-120° at Sète and 100-120° at Cap Couronne (Fig. 2). In addition, local-scale strong surges may also occur at Port-Vendres, and even more at Marseille, with regional-scale north-westerly winds (i.e. Mistral) due to the local orientation of the coast. With the exception of Port-Vendres, where no significant changes appear, the frequency of surge-related winds clearly increases in the Gulf of Lions, whereas their extreme speed decreases at Marseille (especially for the north-westerly component) though increasing at Cap Couronne (Fig. 2a, Table 3).
Bollettino Geofisico, a. XXXII, n. 3-4 luglio-dicembre 2009 11 The tide gauge of Marseille is located on a north-south oriented coast opened westward on the Mediterranean Sea. It is thus sensitive to southerly winds that lead to a regional sea surge, but also to northerly winds (mistral) due to the local direction of the coast (Ullmann et al., 2008). The bay of Toulon, on the other hand, though located near the southernmost tip of Provence coast, is open the the Mediterranean Sea only in its eastern part, thus explaining why surges are produced mainly by winds from 40-110°. Surges at Nice and Monaco mainly depend on the orientation of the harbour quays and the location of the tide gauge inside the harbour basin. Small surges recorded at Nice and Monaco are therefore mainly produced by northwesterlies, but cannot be considered representative of the rest of the coast. In the Ajaccio harbour, surges are mainly produced by southerlies.
The frequency of surge-related wind directions increases more or less everywhere along the Provençal and west Corsica coasts, while their extreme speed tends generally to decrease. At Toulon (like at Marseille) the decrease in the speed of strong north-westerlies is especially rapid (Fig. 2b, Table 3).
On the western coast of Sardinia, and especially along the Gulf of Genoa, southerlies that tend to push the water towards the coast are an obvious cause of sea surges. At Imperia, however, like at Toulon, wind directions from northeast may also contribute to raise the water level, due to the local direction of the coast and the harbour disposition (Lama and Corsini, 2000) (Fig. 2c). At Genoa, where the whole harbour is protected from southerlies by a continuous dyke leaving a narrow navigation opening only towards the east, regional surges may be caused by southerlies and local surges by northeasterlies,
The frequency of surge-related winds shows a slight decrease at Alghero, a slight increase at Genoa, and a strong increase at Pisa, on the eastern part of the Gulf. A general decrease of extreme speeds is documented by all the stations in the area. At Cagliari, wind distribution corresponding to surges at Carloforte or Cagliari was too dispersed to attempt an estimation of recent trends. (Fig. 2c, Table 3).
Along the eastern coasts of the Tyrrhenian Sea, inland winds from south or southwest are an obvious cause of sea surges (Fig. 2d). All of them show a recent increase in frequency, accompanied by a decrease for extreme speed (Table 3).
Though the Palermo station is located on the northern coast of Sicily, local surges are produced mainly by southerlies. They show, like in other stations of the Tyrrhenian Sea, a recent increase in frequency and a decrease in extreme speed (Fig. 2e). One may wonder, however, whether the meteorological station of Punta Raisi is representative for surges in the Palermo harbour.
Bollettino Geofisico, a. XXXII, n. 3-4 luglio-dicembre 2009 12
Bollettino Geofisico, a. XXXII, n. 3-4 luglio-dicembre 2009 13
Bollettino Geofisico, a. XXXII, n. 3-4 luglio-dicembre 2009 14
Bollettino Geofisico, a. XXXII, n. 3-4 luglio-dicembre 2009 15
Bollettino Geofisico, a. XXXII, n. 3-4 luglio-dicembre 2009 16
2e
Only a few surges ≥30 cm have been reported from the Taranto station, yet easily exposed to southerly wind at the northern end of the homonymous gulf. At Leuca, like at Brindisi more north on the Adriatic coast (Pirazzoli and Tomasin, 2008a), southerly winds tend to decrease in frequency as well as in speed (Tab. 3). Distribution of surge-related wind directions was too dispersed at Messina and too short at Catania and Crotone to estimate recent trends. Finally at Porto Empedocle and Lampedusa meteorological records were not available during the same periods of tide-gauge records.
Bollettino Geofisico, a. XXXII, n. 3-4 luglio-dicembre 2009 17 Tide gauge station Height of the hourly surges considered (number of wind observations available) Nearest meteorologic station available Surge-related wind directions Trend in the frequency of the surge-related wind directions (%/yr)
Trend for the 99th
annualpercentile of three-hourly wind speed (cm/s/yr) France 1. Banyuls ≥50 cm (70) Port-Vendres d.d. d.d. d.d. 2. Port-Vendres (SMNLR)1 ≥50 cm (234) Port-Vendres 130-200° -0.02±0.05 (p =28%) +2±3 (p=63%) 3. Sète (SMNLR)1 ≥70 cm (131) Sète 20-120° +0.31±0.05 (p>99%) -3±3 (p =69%)
4. Grau-de-la-Dent1 ≥70 cm (46) Cap Couronne 100-120° +0.45±0.07 (p >99%) +4.9±3.6 (p>82%)
5. Marseille ≥70 cm (80) Marseille 120-190° 280-300° sum +0.31±0.05 (p >99%) +0.07±0.02 (p >99%) +0.38±0.04 (p>99%) -1±1 (p<67%) -4±1 (p>99%) 6. Toulon ≥40 cm (134) Toulon 40-110° 280-300° sum -0.04±0.03 (p >84%) +0.12±0.07 (p >89%) +0.08±0.07 (p=76%) -5±1 (p >99%) -11±1 (p>99) 7. Nice ≥35 cm (60) Nice 310-350° +0.34±0.05 (p>99%) -1±1 (p>80%) 8. Monaco ≥35 cm (132) Nice 310-360° +0.05±0.04 (p>83%) -1±1 (p>74%) 9. Ajaccio ≥35 cm (82) Ajaccio 150-220° +0.12±0.04 (p>99%) -1±1 (p=62%) Italy
10. Porto Torres ≥30 cm (31) Alghero 180-230° -0.05±0.02 (p > 99%) -3±2 (p >91%)
11. Carloforte ≥30 cm (59) Cagliari d.d. d.d. d.d.
12. Cagliari ≥30 cm (53) Cagliari d.d. d.d. d.d.
13. Imperia ≥30 cm (77) Genova S. 10-60°
150-210°
sum -0.06±0.09
14. Genova ≥35 cm (61) Genova S. sum 30-40°
&150-190° +0.19±0.06 (p >99%) -4±2 (p >97%) -2±2 15. Livorno ≥40 cm (22) Pisa 120-180° +0.25±0.04 (p >99%) -8.5±1.8 (p>99%) 16. Civitavecchia ≥40 cm (23) Fiumicino 100-200° +0.07±0.03 (p >96%) -8±2 (p 99%) 17. Napoli ≥35 cm (8) Napoli 150-230° +0.08±0.03 (p >99%) -4±2 (p>99%) 18. Salerno ≥35 cm (12) Napoli 130-290° +0.18±0.05 (p >99%) -3±2 (p>94%) 19. Palinuro ≥30 cm (12) Palinuro 90-180° 150-330° +0.13±0.03 (p>99%) +0.20±0.07 (p >99°) -9±2 (p >99%) -6±2 (p >99%)
20. Reggio Cal. ≥30 cm (13) Messina d.d. d.d. d.d.
21. Messina ≥30 cm (59) Messina d.d. d.d. d.d. 22. Palermo ≥30 cm (24) Palermo P.R. 160-220° +0.10±0.05 (p >96%) -14±1 (p >99%) 25. Catania ≥30 cm (9) Catania 250-280° s.r. s.r. 26. Crotone ≥30 cm (6) Crotone 20-200° s.r. s.r. 27. Taranto ≥30 cm (6) ≥30 cm (6) Crotone Leuca 130-270° 130-230° s.r. -0.04±0.04 (p=62%) s.r -8±2 (p >99%)
1 : data digitized by A. Ullmann
d.d. = dispersed distribution (i.e. predominant (>75%) surge-related wind directions cover a range >180°) ; s.r. = short record (insufficient even for a rough trend estimation);
Table 3. Predominant wind directions at central Mediterranean meteorological stations at the time and during the five hours preceding hourly surges higher than (or equal to) given levels at tide gauge stations. Trends in wind frequency and speed are also specified. The p value corresponds to a rough estimation of the trend probability.
Bollettino Geofisico, a. XXXII, n. 3-4 luglio-dicembre 2009 18
4. Discussion and conclusions
This discussion is an attempt to interpret the above results in relation to climate change. A relatively common feature in Fig. 2, in spite of variable wind directions and of the local effects produced by dykes in some harbours, is an almost general increase in wind frequency, accompanied by an even more general decrease in wind speed. The increase in wind frequency is not a new result in the central Mediterranean area. It had already been reported, between the mid-1970s and 1996, in correlation with a clear increase in the mean temperature, by Pirazzoli and Tomasin (2003), following a previous period since 1951 of decreased wind activity. The data from the last decade, during which regional and global warming has even increased (IPCC, 2007), confirm that such trend and correlation are still going on.
A consequence of global warming is that the trajectory of major cyclonic activity and storm tracks tends to be displaced northwards in extratropical areas of the Northern Hemisphere (Wang et al., 2006). Such a displacement may explain why extreme wind speed tends gradually to decrease in the central Mediterranean area even more rapidly than one decade ago (Pirazzoli and Tomasin, 2003). A similar tendency for the near future is confirmed with modelling by Somot (2005). Similar results have been obtained also by Leckebusch et al. (2006), who have predicted a consistent reduction of cyclonic activity for the Mediterranean region under future climate conditions.
The main exception to such a decreasing trend in extreme wind speed is in the Gulf of Lions, where at Port-Vendres, and especially at Cap Couronne, there is rather an increase in extreme speed of southerly winds (Fig. 2a). This exception seems to have a synoptic explanation. Changes in the mean atmospheric conditions of the NAO can modify atmospheric circulation at smaller spatial scales than the NAO and change meteorological conditions at regional and local scales (Omstedt and Chen, 2001; Jevrejeva et al., 2005). As noted by Ullmann (2008), since 1975 the two main poles of barometric anomaly, used to define NAO indexes, tended to displace and enlarge eastwards. Compared to the first half of the 20th century, sea-level pressure anomalies have intensified in the Barents Sea region and over the Iberian Peninsula since 1975, whereas sea-level pressure anomalies decreased further westward (Wakelin et al., 2003; Ullmann, 2008). This favoured, during negative NAO phases, the frequency of the so-called ‘Greenland above’ weather regime which is mostly associated with highest surges and strongest south-easterlies in the Gulf of Lions (Ullmann et al., 2008). In fact, during ‘Greenland above’ events, a deep low pressure usually covers the near-Atlantic between 45° and 60°N and anticyclonic conditions prevail over Eastern Europe (Michelangeli et al., 1995; Plaut and Simonnet, 2001; Ullmann and Moron, 2008). In such situations, the frequency of atmospheric depressions tends to increase in the Bay of Biscay, and a strong eastward pressure gradient may develop in the Gulf of Lions, increasing the probability of local strong south-easterlies (Ullmann et al., 2008). To summarize, the eastward shift of the two main NAO’s barometric poles since 1975 modified the atmospheric circulation at a smaller spatial scale and increased the probability of strong surge-related south-easterlies at the regional scale in the Gulf of Lions. The link between these changes in the mean conditions of the NAO and the Gulf of Lion’s exception to decreasing trend in extreme wind speed is fully consistent with the significant intensification of the correlation between wintertime mean NAO and sea surges at Marseille and Grau-de-la-dent since 1975 (Wakelin et al., 2003; Jevrejeva et
Bollettino Geofisico, a. XXXII, n. 3-4 luglio-dicembre 2009 19 trends in the areas considered here turn out different from what is found in central and northern Europe.
In conclusion, sea surges exceeding half a metre are relatively rare in the central Mediterranean. Though the frequency of surge-related winds tends to increase almost everywhere, apparently in relation to the recent warming, extreme winds, that are most effective to produce high surges, tend generally to decrease, as a consequence of the northwards displacement of cyclonic trajectories in the European area (Giorgi and Lionello, 2008). This is in agreement with the simulations of wind-wave fields made by Lionello et al. (2008) that suggest a reduction in significant wave height extremes in near-future scenarios than those in the present climate. There is, however, a local exception in the Gulf of Lions, where surge height may naturally reach higher elevations. This is not only an area of low coastal plains, that in addition is affected by significant subsidence in the Rhone delta area, but also the only region in the central Mediterranean where extreme surge-related winds show a recent trend towards an increase.
Acknowledgements
The Italian Vector-CLIVEN project partially sponsored this research.
The Italian meteorological data by ITAV were kindly made available thanks to CNR-IFA (now CNR-ISAC). The authors are grateful to Ms. J. Frankenfield Zanin for help in editing.
Bollettino Geofisico, a. XXXII, n. 3-4 luglio-dicembre 2009 20
References
BOLLE H.J. (Ed.), 2003: Mediterranean climate variability and trends. Springer Verlag, Berlin.
C.S., N.T.U.A.,C.N.R./I.S.M.A.R., THETIS, SEMANTIC, MÉTÉO FRANCE, 2004: Wind and wave atlas of the Mediterranean Sea. Western European Union, IV-34, 386 p., fig., tabl., charts.
GIORGI F., LIONELLO P., 2008: Climate change projections for the Mediterranean region. Global and Planetary Change, 63, 90-104.
GOMIS D., RUIS S., SOTILLO M.G., ALVAREZ-FANIUL E., TARRADAS, J., 2008: Low frequency Mediterranean sea level variability: the contribution of atmospheric pressure and wind. Global and Planetary Change, 63, 215-229.
IPCC, 2001: Climate change 2001: The scientific basis. Cambridge University Press, Cambridge and New York.
IPCC, 2007: Climate Change 2007. The Physical Science Basis (Cambridge University Press, Cambridge and New York.
JEVREJEVA S., MOORE J.C., WOODWORTH P.L., GRINSTED A., 2005: Influence of large scale atmospheric circulation on European sea level: results based on the wavelet transform method. Tellus 57A, 183-193.
LAMA R., CORSINI S., 2000: La rete mareografica italiana. Istituto Poligrafico e Zecca dello Stato, Roma .
LECKEBUSCH G.C., KOFFI B., ULBRICH U., ZACHARIAS S., PINTO J.G., SPANGEHL T., 2006: Analysis of frequency and intensity of European winter storm events from a multi-model perspective, at synoptic and regional scales. Climate Research, 31, 59-74.
LIONELLO P., COGO S., GALATI M.B., SANNA A., 2008: The Mediterranean surface wave climate inferred from future scenario simulations. Global and Planetary Change, 63, 152-162.
LIONELLO P., MALANOTTE-RIZZOLI P., BOSCOLO R. (Eds.), 2006: Mediterranean climate variability. Elsevier, Amsterdam.
MICHELANGELI P.A., VAUTARD R., LEGRAS B., 1995: Weather regimes: recurrence and quasi stationarity. Journal of Atmospheric Science, 52, 1237-1256.
OMSTEDT A., CHEN D., 2001: Influence of atmospheric circulation on the maximum ice extent in the Baltic Sea. Journ. Geophys. Res., 106, 4493-4500.
PIRAZZOLI P.A., 2008: Tendances récentes des facteurs contribuant au risque de submersion sur les côtes atlantiques françaises. La Houille Blanche 01, 72-77. PIRAZZOLI P.A., COSTA S., DORNBUSCH U., TOMASIN A., 2006: Recent evolution of
surge-related events and assessment of coastal flooding risk on the eastern coasts of the English Channel. Ocean Dynamics, 56, 498-512.
PIRAZZOLI P.A., TOMASIN A., 2002: Recent evolution of surge–related events in the northern Adriatic area. Journal of Coastal Research, 18, 537-554.
PIRAZZOLI P.A., TOMASIN A., 2003: Recent near-surface wind changes in the central Mediterranean and Adriatic areas. International Journal of Climatology, 23, 963-973.
PIRAZZOLI P.A., TOMASIN A., 2008a: Sea-level and surges in the Adriatic Sea area: recent trends and possible near-future scenarios. Atti Istituto Veneto di Scienze, Lettere ed Arti, 166, 61-83.
Bollettino Geofisico, a. XXXII, n. 3-4 luglio-dicembre 2009 21 Mediterranean area. Bollettino Geofisico, 31 (1-4), 19-33.
PLAUT G., SIMONNET E., 2002: Large-scale circulation classification, weather regimes and local climate over France, the Alps and Western Europe. Climate Research, 17, 303-324.
SOMOT S., 2005: Modélisation climatique du basin méditerranéen : variabilité et scénarios de changement climatique. PhD. dissertation, Université Paul Sabatier, Toulouse, 239 p. + annexes.
TOMASIN A., 2005: The software “Polifemo” for tidal analysis. Tech. Note 202, ISMAR-CNR, Venice, Italy, 6 p.
TSIMPLIS M.N., ALVAREZ-FANJUL E., GOMIS D., FENOGLIO-MARC L., PÉREZ B., 2005: Mediterranean sea level trends: atmospheric pressure and wind contribution. Geophys. Res. Let., 32 (20), Art. N L20602.
ULLMANN A., PIRAZZOLI P.A., MORON V., 2008: Sea surges around the Gulf of Lions and atmospheric conditions. Global and Planetary Change, 63, 203-214.
ULLMANN A., PIRAZZOLI P.A., TOMASIN A., 2007: Sea surges in Camargue: trends over the 20th century. Continental Shelf Research, 27, 922-934.
ULLMANN A., 2008: Surcotes dans le golfe du Lion et conditions atmosphériques: variabilité contemporaine et future (1905-2100), (Ph. D. dissertation, Univ. Aix-Marseille I, 245 p. + annexes.).
ULLMANN A., MORON V., 2008: Weather regimes and sea surge variations over the Gulf of Lions (French Mediterranean coast) during the 20th century.
International Journal of Climatology, 28, 159-171.
WAKELIN S.L., WOODWORTH P.L., FLATHER R.A., WILLIAMS J.A., 2003: Sea-level dependence on the NAO over the NW European continental shelf. Geophys. Res. Let. 30, doi:10.1029/2003GLO17041.
WANG X.L., SWAIL V.R., ZWIERS F.W., 2006: Climatology and changes of extratropical storm tracks and cyclone activity: Comparison of ERA-40 with NCEP/NCAR Reanalysis for 1958–2001. J. Clim. 19, 3145−3166.