HAL Id: tel-02868695
https://tel.archives-ouvertes.fr/tel-02868695
Submitted on 15 Jun 2020HAL is a multi-disciplinary open access archive for the deposit and dissemination of sci-entific research documents, whether they are pub-lished or not. The documents may come from teaching and research institutions in France or abroad, or from public or private research centers.
L’archive ouverte pluridisciplinaire HAL, est destinée au dépôt et à la diffusion de documents scientifiques de niveau recherche, publiés ou non, émanant des établissements d’enseignement et de recherche français ou étrangers, des laboratoires publics ou privés.
Structures des communautés micronectoniques en
relation avec les conditions environnementales à deux
monts sous-marins peu profonds du sud-ouest de l’Océan
Indien
Pavanee Annasawmy
To cite this version:
Pavanee Annasawmy. Structures des communautés micronectoniques en relation avec les conditions environnementales à deux monts sous-marins peu profonds du sud-ouest de l’Océan Indien. Agricul-tural sciences. Université Montpellier; University of Cape Town. Department of Biological Sciences, 2019. English. �NNT : 2019MONTG087�. �tel-02868695�
Chapter 1: General Introduction
THÈSE POUR OBTENIR LE GRADE DE DOCTEUR
DÉLIVRÉ PAR
L’UNIVERSITÉ DE MONTPELLIER
En Science de la mer
Préparée au sein de l’École doctorale GAIA
Et de l’Unité de recherche UMR MARBEC
En partenariat international avec
The University of Cape Town
(Afrique du Sud)
Patterns among micronekton communities in relation to
environmental conditions at two shallow seamounts in the
south-western Indian Ocean
Présentée par
Pavanee ANNASAWMY
Angelee
Le 24 Septembre 2019
Sous la direction de
Francis MARSAC
(Directeur de thèse)
et
Colin ATTWOOD
(co-Directeur de thèse)
Devant le jury composé de
[Christophe MENKES- Directeur de Recherche, IRD, Nouvelle Calédonie] [Patrice BREHMER- Chargé de Recherche, IRD, Brest]
[Catherine ALIAUME- Professeur, Université de Montpellier] [Coleen MOLONEY- Professeur, University of Cape Town]
[Christophe GUINET- Directeur de Recherche, CEBC-CNRS, Chizé]
[Francis MARSAC- Directeur de recherche, IRD, Sète et University of Cape Town]
[Rapporteur] [Rapporteur] [Présidente du jury] [Examinatrice] [Examinateur] [Directeur de thèse]
Declaration
I hereby declare that except where specific reference is made to the work of others, the
contents of this thesis dissertation are original and have not been submitted in whole or
in part for consideration for any other degree or qualification in this, or any other
University. This dissertation contains three authored accepted papers as main chapters,
as requested for a “PhD by publication” by the University of Montpellier. This
dissertation contains less than 80 000 words excluding appendices, bibliography,
footnotes, tables and equations and has less than 150 figures.
Pavanee Annasawmy,
July 2019
I hereby confirm that I have been granted permission by the University of Cape Town’s
Doctoral Degrees Board to include the following publications in my PhD thesis. The
co-authors have agreed to the inclusion of these publications:
Annasawmy, P., Ternon, J-F., Cotel, P., Cherel, Y, Romanov, E., Roudaut, G.,
Lebourges-Dhaussy, A., Ménard, F., Marsac, F., 2019. Micronekton
distribution and assemblages at two shallow seamounts in the south-western
Indian Ocean: Insights from acoustics and mesopelagic trawl data. Prog.
Oceanogr. 178. https://doi.org/10.1016/j.pocean.2019.102161
Annasawmy, P., Ternon, J-F., Lebourges-Dhaussy, A., Roudaut, G., Herbette, S.,
Ménard, F., Cotel., P., Marsac, F., 2020a. Micronekton distribution as
influenced by mesoscale eddies, Madagascar shelf and shallow seamounts in
the south-western Indian Ocean: an acoustic approach. Deep-Sea Res. II.
Annasawmy, P., Cherel, Y., Romanov, E., Le Loch, F., Ménard, F., Ternon, J-F., Marsac,
F., 2020b. Stable isotope patterns of micronekton at two shallow seamounts
of the south-western Indian Ocean. Deep-Sea Res. II.
SIGNATURE:
DATE: 15
thof July 2019
Acknowledgements
Coming to the end of a long journey, I would like to, first and foremost, thank my thesis
supervisor, Dr. Francis Marsac, for his continuous support, faith and optimism. Francis
provided guidance and assistance throughout my Master’s and PhD degree through the
ICEMASA French-South African International Laboratory, which has given me the
opportunity to work on interesting research questions in collaboration with various
institutions. I aslo wish to thank my thesis co-supervisor Asso. Prof. Colin Attwood for
providing support and assistance. Both Francis and Colin have encouraged the
independent pursuit of my research interests and I am very grateful for this freedom. I
am further grateful to have evolved by their side and to have learnt important skills
necessary in conducting oceanographic research work at an international level.
Helpful comments and advice are thankfully acknowledged from members of my
committee who have followed my work since the beginning. The committee members
included Jean-François Ternon, Anne Lebourges-Dhaussy, Frédéric Ménard, Yves
Cherel and Arnaud Bertrand. I admire their passion for scientific research. I am thankful
for their valuable suggestions to improve this research work, and all the interesting and
stimulating scientific discussions we have had.
I am grateful to the directors of UMR MARBEC (Sète, France) for their warm welcome
and their words of encouragement during my stay in France. I wish to thank the
University of Cape Town, especially Colin Attwood for providing all the necessary
equipment for the organisation of a Taxonomic Workshop at UCT. I also wish to
acknowledge Yves Cherel, Evgeny Romanov and Alexander Butch Hulley who took part
in this workshop to confirm the identification of the mesopelagic fishes and squids
caught during La Pérouse and MAD-Ridge cruises.
This work would not have been possible without all those people who have provided the
necessary training and equipment such that I can complete all the steps required for the
stable isotope analyses in due time:
Freeze-drying equipment: Sebastien Jaquemet (Laboratoire d’écologie marine,
Université de La Réunion/ UMR Entropie); Bronwyn Arendze-Bailey (Molecular and
Cell Biology Department, UCT, South Africa); Dawood Hattas (Department of
Biological Sciences, UCT, South Africa).
Grinding and Lipid removal equipment: Luisa Metral (UMR MARBEC, Sète, France).
Carbonate removal and Encapsulation equipment: François Le Loc’h (UMR LEMAR,
Plouzané, Brest).
Mass Spectrometry analyses were run by Jean-Marie Munaron and Clement Tanvet
(UMR LEMAR, Plouzané, Brest), who have spent long hours in front of the mass
spectrometer and computer to validate the stable isotopes data.
I would also like to acknowledge the captain and crew of the RV Antea for providing
assistance during the data collection. I admire their professionalism and for providing
efficient and quick solutions to unexpected problems encountered during our cruises,
such that the scientific data collection and cruise plan were not affected.
Due to the nature of this co-badged PhD degree, administrative hurdles were varied and
numerous and had to be overcome during these three years. I wish to thank the
administrative staff at UCT, especially within the Department of Biological Sciences
(Claire Khai), MA-RE (Sharon Bosma), the Faculty of Science Postgraduate office
(Ayesha Shaik and Shahieda Samsodien), and IRD (Ghislaine Ferard Pouget), and
acknowledge their patience and support in the face of unexpected and complicated
situations.
This thesis, as well as conference attendance to present findings (10
thWIOMSA
Symposium 2017; WGFAST 2018; ICEMASA Colloquium 2018; SANCOR meeting
2018) was made possible via funding provided by IRD (ARTS scholarship), ICEMASA
bursaries and additional grants from UM and WIOMSA (travel grants). I am further
grateful to ICEMASA for giving me the opportunity to travel to Brest on numerous
occasions to work closely with Anne Lebourges-Dhaussy and Gildas Roudaut in the field
of acoustics, and François Le Loc’h in the field of stable isotopes.
Last but not least, I wish to thank my family for their unconditional love, unwavering
support and faith. This thesis is dedicated to my parents who have showed me the value
of hard work and who have always encouraged me to aim higher.
Table of Contents
Table of Contents
List of Figures ... X List of Tables ... XIII Thesis Abstract ... XIV
Synthèse des travaux en français ... 1
Glossary of principal abbreviations ... 10
Chapter 1: General Introduction ... 12
1.1 Background ... 12
1.1.1 Seamount geology and characteristics ... 12
1.1.2 Physical processes resulting from current-topography interactions ... 13
1.1.3 Biological responses at seamounts ... 18
1.1.4 Large-scale fisheries at seamounts ... 26
1.1.5 Regular seamount visitors... 27
1.1.6 Seamount endemism ... 30
1.1.7 Larval dispersal and seamount connectivity ... 31
1.1.8 Seamount conservation and management strategies ... 31
1.2 Conclusion ... 33
1.3 Thesis Aims and Objectives ... 34
Chapter 2: Pelagic ecosystem and seamounts of the south-western Indian Ocean ... 36
2.1 The South West Indian Ocean: General Overview... 37
2.1.1 Geomorphology and sedimentation ... 37
2.1.2 Water masses and circulation patterns ... 39
2.1.3 Biogeochemical provinces of the SWIO ... 43
2.1.4 Biological compartments of the ISSG and EAFR provinces ... 45
2.2 Industrical fisheries in the SWIO ... 55
2.2.1 Demersal fisheries ... 55
2.2.2 Pelagic fisheries ... 57
2.3 Marine governance in the SWIO ... 59
2.4 Seamounts of the SWIO ... 63
2.4.1 Seamount Endemism ... 64
2.4.2 Deep-sea fauna at SWIR seamounts ... 65
2.4.3 Pelagic ecosystem at SWIR seamounts ... 65
2.4.4 Pollution impact on SWIR seamounts ... 66
Table of Contents
2.5.1 Bathymetry ... 67
2.5.2 Nutrient concentrations ... 69
2.5.3 Phytoplankton communities at MAD-Ridge seamount ... 72
2.5.4 Mesozooplankton at La Pérouse and MAD-Ridge vs. Walters Shoal ... 73
2.5.5 Ichthyoplankton assemblages at La Pérouse and MAD-Ridge vs. Walters Shoal ... 74
2.6 Conclusion ... 77
Chapter 3: Influence of mesoscale eddies, shallow seamounts and continental shelf on micronekton’s distribution ... 78
Abstract ... 80
3.1. Introduction ... 81
3.2 Material and Methods ... 83
3.2.1 Cruises ... 83
3.2.2 Satellite data ... 84
3.2.3 Field Sampling ... 84
3.2.4 Data visualisation ... 88
3.2.5 Statistical analyses ... 89
3.2.6 Taylor column theoretical calculation ... 89
3.3 Results ... 90
3.3.1 Synoptic ocean circulation during the MAD-Ridge cruise... 90
3.3.2 Hydrography and chlorophyll concentration during the MAD-Ridge cruise ... 93
3.3.3 Micronekton acoustic densities at the MAD-Ridge seamount ... 93
3.3.4 Environmental factors influencing micronekton distribution during the MAD-Ridge cruise ... 100
3.3.5 Physical and biological oceanography at La Pérouse seamount ... 102
3.3.6 Comparison of micronekton acoustic densities at both seamounts ... 103
3.4 Discussion ... 106
3.4.1 Oceanographic conditions during the MAD-Ridge and La Pérouse cruises ... 106
3.4.2 Diel vertical migration of micronekton ... 107
3.4.3 Influence of mesoscale features on micronekton vertical and horizontal distribution .... 108
3.4.4 Influence of seamounts on micronekton vertical and horizontal distributions ... 109
3.5 Concluding Remarks ... 112
Inter-chapter I ... 114
Chapter 4: Micronekton distributions and assemblages at two shallow seamounts of the south-western Indian Ocean ... 116
Table of Contents
4.2 Methods ... 121
4.2.1 Study area and scientific cruises ... 121
4.2.2 Satellite monitoring of La Pérouse and MAD-Ridge seamounts ... 123
4.2.3 Acoustic surveys ... 123
4.2.4 Net sampling ... 124
4.2.5 Data visualisation and statistical analyses ... 126
4.3 Results ... 127
4.3.1 Prevailing environmental conditions at La Pérouse and MAD-Ridge seamounts ... 127
4.3.2 Vertical and horizontal distributions of biological scatterers at MAD-Ridge ... 129
4.3.3 Taxonomic composition of trawl catches ... 136
4.3.4 Micronekton community compositions and acoustic backscatter intensities ... 147
4.4 Discussion ... 154
4.4.1 Sampling biases and constraints ... 154
4.4.2 Oceanography and biological response ... 154
4.4.3 Effect of seamounts on the DVM of micronekton ... 155
4.4.4 Micronekton scattering layers and assemblages at La Pérouse and MAD-Ridge ... 156
4.4.5 Do seamounts have higher abundances/biomasses/densities over the summit? ... 158
4.5 Concluding remarks ... 160
Inter-chapter II ... 162
Chapter 5: Stable isotope patterns of mesopelagic communities over two shallow seamounts of the south-western Indian Ocean ... 164
Abstract ... 166
5.1 Introduction ... 167
5.2 Material and methods ... 169
5.2.1 Study sites ... 169
5.2.2 Satellite observations ... 172
5.2.3 Sampling and sample processing ... 172
5.2.4 Stable isotope analysis ... 176
5.2.5 Data analyses ... 177
5.3 Results ... 180
5.3.1 Prevailing environmental conditions at La Pérouse and MAD-Ridge seamounts ... 180
5.3.2 General foodweb structure ... 181
5.3.3 Relationships between δ13C and δ15N values ... 187
5.3.4 Trophic levels at La Pérouse and MAD-Ridge seamounts... 187
5.3.5 Effect of feeding mode of gelatinous plankton and micronekton on stable isotope values ... 189
Table of Contents
5.3.6 Effect of size of micronekton on δ15N values ... 191
5.3.7 Effect of time of day on δ13C and δ15N values at MAD-Ridge seamount ... 196
5.3.8 Seamount effect on δ13C and δ15N values of omnivorous/carnivorous fishes ... 197
5.4 Discussion ... 198
5.4.1 Sampling bias and constraints ... 198
5.4.2 Trophic interactions at La Pérouse and MAD-Ridge seamounts ... 199
5.4.3 Influence of feeding mode and size on δ13C and δ15N values ... 201
5.4.4 Seamount effect on δ13C and δ15N values of fish species ... 203
5.5 Concluding Remarks ... 204
Chapter 6: General Discussion and Conclusion ... 206
6.1 Introduction ... 207
6.2 Review of the thesis aims and objectives ... 207
6.3 La Pérouse and MAD-Ridge seamount ecosystems ... 208
6.4 Horizontal and vertical distributions of micronekton ... 216
6.5 Trophic relationships and importance of micronekton in foodwebs ... 218
6.6 Ecosystem functioning at seamounts ... 220
6.7 Growing interest in commercialising micronekton communities ... 223
6.8 Conservation measures and issues ... 224
6.9 Future Perspectives... 227
6.9.1 Multi-frequency acoustic classification ... 227
6.9.2 Trace metal analyses ... 228
6.10 Conclusion ... 230
References ... 232
List of Figures
List of Figures
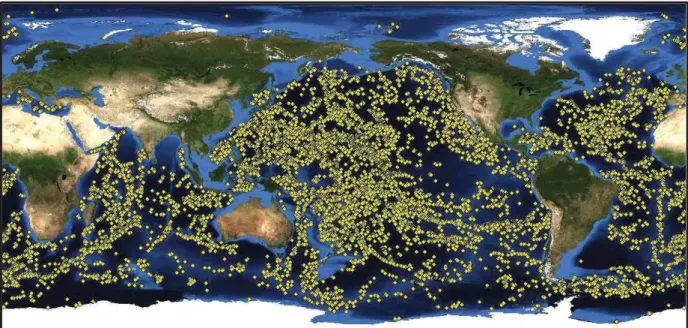
FIGURE1.1ESTIMATEDGLOBALDISTRIBUTIONOFLARGESEAMOUNTSWITHANELEVATION>1500M. ... 12
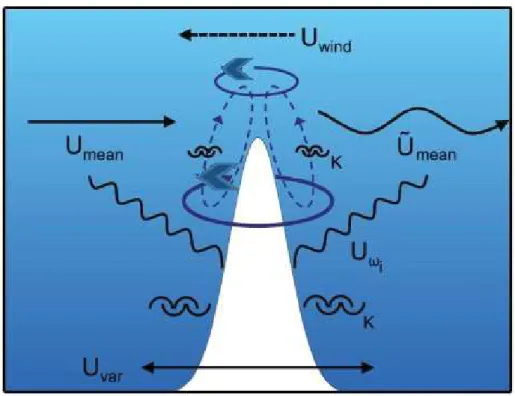
FIGURE1.2CHARACTERISTICFEATURESOFMOTIONATANISOLATEDSOUTHERNHEMISPHERESEAMOUNT ... 14
FIGURE1.3CHARACTERISTICFEATURESOFMOTIONATANISOLATEDSEAMOUNT,INCLUDINGFLOWPATTERNS,AND FEATURESSUCHASTAYLORCOLUMNS,ISOPYCNALDOMINGANDPROCESSESSUCHASENHANCEDVERTICAL MIXING ... 16
FIGURE1.4DIAGRAMOFTHEMAINFACTORSCONTROLLINGTHELOCALISEDDYNAMICPROCESSESATISOLATED TOPOGRAPHICFEATURES ... 17
FIGURE1.5(A-E)SEQUENTIALACOUSTICTRANSECTSOFTHE120KHZFREQUENCYACROSSSIXTYMILEBANK ... 19
FIGURE1.6SCHEMATICSHOWINGTHEBOTTOMTRAPPINGOFVERTICALLYMIGRATINGZOOPLANKTONOVERA SEAMOUNT ... 20
FIGURE1.7TIME-SERIESFROM19:31PMTO06:30AMOFACOUSTICTRANSECTSOFTHE38KHZFREQUENCYOVER SOUTHEASTHANCOCKSEAMOUNT ... 25
FIGURE1.8INTERACTIONSBETWEENTHEDIFFERENTGROUPSOFDEEP-PELAGICFISHESANDSEAMOUNTSOF VARIOUSHEIGHTS ... 25
FIGURE1.9RELATIVESIZEOFHISTORICAL(1960-1980)SEAMOUNTFISHERIESFORALFONSINO,ORANGEROUGHY, OREOS,CARDINALFISH,REDFISH,PELAGICARMORHEAD,MACKEREL,ROUNDNOUSEGRENADIER,SABLEFISH, NOTOTHENIDCODSANDTOOTHFISH. ... 27
FIGURE1.10GLOBALCATCHOF(A)PRIMARYSEAMOUNTSPECIES,(B)SECONDARYSEAMOUNTSPECIES ... 27
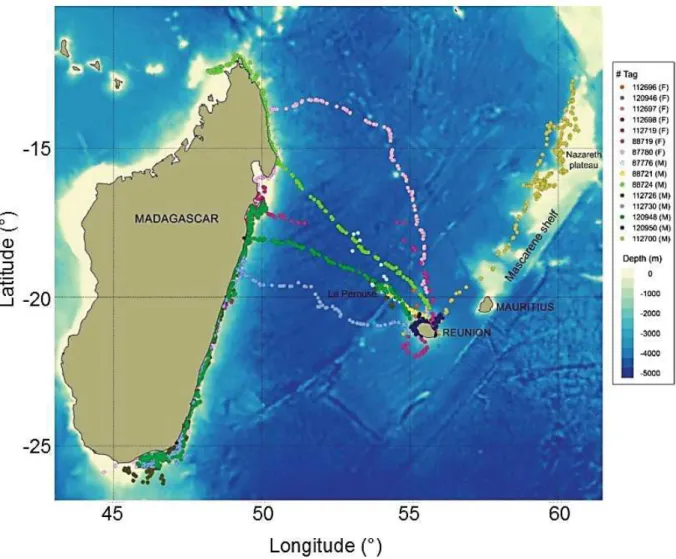
FIGURE1.11RECEIVEDARGOSLOCATIONSFROMHUMPBACKWHALESTAGGEDINREUNIONIN2013 ... 29
FIGURE2.1MAJORRIDGESYSTEM,BASINSANDTWOHOTSPOTSOFTHEINDIANOCEAN ... 38
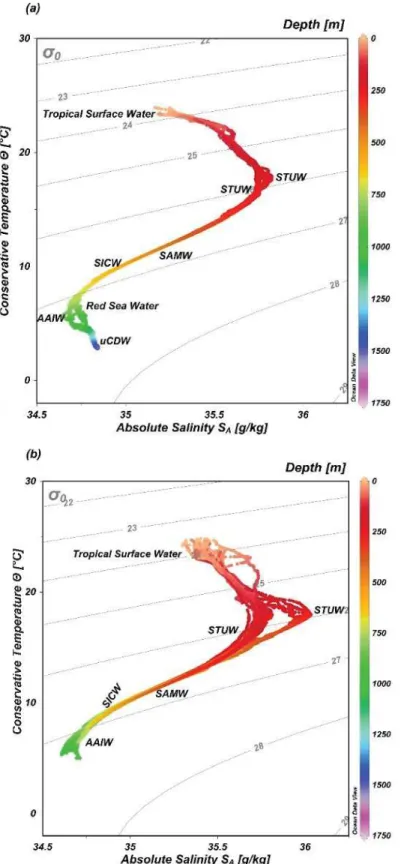
FIGURE2.2TEMPERATURE-SALINITYDIAGRAMSINDICATINGTHEWATERMASSESINTHESWIO ... 41
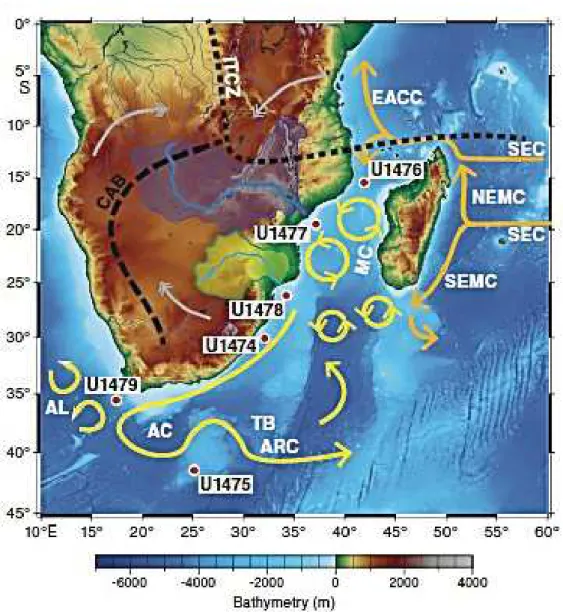
FIGURE2.3SCHEMATICDIAGRAMOFMAJORSURFACECURRENTSINTHESWIO……….43
FIGURE2.4LONGHURST’S(1998)BIOGEOCHEMICALPROVINCESEAFRANDISSGOFTHESWIO. ... 44
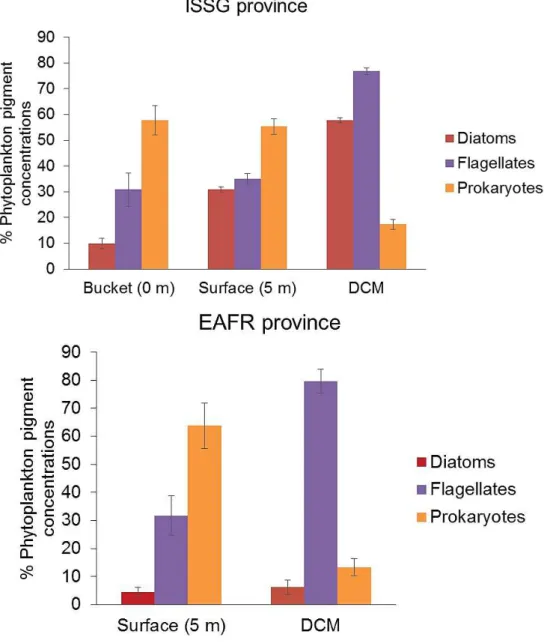
FIGURE2.5RELATIVECONTRIBUTIONSOFDIATOMS,FLAGELLATESANDPROKARYOTESWITHINTHEISSGANDEAFR PROVINCES. ... 46
FIGURE2.6MODELLEDVERTICALDISTRIBUTIONOF(A)CETACEANSAND(B)SCATTERINGLAYERS(PREYITEMSFOR TOPPREDATORS)INTHEWATERCOLUMN. ... 51
FIGURE2.7TRAJECTORIESOFHUMPBACKWHALESTOCKSANDSUB-STOCKSRECOGNISEDBYTHEINTERNATIONAL WHALINGCOMMISSION. ... 52
FIGURE2.8SCHEMATICILLUSTRATIONOFTHENICHEPARTITIONINGOFALBACORE,BIGEYE,SKIPJACKAND YELLOWFINTUNASINTHEWESTERNINDIANOCEAN. ... 54
FIGURE2.9CATCHES(IN1000TONS)FROM1977-2015FORTHEMOSTCOMMONLYCAUGHTDEEP-SEAFISHESFROMTHE SOUTHERNINDIANOCEAN. ... 57
FIGURE2.10LONGLINECATCHES(BY1°SQUARE)OFYELLOWFIN,BIGEYE,ALBACORETUNASANDSWORDFISHIN TONSFROMFRANCE(REUNIONISLAND),MAURITIUSANDSEYCHELLESFLEETSINTHESWIOFROM 2001-2017………...58
FIGURE2.11LONGLINECATCHES(BY5°SQUARE)OFYELLOWFIN,BIGEYE,ALBACORETUNASANDSWORDFISHIN TONSFROM1995TO2015,COMBININGALLLONGLINEFLEETSOPERATINGINTHEINDIANOCEAN ... 59
FIGURE2.12MAPOFTHESWIOSHOWINGTHEDISTRIBUTIONOFSEAMOUNTSHAVINGELEVATIONS>1000MAND PROTECTED,CLOSEDANDACCESSREGULATEDAREAS. ... 62
FIGURE2.13SEAMOUNTSOFTHESWIOBEINGTHEFOCUSOFDEDICATEDRESEARCHCRUISESFROM1964TO 2017:………..64
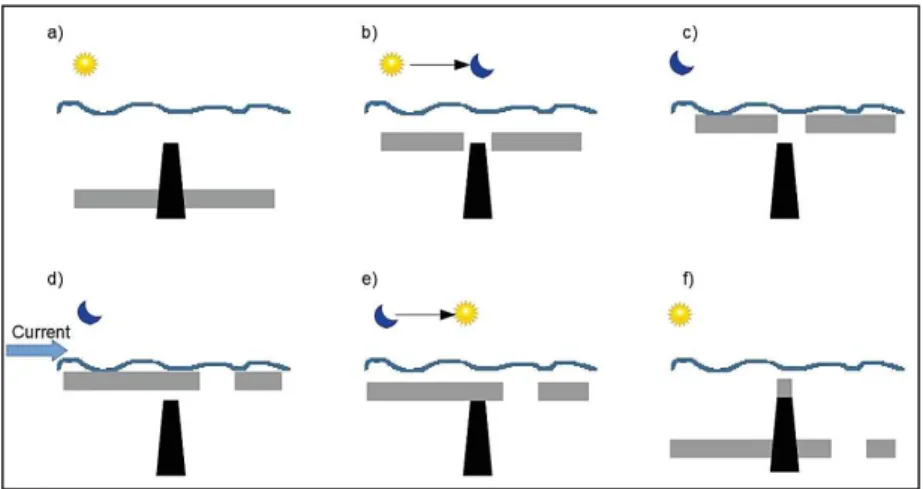
FIGURE2.14BENTHICLITTERDENSITIESANDCOMPOSITION,OBSERVEDBYREMOTELYOPERATEDVEHICLEVIDEO SYSTEMS,FORSEAMOUNTSOFTHESWIR ... 67
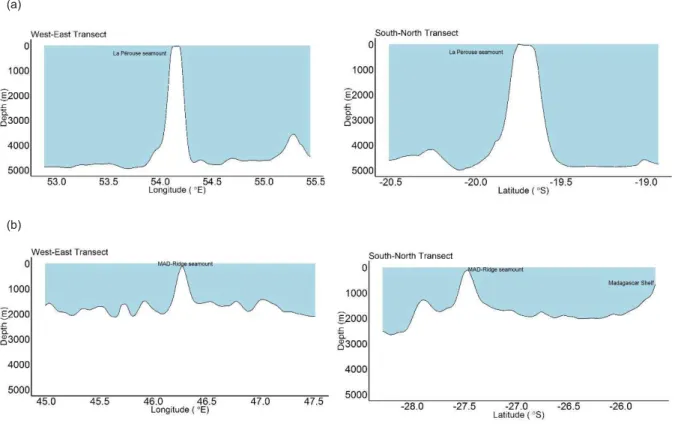
FIGURE2.15BATHYMETRYALONGTHEWEST-EASTANDSOUTH-NORTHTRANSECTSAT(A)LAPÉROUSEAND(B) MAD-RIDGESEAMOUNTS ... 68
FIGURE2.16A3D-BATHYMETRYOFLAPÉROUSEANDMAD-RIDGESEAMOUNTS ... 69
FIGURE2.17CONCENTRATIONSOFNITRATE,NITRITE,SILICATEANDPHOSPHATEALONGCYCLONICAND ANTICYCLONICSTATIONSACROSSTHEWEST-EASTANDTHEANTICYCLONICSTATIONSANDSHELF STATIONS ACROSSTHESOUTH-NORTHTRANSECTSDURINGMAD-RIDGECRUISE. ... 70
FIGURE2.18VERTICALPROFILESOFNITRATE,NITRITE,SILICATEANDPHOSPHATEATLAPÉROUSESEAMOUNT. ... 71
FIGURE2.19INTEGRATEDPROCHLOROCOCCUS,SYNECHOCOCCUSANDPICOEUKARYOTESCARBONBIOMASSAND CHLOROPHYLLCONCENTRATIONSFORALLSTATIONSWITHINTHECYCYLONE ALONGTHEWEST-EASTAND WITHINTHEANTICYCLONEALONGTHENORTH-SOUTHTRANSECTSDURINGTHEMAD-RIDGECRUISE ... 73
FIGURE2.20LARVALFISHDENSITIESANDBOTTOMDEPTHATEACHSTATIONFOR(A)LAPÉROUSE,(B)MAD-RIDGE AND(C)WALTERSSHOAL ... 75
FIGURE3.1(A)MAPOFMAD-RIDGEANDLAPÉROUSECTDSTATIONSCONDUCTEDINTHEEAFRANDISSGPROVINCES RESPECTIVELY.(B)LAPÉROUSECTDSTATIONSAREPLOTTEDONTHEBATHYMETRY(M)... 84
FIGURE3.2(A)SATELLITESURFACEABSOLUTEDYNAMICHEIGHTON19NOVEMBER2016DURINGMAD-RIDGECRUISE ... 91
FIGURE3.2VERTICALDISTRIBUTIONSOF(B)CURRENTSPEED,(C)TEMPERATURE,AND(D)CHLOROPHYLLAFOR MAD-RIDGELEG1WEST-EASTTRANSECTANDSOUTH-NORTHTRANSECT... 92
FIGURE3.3(A)WEST-EASTTRANSECTOFMAD-RIDGE:MEANMICRONEKTONACOUSTICDENSITYFROMDAY_I-DAY_V ANDNIGHT_1-NIGHT_IV………..………...94
FIGURE3.3(B)ECHOGRAMOFTHE38KHZFREQUENCYACROSSCTDSTATIONS6-8 ... 95
FIGURE3.3(C)RGBCOMPOSITEIMAGESOFSVVALUESACROSSCYCLONICCTDSTATIONS2-3AND4AND ANTICYCLONICSTATIONS10-12ANDSTATIONS13-15 ... 96
List of Figures
FIGURE3.4(A)SOUTH-NORTHTRANSECTOFMAD-RIDGE:MEANMICRONEKTONACOUSTICDENSITY FROMDAY_VITO DAY_XANDNIGHT_VITONIGHT_IX ... 97 FIGURE3.4(B)RGBCOMPOSITEIMAGESOFSVVALUESATANTICYCLONICCTDSTATIONS21-23ANDSHELFSTATIONS
30-31 ... 99 FIGURE3.5(A)BOXPLOTSOFTHETOTALMICRONEKTONACOUSTICDENSITIES OFTHE38KHZFREQUENCYINTHE
DEEP,INTERMEDIATE,SURFACELAYERSANDTOTALWATERCOLUMNFORTHETRANSECTSATCTDSTATIONOF MAD-RIDGECRUISE ... 100 FIGURE3.5MEANANDSTANDARDDEVIATIONSOFTHEVARIABLES(B)SLA,(C)TEMPERATUREAT100M,(D)FMAX
DEPTH,(E)INTEGRATEDCHLOROPHYLLABETWEEN2-200M,AND(F)ZOOPLANKTONBIOVOLUMEPLOTTEDFOR THEAC,C,DIPOLEI.,FLANK/AC,SHELFANDSUMMIT/ACSTATIONS. ... 101 FIGURE3.6SATELLITESURFACEABSOLUTEDYNAMICHEIGHTON16SEPTEMBER2016DURINGLAPÉROUSE
CRUISE………103
FIGURE3.7MAPOFLAPÉROUSEANDMAD-RIDGE,DAYTIMEANDNIGHT-TIMEACOUSTICTRANSECTSPLOTTEDON THEBATHYMETRY.BARCHARTOFMEANACOUSTICDENSITIES±STANDARDDEVIATIONSDURINGDAYAND NIGHTAT(A)LAPÉROUSEAND(B)MAD-RIDGE ... 104 FIGURE3.7RGBCOMPOSITEIMAGESOFSVVALUESOF(C)LAPÉROUSEDAY,(D)MAD-RIDGEDAY,(E)LAPÉROUSE
NIGHTAND(F)MAD-RIDGENIGHT……….105
FIGURE4.1MAPOFTHE(A)LAPÉROUSETRAWLSTATIONSNUMBERED1TO10,(B)MAD-RIDGETRAWLSTATIONS NUMBERED1TO17PLOTTEDONTHEBATHYMETRY. ... 122 FIGURE4.2AVERAGEDSEALEVELANOMALY(MSLA)MAP,WITHLAPÉROUSEANDMAD-RIDGESEAMOUNTSSHOWN
ASBLACKSTARSYMBOLS,ANDDATED(A)16-28SEPTEMBER2016,(B)14-23NOVEMBER2016.(C)AVERAGED SATELLITEIMAGEOFSURFACECHLOROPHYLLADISTRIBUTIONFROM18/09/2016TO07/12/2016. ... 128 FIGURE4.3(A)PETAL-SHAPEDACOUSTICTRANSECTSITOVIICARRIEDATMAD-RIDGE,STARTINGATSUNSET/NIGHT
ATTHESUMMITANDENDINGDURINGTHEDAYATTHESUMMIT.(B-H)BIOMASSDENSITYESTIMATESFORTHE 38KHZFREQUENCYINTHESURFACE,INTERMEDIATE,DEEPLAYERS,ANDTOTALWATERCOLUMNFORPETALS I-VII ... 130 FIGURE4.4ECHOGRAMSOFTHE38KHZFREQUENCYDURING(A)PETALIIATSUNSET,NIGHT,SUNRISEANDDAYTIME,
(B)PETALIII,AND(C)PETALIV. ... 132 FIGURE4.5(A)NIGHT-TIMEACOUSTICTRANSECTSIIITOVIIFROMTHEMAD-RIDGESEAMOUNTSUMMITTO14NMI
FROMTHESUMMIT ... 133 FIGURE4.5(B)ACOUSTICDENSITYESTIMATESFORTHE38KHZFREQUENCYINTHESURFACELAYERATNIGHT,FROM
THESUMMITTO14NMIAWAYFROMTHESEAMOUNT(VICINITY),FORPETALSIIITOVII. ... 134 FIGURE4.5(C)RGBCOMPOSITESOFSVVALUESFROM10-250MFORTHESELECTEDACOUSTICTRANSECTSIIITOVII . 135 FIGURE4.6ATLAPÉROUSEANDMAD-RIDGESEAMOUNTS,(A)BOXPLOTOFTOTALABUNDANCEANDBIOMASS
ESTIMATES,(B)SPECIESRICHNESSWITHINCREASINGSAMPLINGEFFORT,(C)LENGTHDISTRIBUTIONSOF SELECTEDGELATINOUSPLANKTON,CRUSTACEANS,CEPHALOPODSANDEPI-MESOPELAGICFISHESSAMPLED. ... 137 FIGURE4.7(A)SIMILARITYCLUSTERDENDROGRAMOFSPECIESABUNDANCEATLAPÉROUSETRAWLSTATIONS1TO
10... 138 FIGURE4.7(B)SCHEMATICDIAGRAMOFLAPÉROUSESEAMOUNT………..140
FIGURE4.7BUBBLEPLOTOVERLAYSOFMDSORDINATIONREPRESENTINGTHERELATIVEABUNDANCEOFCOMMON (C)DEEPDWELLING,(D)ANDSEAMOUNTFLANKASSOCIATED
SPECIES……….142
FIGURE4.8(A)SIMILARITYCLUSTERDENDROGRAMOFSPECIESABUNDANCEATMAD-RIDGETRAWLSTATIONS1TO 17………...143
FIGURE4.8(B)SCHEMATICDIAGRAMOFMAD-RIDGESEAMOUNT………...145 FIGURE4.8BUBBLEPLOTOVERLAYSOFTHEMDSORDINATIONREPRESENTINGTHERELATIVEABUNDANCEOF
COMMON(C)SHALLOW-DWELLINGANDVERTICALMIGRATORYFISHSPECIES,(D)DEEP-DWELLING,(E)AND SEAMOUNTSUMMITANDFLANKASSOCIATEDSPECIES……….146
FIGURE4.9(A)SCHEMATICSOFLAPÉROUSESEAMOUNT,LISTINGTHEMOSTDOMINANTTAXAWITHINTHECLUSTER GROUPS……….148
FIGURE4.9(B)SCHEMATICSOFMAD-RIDGESEAMOUNT,LISTINGTHEMOSTDOMINANTTAXAWITHINTHECLUSTER GROUPS……….150
FIGURE4.10(A-D)RGBCOMPOSTESOFSVVALUESOFTRAWLS14AND15(FLANK),16(SUMMIT)AND21(SOUTHERN MOZAMBIQUECHANNEL)DURINGMAD-RIDGE………152
FIGURE5.1(A)LOCATIONOFMAD-RIDGEANDLAPÉROUSESEAMOUNTSINTHEEAFRANDISSGPROVINCES, RESPECTIVELY.MAPOF(B)LAPÉROUSETRAWLSTATIONSNUMBERED1TO10,(C)MAD-RIDGETRAWL
STATIONSNUMBERED1TO17PLOTTEDONTHEBATHYMETRY ... 171 FIGURE5.2(A)AVERAGEDSATELLITEIMAGEOFSURFACECHLROPHYLLACONCENTRATIONSFROM18/09/2016TO
07/12/2016ATLAPÉROUSEANDMAD-RIDGE ... 172 FIGURE5.2(B)MONTHLYMEANSEASURFACECHLOROPHYLLACONCENTRATIONS FROMJANUARYTODECEMBER
2016FORTHEREGIONSDEFINEDBYTHEREDSQUARESINFIGURE5.2(A). ... 181 FIGURE5.3(A)BIVARIATEPLOTOFΔ15NANDΔ13CVALUES(‰)FORPARTICULATEORGANICMATTERATTHESURFACE
ANDTHEMAXIMUMFLUORESCENCE,ZOOPLANKTON,GELATINOUSORGANISMS,CRUSTACEANS,SQUIDSAND MESOPELAGICFISHESSAMPLEDATLAPÉROUSESEAMOUNT. ... 183 FIGURE5.3(B)BIVARIATEPLOTOFΔ15NANDΔ13CVALUES(‰)FORPARTICULATEORGANICMATTERATTHESURFACE
List of Figures
FIGURE5.4BOXPLOTSOFΔ13CANDΔ15NVALUES(‰)OFTHEFOODWEBCOMPONENTSPOM-SURF,POM-FMAX, ZOOPLANKTON,GELATINOUSORGANISMS,CRUSTACEANS,SQUIDSANDMESOPELAGICFISHESATLAPÉROUSE ANDMAD-RIDGE ... 186 FIGURE5.5(A)Δ15N(MEAN±S.D.)VALUES(‰)ANDESTIMATEDTROPHICLEVEL OFPOM-SURF,POM-FMAX,
ZOOPLANKTON,GELATINOUSANDSAMPLEDMICRONEKTONSPECIESATLAPÉROUSESEAMOUNT... 188 FIGURE5.5(B)Δ15N(MEAN±S.D.)VALUES(‰)ANDESTIMATEDTROPHICLEVELOFPOM-SURF,POM-FMAX,
ZOOPLANKTON,GELATINOUSANDSAMPLEDMICRONEKTONSPECIESATMAD-RIDGESEAMOUNT... 189 FIGURE5.6(A)HIERARCHICALCLUSTERINGOFΔ13CANDΔ15NVALUES(‰)OFSAMPLEDGELATINOUSORGANISMS,
CRUSTACEANS,SQUIDSANDMESOPELAGICFISHESATLAPÉROUSESEAMOUNT. ... 190 FIGURE5.6(B)HIERARCHICALCLUSTERINGOFΔ13CANDΔ15NVALUES(‰)OFSAMPLEDGELATINOUSORGANISMS,
CRUSTACEANS,SQUIDSANDMESOPELAGICFISHESATMAD-RIDGE. ... 191 FIGURE5.7Δ15NVALUES(‰)OF(A)FISH:SIGMOPSELONGATUS,(B)FISH:CERATOSCOPELUSWARMINGII,(C)FISH:
ARGYROPELECUSACULEATUS,(D)CRUSTACEAN:FUNCHALIASP.,(E)FISH:DIAPHUSSUBORBITALIS,(F)SQUID: ABRALIOPSISSP.,(G)FISH:CHAULIODUSSLOANI,(H)FISH:LEPTOCEPHALI,PLOTTEDAGAINSTSIZEINMMATLA PÉROUSEANDMAD-RIDGE ... 193 FIGURE5.8(A)Δ15NVALUES(‰)OFMESOPELAGICFISHESFROMLAPÉROUSEANDMAD-RIDGESEAMOUNTVICINITIES
ANDFROMTHEMOZAMBIQUECHANNEL,PLOTTEDAGAINSTTHEIRSTANDARDLENGTHS (MM)……….195
FIGURE5.8(B)BIVARIATEPLOTSOFΔ15NANDΔ13CVALUES(‰)FORSELECTEDSEAMOUNTFLANK-AND SUMMIT-ASSOCIATEDFISHSPECIES………..196
FIGURE5.9BOXPLOTSOFΔ13CANDΔ15NVALUES(‰)OFOMNIVOROUS/CARNIVOROUSMESOPELAGICFISHESATLA PÉROUSEFLANKANDVICINITYSTATIONSAND,MAD-RIDGEVICINITY,FLANKANDSUMMIT,ANDSTATIONS FROMTHESOUTHERNMOZAMBIQUECHANNEL………197
FIGURE6.1(A)MAPOFTHEMICROTONSTATIONSANDLAPÉROUSESEAMOUNTINTHEISSGPROVINCE,OFTHEMESOP 2009STATIONS,MADAGASCARSHELFSTATIONANDMAD-RIDGESTATIONSINTHEEAFRPROVINCE. ... 220 FIGURE6.1(B)MEANSADURINGMESOP2009CRUISEINTHEEAFR,MICROTONCRUISEINTHEISSGPROVINCES,AT
MAD-RIDGEANDLAPÉROUSESEAMOUNTSANDOVERTHEMADAGASCARSHELFFORDAYANDNIGHT
List of Tables
List of Tables
TABLE 3.1 LIST OF MAD-RIDGE LEG 1 CLASSIFIED HYDROGRAPHIC STATIONS ………86 TABLE 5.1 SUMMARY OF TRAWL STATIONS DURING LA PEROUSE AND MAD-RIDGE CRUISES…………...174
TABLE 5.2LINEAR REGRESSION MODELS FITTED TO Δ15N VALUES (‰) WITH RESPECT TO BODY LENGTH AND THE SEAMOUNT VARIABLE OF 8 MICRONEKTON TAXA-SIGMOPS ELONGATUS,CERATOSCOPELUS WARMINGII, ARGYROPELECUS ACULEATUS,FUNCHALIA SP.,DIAPHUS SUBORBITALIS,ABRALIOPSIS SP.,CHAULIODUS SLOANI, AND LEPTOCEPHALI. ... 194
TABLE 6.1 SUMMARY OF THE ECOSYSTEM FUNCTIONING AT LA PEROUSE AND MAD-RIDGE
Thesis Abstract
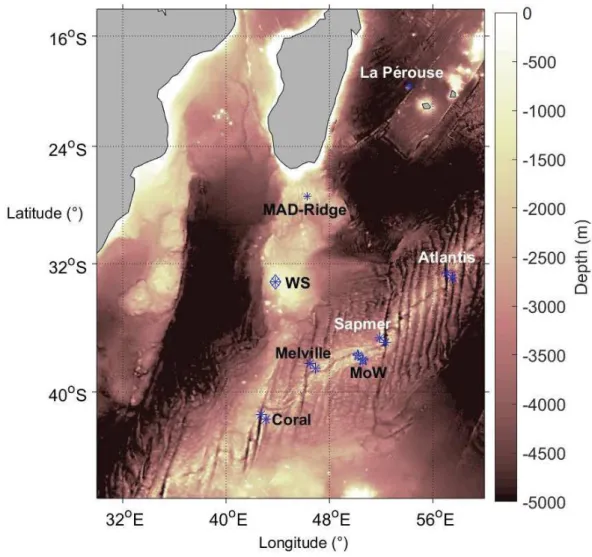
Seamounts are ubiquitous topographic features across all ocean basins. They rise steeply through the water column from abyssal depths. Depending on their size, shape and summit depths, seamounts reportedly have an influence on the physical flow regimes which may promote the aggregation of zooplankton, micronekton, and top predators above or in the immediate vicinity of their summits. Micronekton form a key trophic link between zooplankton and top marine predators, and are divided into the broad categories: crustaceans, cephalopods and mesopelagic fishes. The vertical and horizontal distributions, assemblages and trophic relationships of micronekton were investigated at two shallow seamounts of the south-western Indian Ocean. La Pérouse is a steep bathymetric feature rising from a deep seabed located at 5000 m and with a summit depth at ~60 m below the sea level. This seamount is located at the north-western periphery of the oligotrophic Indian South Subtropical Gyre province. A seamount to the south of Madagascar, named “MAD-Ridge” in this study, has a summit depth at ~240 m below the sea level and rises from a base at ~1600 m. MAD-Ridge is located within an “eddy corridor” within the productive East African Coastal Province. The micronekton acoustic densities were greater at MAD-Ridge relative to La Pérouse, in accordance with the difference in productivity between the two sites. Physical processes within the cyclonic mesoscale eddy sampled during the MAD-Ridge cruise led to enhanced micronekton acoustic densities in the eddy relative to the MAD-Ridge seamount. While the shallow scattering layer (0-200 m) consisted of common oceanic micronekton species, the summits and flanks of La Pérouse and MAD-Ridge both showed presence of resident or seamount-associated fish species during day and night. Micronekton were also shown to exhibit a range of migration strategies such as diel vertical migration, mid-water migration and no diel migration. However, despite the differing productivity between both pinnacles, crustaceans, smaller-sized squids and mesopelagic fishes exhibited trophic levels ranging from 3 to 4 at both seamounts. This thesis highlights important knowledge gaps on seamount ecosystems and ecological patterns associated to shallow pinnacles. It also underlines the importance of studying seamount ecosystems of the south-western Indian Ocean in order to promote management and conservation measures for a sustainable use of such specific environments.
Synthèse des travaux en français
Synthèse des travaux en français
Les monts sous-marins sont des structures bathymétriques s'élevant de manière abrupte dans la colonne d'eau depuis une profondeur d'au moins 1000 m. Ils sont le plus souvent d'origine volcanique et sont répartis dans tous les bassins océaniques. En tant qu'obstacle topographique, les monts sous-marins peuvent être sources d’enrichissement biologique en influençant la circulation océanique qui impacte la disponibilité en sels nutritifs et les communautés marines le long de la chaine alimentaire (Pitcher et al., 2007). Les monts sous-marins peuvent également créer des perturbations locales qui favorisent l'agrégation des organismes marins, du phytoplancton aux prédateurs supérieurs. Le Pétrel de Barau, un oiseau marin qui s'alimente sur des zones productives en phytoplancton et en micronecton, comme la ride qui s’étend au sud de Madagascar, en est un exemple bien décrit (Pinet et al., 2012). Ainsi les monts sous-marins sont souvent considérés comme des points chauds de biodiversité (Morato et al., 2010), avec un certain degré d'endémisme répertorié dans la littérature, en particulier pour les espèces benthiques (Richer de Forges et al., 2000; Worm et al., 2003). Il a été constaté que 30-40% de la faune en poisson sur le sommet du Walters Shoal est endémique aux groupes d'îles connues comme les "West-Wind Islands" (Collette et Parin, 1991). Les monts sous-marins sont connus également pour agréger des espèces de poissons à forte valeur commerciale comme les thons et les poissons à rostre (Fonteneau, 1991; Holland et Grubbs, 2007, Marsac et al., 2014) et sont par conséquent soumis à une pression de pêche. Environ 15% des prises de thons à la palangre dans la zone de la Réunion provient de deux carrés statistiques adjacents au mont La Pérouse (Marsac et al., 2020).
Cependant, force est de constater que les monts sous-marins de l’océan Indien sont peu étudiés comparés aux monts Condor, Great Meteor, Vema et Kelvin de l’Atlantique ou les monts Bowie, Cross, Graveyard, Hancock, Hawaiian-Emperor, Jasper, Lord Howe, et Tasmanian du Pacifique, malgré un effort de pêche non négligeable sur ces structures. Cette thèse s’inscrit dans le cadre d’un projet du IIOE-2 (International Indian Ocean Expedition-2) qui a pour but de mieux comprendre l’écosystème pélagique autour de deux monts sous-marins du sud-ouest de l’Océan Indien. La Pérouse est un mont peu profond qui s’élève à environ 60 m sous la
Synthèse des travaux en français
l’Inde). Sur la ride de Madagascar se situe un autre mont peu profond qui s’élève d’une base à 1600 m et qui culmine à environ 240 m sous la surface de la mer. Ce mont a été baptisé MAD-Ridge dans cette étude. Deux campagnes océanographiques ont été organisées en 2016 à bord du navire Antea de l’Institut de recherche pour le développement (IRD, France). Le but de la campagne La Pérouse était de charactériser l’environnement physique et biologique afin d’évaluer un possible impact du guyot sur la productivité océanique dans une zone généralement qualifiée d’oligotrophe, traversée par le courant sud-équatorial. Le thème général de la campagne MAD-Ridge était d’étudier l’influence des processus physiques liés aux interactions entre la circulation océanique et la topographie sur la production biologique autour du mont sous-marin.
Alors que les bas niveaux trophiques- le phytoplancton, zooplancton, l’ichthyoplancton ainsi que les prédateurs supérieurs ont été étudiés dans cette zone, peu d’études se sont intéressées au micronecton. Le micronecton est constitué principalement de crustacés, céphalopodes et poissons mésopélagiques qui mesurent de 2 à 20 cm en longueur. Bien que les gélatineux ne fassent pas officiellement partie de ce groupe, les salpes et pyrosomes, constituent une biomasse importante dans les chaluts mésopélagiques et jouent un rôle capital dans la pompe biologique de carbone. Certaines espèces de gélatineux sont les proies des poissons mésopélagiques et de prédateurs superieurs tels que le thon. Mes travaux de thèse ont donc pour but de contribuer à combler des lacunes sur le compartiment micronectonique associé aux écosystèmes des monts sous-marins. Les objectifs principaux étant (i) d’étudier la distribution horizontale et verticale du micronecton en fonction des tourbillons méso-échelles, du plateau continental de Madagascar et de reliefs sous-marins (chapitre 3), (ii) de décrire les communautés présentes et les différentes stratégies de migration de certaines espèces (chapitre
4), (iii) de déterminer les modes alimentaires et le niveau trophique du micronecton dans le
réseau trophique pélagique (chapitre 5).
Dans le cadre de cette étude, les données satellites de chlorophylle de surface, d’anomalie de hauteur d’eau, de bathymétrie et de courant géostrophique ont été téléchargées des sites MODIS, COPERNICUS et de la NASA. Pendant les campagnes La Pérouse et MAD-Ridge, une CTD couplée à un profileur de courant- L-ADCP et d’un capteur de fluorescence, a été utilisée pour enregistrer des profils de courant, fluorescence, température, salinité et oxygène
Synthèse des travaux en français
dissous de la surface jusqu’à plus de 1000 m de profondeur. L’eau de mer a été prélevée en surface et à la profondeur du maximum de chlorophylle, puis filtrée à bord du bateau pour des analyses d’isotopes stables du carbone et de l’azote. Un échosondeur à quatre fréquences (38, 70, 120 et 200 kHz) a également été utilisé pour enregistrer la distribution spatiale et verticale du micronecton en continu pendant MAD-Ridge et de façon ponctuelle au cours de la campagne La Pérouse. Ces enregistrements ont été traités et analysés à terre avec le logiciel Matecho. Un chalut mésopélagique a été utilisé au cours des campagnes pour collecter le micronecton de jour comme de nuit et à différentes profondeurs. Les différentes communautés mésopélagiques ont été identifiées à bord du bateau et lors d’un atelier organisé à l’Université du Cap en Afrique du Sud avec des experts en taxonomie. A terre, les échantillons destinés aux analyses d’isotopes stables ont été lyophilisés, broyés, délipidés, décarbonatés (matière organique particulière-MOP- et zooplancton uniquement), encapsulés et analysés au spectromètre de masse au LEMAR à Brest. Les isotopes stables du carbone (δ13C) apportent des informations sur les sources de production primaire et le régime alimentaire alors que les isotopes stables de l’azote (δ15N) renseignent sur la position trophique de l’individu dans la chaine alimentaire.
Cette thèse se décline donc sur cinq chapitres principaux, suivis d’une discussion générale. Le
chapitre 1 fournit une description détaillée des interactions entre les processus physiques et
les monts sous-marins pouvant conduire à une réponse biologique des niveaux trophiques faibles et supérieurs. Des exemples sont donnés de monts sous-marins ayant fait l’objet de nombreuses études dans l’Atlantique et le Pacifique. Certains monts peuvent atteindre la zone euphotique, d’autres la zone intermédiaire et d’autres encore sont plus profonds, le sommet n’atteignant pas 400 m sous la surface de la mer. Les monts sous-marins peuvent également être de forme circulaire, conique, elliptique ou allongée et peuvent faire partie d’une ride, d’un groupe de monts ou être isolé. De part leurs tailles, formes et structures, les monts sous-marins ont des impacts très differents sur la circulation océanique. Diverses pertubations de la circulation océanique ont été decrites dans la littérature (White et al., 2007). En tant qu'obstacles topographiques, les monts sous-marins peuvent bifurquer, piéger, fendre ou détruire les tourbillons méso-échelles (Schouten et al., 2000; Herbette et al., 2003; Adduce & Cenedese, 2004; Sutyrin, 2006; Lavelle & Mohn, 2010). Sous certaines conditions, un relevé
Synthèse des travaux en français
d'énergies pour l'énergie des ondes internes et provoquer des perturbations dans les profondeurs de l'océan (White & Mohn, 2004). Les processus liés à la topographie peuvent générer un mélange au-dessus du fond et comprennent la réflexion des ondes internes et la génération de marées internes (Eriksen, 1998; Kunze & Llewelllyn Smith, 2004). Sous certaines conditions, des colonnes de Taylor peuvent également être formées au-dessus d’un mont sous-marin. Ces colonnes de Taylor sont des tourbillons anticycloniques qui s’élèvent en colonnes au-dessus du mont et sont formées à partir des interactions entre les courants et le relevé topographique. Ils agissent comme des “pièges” pour les organismes planctoniques qui s’y agrègent en abondance. Si la productivité se trouve piégée sur le mont, cela peut attirer les consommateurs secondaires et tertiaires telles que les zooplanctons, les micronectons et éventuellement les prédateurs supérieurs.
Le chapitre 2 dresse un aperçu des écosystèmes pélagiques du sud-ouest de l’océan Indien. Cette zone est délimitée à l’ouest par la côte africaine et l’île de Madagascar qui est positionnée en travers du courant sud-équatorial (South Equatorial Current), jouant ainsi un rôle crucial dans la circulation régionale en provoquant une bifurcation du courant en deux branches (nord et sud) sur sa côte orientale et la formation de tourbillons méso-échelles dans le canal du Mozambique et au sud de L’île. Le sud-ouest de l’océan Indien est également caracterisé par deux provinces biogéochimiques définies dans Longhurst (1998, 2007) comme étant l’ISSG et l’EAFR (Province côtière de l'Afrique de l'Est). La circulation anticyclonique à grande échelle qui prévaut dans l'ISSG entraîne un downwelling physique, qui limite l'apport de nutriments dans les couches de surface (Jena et al., 2013). D’autre part, les tourbillons méso-échelles qui dominent l’EAFR crés des conditions favorables à la prolifération de phytoplancton. Ces tourbillons méso-échelles sont d’une importance capitale pour les prédateurs supérieurs tels que les thons, espadons et oiseaux marins, qui utilisent ces structures comme zones d’alimentation. Les reliefs sous-marins du sud-ouest de l’océan Indien semblent aussi jouer un rôle important comme zones d’alimentation pour ces prédateurs supérieurs (Pinet et al., 2012). Les monts sous-marins du sud-ouest du l’océan Indien sont parmi les moins explorés au monde (Bhattacharya & Chaubey, 2001), avec seuls 15 monts de l’océan Indien ayant fait l’objet d’études biologiques (Sautya et al., 2011). Cette étude contribue donc à améliorer nos connaissances des processus physico-chimique entrainant une réponse biologique à deux monts sous-marins du sud-ouest de l’océan Indien.
Synthèse des travaux en français
Le chapitre 3 de cette thèse se focalise sur l’influence des tourbillons méso-échelles, du plateau continental de Madagascar et des monts sous-marins peu profonds sur la distribution verticale et spatiale du micronecton avec une approche acoustique. Pendant la campagne MAD-Ridge, un dipôle (paire de tourbillons contra-rotatifs) était présent dans les environs de MAD-Ridge avec la composante anticyclonique stationnée sur le mont pendant toute la campagne et la composante cyclonique situé à l’ouest du mont. Le cyclone a causé une remontée de la thermocline et des eaux plus denses, ainsi qu’un enrichissement biologique caractérisé par des concentrations en chlorophylle plus élevées comparé à l’anticyclone. Les densités du micronecton étaient faibles dans l’anticylone et sur le sommet et les flancs du mont MAD-Ridge par rapport aux densités mesurées dans le tourbillon cyclonique et sur le plateau continental de Madagascar. Le micronecton a suivi le schéma habituel de migration nycthémérale, montant verticalement à la surface au crépuscule et descendant vers les couches plus profondes (moins de 400 m) à l'aube, sauf dans le tourbillon cyclonique pendant MAD-Ridge où des densités acoustiques plus importantes ont été enregistrées dans la couche de surface diurne. Ces densités acoustiques au sein du cyclone dans la couche de surface de jour, ont démontré une forte réponse au 38 kHz comparé au 70 et 120 kHz. Des études antérieures ont démontré que les poissons épi- et mésopélagiques ayant de petites vessies natatoires remplies de gaz et le plancton gélatineux ayant des inclusions de gaz, dominent la fréquence de 38 kHz (Porteiro & Sutton, 2007; Kloser et al., 2002; Kloser et al., 2009; Davison et al., 2015; Cascão et al., 2017; Proud et al., 2018). Les organismes se situant dans la couche de surface au sein du cyclone de jour étaient peut-être des poissons épi- et mésopélagiques remplis de gaz qui nageaient et se nourrissaient activement dans le cyclone, ou des organismes gélatineux avec des inclusions de gaz. Comme démontré dans ce chapitre, il y a peu de probabilité d’un enrichissement local causé par des interactions courants-topographie comme la formation de colonnes de Taylor ou la remontée des isocèles aux monts La Pérouse et MAD-Ridge. Les processus d’enrichissement rencontrés pendant la campagne MAD-Ridge, à savoir une forte productivité primaire et une densité élevée du micronecton, sont principalement liés aux upwellings au sud de Madagascar et à la dynamique des tourbillons méso-échelles, et probablement aussi à l’activité d’ondes internes.
Synthèse des travaux en français
micronectoniques qui occupent un habitat profond de jour. Généralement, les tourbillons cycloniques concentrent une forte densité de production primaire dans la couche euphotique, retenant ainsi le zooplancton et, à terme, les poissons mésopélagiques. Les densités acoustiques du micronecton étaient également plus élevées au mont MAD-Ridge comparé à La Pérouse. La dynamique des structures méso-échelles telles que les tourbillons cycloniques et anti-cycloniques au sud de Madagascar, augmente la production primaire et concentre une forte biomasse, abondance et densité acoustique du micronecton dans cette zone qui se démarque ainsi de la région oligotrophe du gyre ISSG au sein duquel se situe La Pérouse. Par mes travaux, j’ai mis en évidence que la distribution spatiale du micronecton dans le sud-ouest de l’océan Indien serait donc influencée par des processus physico-chimiques.
Le chapitre 4 a pour but de déterminer la distribution verticale et les assemblages du micronecton aux monts La Pérouse et MAD-Ridge. La migration nycthémérale du micronecton est importante pour le transfert de nutriments et d’éléments essentiels de la surface vers les profondeurs. J’ai démontré que certaines espèces du micronecton sont capables d’effectuer de grandes migrations nycthémérales vers la surface (couche 0-200 m) au crépuscule et vers les profondeurs (>400 m) à l’aube. A l’aube, on observe plusieurs vagues de migration de la couche intermédiaire (200-400 m) vers les profondeurs (>400 m) et de la couche de surface vers les profondeurs. Il y a donc plusieurs stratégies de migration. Certaines espèces de la communauté mésopélagique migrent en-dessous de 800 m (probablement afin d’échapper aux prédateurs visuels) alors que d’autres espèces sont non-migrantes et se situent principalement dans la couche de surface (comme certains gélatineux) ou en profondeur telles que les
Cyclothone sp., de jour comme de nuit.
Les données acoustiques analysées au cours de ma thèse ont également mis en évidence que la couche de surface (0-200 m) est constituée d’espèces de micronecton communes à divers bassins océaniques. Par contre, certaines espèces de poissons mésopélagiques, telle que les
Diaphus suborbitalis, s’associent uniquement aux sommets et flancs des monts sous-marins La
Pérouse et MAD-Ridge de jour comme de nuit. Il a déjà été constaté que de grandes populations de D. suborbitalis étaient associées au mont sous-marin de l'Équateur dans l’océan Indien (Parin & Prut’ko, 1985). Ces poissons se trouveraient sur les pentes à 500-600 m de profondeur
Synthèse des travaux en français
pendant la journée et remonteraient en bancs denses et compacts jusqu'à 80 à 150 m de profondeur la nuit pour se nourrir principalement de copépodes (Gorelova & Prut’ko, 1985), tout en étant la proie de plusieurs prédateurs supérieurs tels que les thons et espadons (Parin & Prut’ko, 1985). Ces espèces forment des bancs compacts sur les monts sous-marins afin de bénéficier probablement des avantages que confèrent ces espaces, tels que l’augmentation de proies, la diversité qu’offrent ces types d’habitats et des sites de repos. Cependant, force est de constater que des estimations plus faibles en abondance et biomasse du micronecton ont été enregistrées sur les sommets de La Pérouse et de MAD-Ridge comparé aux alentours immédiats de ces monts. L'obstruction physique créée par un mont sous-marin est supposée réduire la densité des animaux sur les flancs et les sommets, en particulier la nuit (eg. Genin et al., 1988; Diekmann et al., 2006; De Forest & Drazen, 2009).
Par le biais d’analyses d’isotopes stables du δ13C et δ15N, le chapitre 5 met en évidence les interactions trophiques du micronecton par rapport à la MOP et au zooplancton aux monts La Pérouse et MAD-Ridge. La MOP de surface a enregistré des valeurs en δ13C supérieures à MAD-Ridge comparé à La Pérouse. La MOP se constitue généralement de phytoplancton, bactéries, matières fécales et détritus (Riley, 1971; Saino & Hattori, 1987; Fabiano et al., 1993; Dong et al., 2010; Liénart et al., 2017). Les concentrations en chlorophylle de surface étaient plus élevées à MAD-Ridge comparé à La Pérouse (Annasawmy et al., 2019). Les apports nutritifs à MAD-Ridge sont plus élevés qu’à La Pérouse de part l’action des remontées d’eau sur le plateau continental Malgache, entrainant ainsi un enrichissement en phytoplancton (Ramanantsoa et al., 2018), par l'advection au large de cette productivité côtière et/ou du plateau continental par le transport transversal (Noyon et al., 2018), et par un enrichissement au sein des tourbillons méso-échelles qui se déplacent sur le mont MAD-Ridge (De Ruijter et al., 2004; Vianello et al., 2020). La Pérouse, se situant loin des influences marquées par les remontées d’eau et loin des tourbillons à forte puissance, bénéficie moins des apports nutritifs, provoquant ainsi des valeurs en δ13C moins élevées de la MOP.
Le chapitre 5 décrit egalement que la MOP et le zooplancton ont des valeurs isotopiques inférieures aux crustacés, céphalopodes et poissons mésopélagiques à La Pérouse et à
MAD-Synthèse des travaux en français
zooplancton et de matières végétales) et carnivores (poissons mésopélagiques et céphalopodes qui se nourrissent essentiellement de copépodes, d’amphipodes, d’euphausiacés et d’ostracodes) sont fortement enrichis en δ15N comparé aux filtreurs (salpes et pyrosomes) et
détritivores (larves leptocéphales). Les filtreurs et détritivores ont généralement un niveau trophique de 2. Les crustacés, poissons mésopélagiques et petits céphalopodes se situe généralement à un niveau trophique entre 3 et 4, au-dessus du zooplancton et en-dessous des prédateurs supérieurs tels que les thons et les espadons. La taille d’un individu a généralement une influence sur ces valeurs de δ15N en raison de la relation taille-proie (un individu plus grand
ingérera une proportion plus importante de proies de grande taille ayant un δ15N plus élevé que des proies de taille inférieure). Cette relation a été observée pour plusieurs espèces de micronecton. Cependant, il a été observé que les poissons mésopélagiques et benthopélagiques associés de façon quasi-permanente sur les sommets et les flancs de La Pérouse et de MAD-Ridge, ont le même niveau trophique quelles que soient leurs tailles. Ceci peut s’expliquer par le fait que ces espèces se nourrissent de proies similaires, ou bien de proies différentes mais ayant le même niveau trophique.
Le micronecton est donc un maillon important dans la chaine alimentaire de par la prédation qu’il exerce sur le zooplancton et comme source d’alimentation pour les prédateurs supérieurs tels que les thons et les espadons. Les différents processus contrôlant la distribution spatiale et verticale du micronecton méritent d’être détaillés car les prédateurs supérieurs marins dépendent de ce groupe, et indirectement les populations humaines par la pêche et ses autres activités économiques associées. Il est donc important de mieux comprendre le fonctionnement des écosystèmes marins associés aux monts sous-marins notamment le rôle des processus physiques qui influencent les différents maillons trophiques, afin de proposer des mesures adaptées à la conservation de ces espaces et à une exploitation raisonnée et durable de leurs ressources marines.
Cette étude a démontré le fonctionnement de l'écosystème de deux relevés topographiques peu étudiés du sud-ouest de l’océan Indien. Lorsqu'on replace les monts La Pérouse et MAD-Ridge dans un contexte régional, les densités acoustiques totales du micronecton au mont La Pérouse sont typiques de celles de la province de l'ISSG, tandis que les réponses acoustiques au mont MAD-Ridge sont typiques de celles de la province de l'EAFR. Les densités acoustiques en
Synthèse des travaux en français
micronectons étaient plus élevées dans l’EAFR et au mont sous-marin MAD-Ridge comparé à la province de l'ISSG et le mont sous-marin La Pérouse, probablement en raison de l'effet des tourbillons méso-échelle et de la productivité accrue dans l’EAFR. Aucune augmentation nette du micronecton n'a été observée aux monts sous-marins par rapport à l'océan environnant dans les provinces biogéochimiques. Cependant, des agréggations denses ont été observées collées aux sommets des deux monts pendant la journée, probablement en raison de la présence de poissons s'agrégeant de façon quasi-permanente sur les sommets et les flancs de ces monts.
Bien que les relevés topographiques soient omniprésents dans les océans du monde, les monts sous-marins et leurs écosystèmes sont encore mal connus. Seuls 0,4 à 4 % de la population mondiale des monts sous-marins ont été directement échantillonnés pour la recherche scientifique (Kvile et al., 2014). Le partage et l'accessibilité des données constituent autant d’obstacles importants à la recherche sur les monts sous-marins. La présente étude vient donc enrichir les connaissances actuelles sur le fonctionnement de l'écosystème des monts sous-marins. Un résultat important de cette étude est la présence d'agréggations denses sur les sommets et les flancs de La Pérouse et de MAD-Ridge de jour comme de nuit. Ce résultat est similaire à celui d'autres études précédentes, dans lesquelles des poissons ont été trouvés en association étroite avec des monts sous-marins dans plus de 150 cas (Kvile et al., 2014). Malgré leurs topographies complexes et leurs processus physiques locaux, il a été démontré que les monts sous-marins confèrent des avantages sélectifs au regroupement des poissons qui utilisent ces caractéristiques pour s'alimenter, se reproduire ou se reposer (Porteiro & Sutton, 2007). L'intégration des observations de cette étude dans des bases de données mondiales telles que le SEEF (Seamount Ecosystem Evaluation Framework) (Kvile et al., 2014) peut aider à identifier les lacunes dans nos connaissances, à caractériser les particularités de chaque mont sous-marin et à tester davantage les effets potentiels des monts sous-marins afin de comprendre quels sont les facteurs qui déterminent la dynamique des différents types de monts. Il est important de mieux comprendre les ecosystèmes associés à différents monts sous-marins afin de pouvoir proposer des mesures de gestion appropriées quant aux ressources associées.
Glossary of principal abbreviations
Glossary of principal abbreviations
Regions, provinces and zones
AAIW Antarctic Intermediate Water
ADT Absolute Dynamic Topography
BPA Benthic Protected Area
CTD Conductivity Temperature Depth (rosette system)
DCM Deep Chlorophyll Maximum
DSL Deep scattering layer
DVM Diel Vertical Migration
EAFR East African Coastal Province
EBSA Ecologically and Biologically Significant Area
EEZ Exclusive Economic Zone
EMC East Madagascar Current
Fmax depth Depth of the maximum Fluorescence
IOTC Indian Ocean Tuna Commission
ISSG Indian South Subtropical Gyre
IYGPT International Young Gadoid Pelagic Trawl
L-ADCP Lowered Acoustic Doppler Current Profiler
MPA Marine Protected Area
MSLA Mean Sea Level Anomalies
NADW North Atlantic Deep Water
NEMC North East Madagascar Current
Nmi Nautical mile
POC Particulate Organic Carbon
POM Particulate Organic Matter
RFMO Regional Fisheries Management Organization
RGB Red Green Blue (composite images generated from
acoustic data)
Glossary of principal abbreviations
sA, NASC Nautical Area Scattering Coefficient
SEC South Equatorial Current
SEMC South East Madagascar Current
SIODFA Southern Indian Ocean Deepsea Fishers Association
SIOFA Southern Indian Ocean Fisheries Agreement
SSC Sea surface chlorophyll
SSL Shallow scattering layer
sv Volume backscattering coefficient
Sv Volume backscattering strength
SWIO South West Indian Ocean
SWIOFC Southwest Indian Ocean Fisheries Commission
SWIR Southwest Indian Ridge
TL Trophic Level
TSG Thermosalinograph
uCDW upper Circumpolar Deep Water
Chapter 1: General Introduction
Chapter 1: General Introduction
1.1 Background
1.1.1 Seamount geology and characteristics
Seamounts are ubiquitous features of the world’s oceans. Depending on their definition, there are an estimated 200 000 seamounts (Kitchingman & Lai, 2004; Wessel, 2007; Clark et al., 2010b) (Fig. 1.1). Seamounts have an elevation >1000 m (IHO, 2008) whereas knolls have an elevation that ranges between 500-1000m. Approximately 30 000-60 000 seamounts and 138 000 knolls have been identified (Hillier & Watts, 2007; Costello et al., 2010; Yesson et al., 2011). An estimated 24 000 to 100 000 large seamounts remain uncharted (Hillier & Watts, 2007; Wessel et al., 2010). Seamounts may also occur as chains perpendicular to a ridge, as isolated topographic features or in clusters (Kitchingman & Lai, 2004; Etnoyer et al., 2010). Most seamounts are the result of intense oceanic volcanism (Craig & Sandwell, 1988; Wessel, 2001; Yesson et al., 2011) and are associated with intraplate hotspots, mid-ocean ridges or island arcs (Wessel, 2007; Yesson et al., 2011).
Figure 1.1 Estimated global distribution of large seamounts with an elevation >1500 m (yellow diamond symbols) based on data described in Kitchingman & Lai, 2004 (Source: Clark, 2009).
The majority of seamounts are composed of basalt (Wessel, 2007). Approximately 50 million tons of basalt per year are estimated to be required to produce seamounts (Iyer et al., 2012), alongside several other factors deemed necessary to control the birth and development of such features (Craig & Sandwell, 1988). An adequate supply of magma with sufficient hydraulic head and latent heat is deemed essential to penetrate the oceanic lithosphere without freezing during ascent. For a volcano to develop, the lithosphere must remain over the heat source or
Chapter 1: General Introduction
magma pool for a sufficient amount of time (Craig & Sandwell, 1988). In the early stages of formation, seamounts on the deep seafloor may exhibit strong axial symmetry. The seamount may ultimately grow if additional magma is available and if the seafloor is mechanically strong (Wessel, 2007). Seamounts can be observed using satellite altimetry (Wessel, 2001; Kitchingman & Lai, 2004).
1.1.2 Physical processes resulting from current-topography interactions
As topographic obstacles rising from abyssal depths, interactions are expected with the local physical flow regime causing increased hydrodynamic activities in the vicinity of the seamount, relative to the flat abyssal ocean (White et al., 2007; Mohn et al., 2009). These pinnacles may also disrupt large scale oceanic flow (Royer, 1978). Seamounts may be circular, elongated, conical or elliptical in shape and may be shallow, intermediate (summit below the euphotic zone but within the upper 400 m) and deep (summit below 400 m) (White & Mohn, 2004). There is also an ecological definition associated to seamounts with shallow seamounts penetrating the euphotic zone (Yesson et al., 2011), middle-depth seamounts reaching the base of the euphotic zone from 1500 m depth while deeper seamounts are found below the zone of influence of the deep-scattering layer (Pitcher et al., 2007). The particular combination of seamounts’ shapes, sizes and summit depths ultimately determines the physical flow processes. A variety of flow disturbances have been described (White et al., 2007; Fig. 1.2) and a number of flow-topography interactions have been observed at pinnacles of the Atlantic and Pacific Oceans (Appendix: Table A).
Chapter 1: General Introduction
Figure 1.2 Characteristic features of motion at an isolated southern hemisphere seamount. These features, including a vertical circulation cell, isopycnal doming and anticyclonic-horizontal circulation, are shown near the summit depth, superimposed on oscillatory currents and oscillatory temperature and salinity distributions. The occurrence, properties and variability of these features depend on local turbulence K, internal waves !"# (propagating horizontally and vertically), and on incident mean current !$%&', eddies ($%&', tidal and other oscillations Uvar, and possibly wind-driven currents Uwind (Source: adapted from Lavelle
& Mohn, 2010).
1.1.2.1 Eddy-topography interactions
Mesoscale eddies, that range in diameter from 10 to 300 km, are typically produced as a result of wind stress circulation patterns (Falkowski et al., 1991; Mann & Lazier, 2006). These eddies are circulating water masses and are either cyclonic (clockwise rotation in the southern hemisphere) or anticyclonic (anticlockwise rotation in the southern hemisphere) (Bakun, 1996). The cyclonic rotation may lead to a doming and localized upwelling of cold, deep, nutrient-rich waters into the euphotic zone (Falkowski et al., 1991) whereas anticyclonic rotation may lead to a depression of isotherms and downwelling of nutrient-rich waters. As topographic obstacles, seamounts may either bifurcate, trap, split or destroy eddies (Schouten et al., 2000; Herbette et al., 2003; Adduce & Cenedese, 2004; Sutyrin, 2006; Lavelle & Mohn, 2010). Outcomes of eddy-seamount interactions largely depend on the seamount’s dimensions (width, height and orientation) (van Geffen & Davies, 1999) and current speeds. Eddies with diameters up to ~37 km have been reported to be formed from the North Pacific
Chapter 1: General Introduction
current and seamount interactions north of Hawaii (Royer, 1978). Some seamounts such as the Emperor Seamount Chain in the Pacific Ocean may act as generators of quasi-stationary mesoscale eddies (Bograd et al., 1997). Haida eddies from the northeast Pacific have been shown to be associated with Bowie seamount, with the Haida-2000a eddy being trapped on the seamount for a period of 3 months (Dower et al., 2004). Numerical models have also shown that an eddy may cross a ridge or be rebounded by the topography, preventing the eddy from crossing the ridge on its first encounter (van Geffen & Davies, 2000b).
The propagation of Meddies (Mediterranean Water eddies), formed from the Mediterranean outflow near the continental slope of Portugal, may also have weak, moderate or strong interactions with seamounts of the Atlantic Ocean (Bashmachnikov et al., 2009). Weak interactions can lead to deflection of Meddies after the latter have rotated some distance around large seamounts (van Geffen & Davies, 2000a). The deflection of a Meddy was observed by the Gorringe Bank aka. Gorringe Ridge (Bower et al., 1995) in the Atlantic. At Seine seamount in the subtropical northeast Atlantic, portion of a Meddy was seen to escape the seamount after having performed several rotations around the summit (Baschmachnikov et al., 2009). Strong interactions of Meddies with seamounts can lead to vortex trapping or splitting (Baschmachnikov et al., 2009). Meddies were partially split after collision with Hyères and Irving seamounts (Shapiro et al., 1995) and destroyed by Sedlo (Bashmachnikov et al., 2009), Hyères (Richardson et al., 1989; 2000), Josephine (Schultz Tokos et al., 1994; Richardson et al., 2000), Lion seamounts and pinnacles in the Horseshoe chain in the Atlantic Ocean (Richardson et al., 2000). A Meddy was further cleaved into two approximate equally sized smaller Meddies by Cruiser and Irving seamounts (Richardson et al., 2000).
1.1.2.2 Local processes at seamounts- Isopycnal doming
Localised processes are also observed at seamounts, such as isopycnal doming (Owens & Hogg, 1980), formation of enclosed circulation cells (Freeland, 1994), amplification and rectification of tidal motions (Brink, 1995), and increased vertical mixing (Kunze & Sanford, 1996; Eriksen, 1998). Isopycnal doming, i.e. upwelling on the upstream side of a topographic feature and doming of density surfaces, is due to ocean currents impinging on a seamount (Martin & Christiansen, 2009) or due to the rectification by trapped waves for sub-inertial frequencies (Mohn & Beckmann, 2002). The doming of isotherms is generated when the fluid is forced to rise over the pinnacle due to the associated geostropically induced anticyclonic
Chapter 1: General Introduction
structure in the temperature, salinity and density fields (Torres et al., 2004) and can result from Taylor cone formations (White et al., 2007).
1.1.2.3 Local processes at seamounts- Taylor columns
Trapped, enclosed circulations over topographic obstacles are known as Taylor columns (or cones) and have been reported to occur over some seamounts of the Atlantic and Pacific oceans (Appendix: Table A). The Taylor-Proudman Theorem showed that when a steady and homogeneous flow encounters a seamount, an anticyclonic circulation following the isobaths is generated with any fluid being trapped in a stagnant area above the topographic obstacle, thus creating a Taylor column (Huppert, 1975; Huppert & Bryan, 1976; White & Mohn 2004; Fig. 1.3). Flow transitioning to equilibrium will cause two counter rotating vortices to form over idealized Gaussian-shaped seamounts, with stronger impinging flows causing the cyclonic vortex to be shed downstream (White et al., 2007) while the anticyclonic vortex remains over the seamount (Huppert & Brian, 1976; Lavelle & Mohn, 2010).
Figure 1.3 Characteristic features of motion at an isolated seamount, including flow patterns, and features such as Taylor columns, isopycnal doming and processes such as enhanced vertical mixing [Source: adapted from Henry et al., 2012].
Factors such as seamount’s shape, size, depth (of the summit), turbulence, stratification, current speed and direction, may influence the development of a Taylor Column. In those instances where the water column is stratified, the Taylor column does not extend to the sea surface and is hence known as a “Taylor cap” (González-Pola et al., 2012). If the current velocity is too high, a Taylor cap will not persist over the seamount (Lavelle & Mohn, 2010). A set of non-dimensional parameters such as the Rossby number (Ro: a measure for the relative importance of advective and rotational effects), the Burger number (a measure for the strength of stratification) and the fractional height of the seamount (α), may be used as criteria for the formation of localised induced circulation around a seamount (Turnewitsch et al., 2004; White
Chapter 1: General Introduction
et al., 2007; Fig. 1.4). Taylor caps may form over idealized Gaussian-shaped seamounts for specific combinations of Ro and α (Chapman & Haidvogel, 1992) and as such, Taylor columns will only form transiently.
Figure 1.4 Diagram of the main factors controlling the localised dynamic processes at isolated topographic features, with Ut representing the tidal flow; U, the mean flow; ρ the water density
with depth; L the seamount width in m; h0 is the height of the seamount relative to the water
depth H; N, the vertical stratification, Ω, the Earth’s angular velocity, and f, the Coriolis parameter [White et al., 2007].
1.1.2.4 Local processes at seamounts- Tidal amplification and rectification
Closed anticyclonic circulation cells around seamounts may also arise through tidal rectification, i.e. the generation of residual mean currents over the seamount by tidal flow (Mohn, 2002; White et al., 2007). A variety of processes such as seamount-trapped waves, tidal rectification and amplification, generation of internal tides and locally enhanced turbulent mixing, may arise through the interaction of tides with isolated seamounts (Mohn & White, 2010). Tidal amplification over seamounts is due to the squeezing of flow as it passes over the topographic feature and formation of wave motions which are trapped at the bottom of the seamount (Brink, 1989) and rotate in an anticyclonic direction about the seamount (Beckmann et al., 2001). Periodic tidal forcing is a dominant phenomenon at the Great Meteor seamount
![Figure 2.14 Benthic litter densities (items ha -1 ) and composition, observed by remotely operated vehicle video systems, for seamounts of the SWIR [Source: adapted from Woodall et al., 2015]](https://thumb-eu.123doks.com/thumbv2/123doknet/13611572.424815/82.892.134.760.106.524/benthic-densities-composition-observed-remotely-operated-seamounts-woodall.webp)