HAL Id: hal-00409263
https://hal.archives-ouvertes.fr/hal-00409263
Submitted on 30 Jun 2019
HAL is a multi-disciplinary open access archive for the deposit and dissemination of sci-entific research documents, whether they are pub-lished or not. The documents may come from teaching and research institutions in France or abroad, or from public or private research centers.
L’archive ouverte pluridisciplinaire HAL, est destinée au dépôt et à la diffusion de documents scientifiques de niveau recherche, publiés ou non, émanant des établissements d’enseignement et de recherche français ou étrangers, des laboratoires publics ou privés.
Multicolor Emission of Small Molecule-Based
Amorphous Thin Films and Nanoparticles with a Single
Excitation Wavelength
Eléna Ishow, Arnaud Brosseau, Gilles Clavier, Keitaro Nakatani, Patrick
Tauc, Céline Fiorini-Debuisschert, Sophie Neveu, Olivier Sandre, Léaustic
Anne
To cite this version:
Eléna Ishow, Arnaud Brosseau, Gilles Clavier, Keitaro Nakatani, Patrick Tauc, et al.. Multicolor Emission of Small Molecule-Based Amorphous Thin Films and Nanoparticles with a Single Excita-tion Wavelength. Chemistry of Materials, American Chemical Society, 2008, 20 (21), pp.6597-6599. �10.1021/cm802264c�. �hal-00409263�
Fluorescent Amorphous Organic Nanoparticles for Two-Photon Bioimaging
Eléna Ishow,* Arnaud Brosseau, Gilles Clavier, Keitaro Nakatani, Patrick Tauc,† Julie Lagirand- Cantaloube,† Céline Fiorini-Debuisschert,‡ Anne Léaustic,§ Olivier Sandre** and Sophie Neveu**
ENS Cachan, PPSM-UMR CNRS 8531, 61 avenue du Président Wilson, 94235 Cachan Cedex, France
RECEIVED DATE (automatically inserted by publisher); E-mail: ishow@ppsm.ens-cachan.fr
†
LPBA-UMR CNRS 8113, ENS Cachan, France ‡
CEA-Saclay, DSM-DRECAM-SPCSI, Gif-sur-Yvette, France §
LCI-UMR CNRS 8613, ICMMO, Université Paris Sud 11, Orsay **
LI2C-UMR CNRS 7612, Université Pierre et Marie Curie, France
Fluorescent organic nanoparticles (FON) made of small molecules recently arouse considerable interest in biomedical imaging and opto-electronics as potential microlasers or emitting displays.1,2 Their collective emission largely enhanced with respect to dilute media and their reduced sensitivity to external bleaching and quenching effects make them very attractive when powerful excitation is required as in multiphoton fluorescence spectroscopy. Fluorescence in the solid state is however facing two deleterious effects: competitive non-radiative quenching processes caused by strong intermolecular aggregation, and emission reabsorption owing to the inherent high chromophore density. The main strategies consist in introducing bulky substituents to prevent the formation of non-emissive π−π stacked assemblies as well as elaborating materials with a large optical Stokes shift.3 Hydrophobic materials are often obtained and
considered of little use in bioimaging. We want to report herein the synthesis and the properties of a new family of push-pull amorphous compounds which form strong one- and two-photon emitting nanoparticles that can efficiently be utilized to image lipophilic cell membranes despite their water insolubility.
The present series of fluorescent compounds 1-5 consists in polar triphenylamino derivatives substituted by bulky tert-butylphenyl groups following a Suzuki aromatic cross coupling reaction as a final step (Scheme 1).4 Both the twisted star-shaped triphenylamino- core and peripheral hindered substituents prevent deleterious π−π stacking and ensure high solubility in polar and apolar organic solvents.
Scheme 1. Synthesis scheme of compounds 1-5.
Compounds 1-5 only exist as amorphous solids. They can be processed as transparent thin films with a very high optical quality by spin-coating or vaccum evaporation under a pressure of 2x10⁻⁵ mbar, or as nanoparticles by the precipitation method. Addition of filtered deionized water under vigorous stirring into a 0.2 g.L-1 acetonitrile solution of compounds yields remarkably spherical spheres as evidenced by TEM measurements. Agglomeration or sedimentation was not observed after weeks of storage in aqueous
solution at room temperature. The nanoparticle diameters were evaluated to be 100-200 nm in agreement with analyses by dynamic light scattering. X-ray diffraction measurements carried on nanoparticles and thin films showed no diffraction patterns. Moreover thermal characterizations in the 25-300°C temperature range present no melting peak but clear glass transitions around 90°C, asserting an amorphous state for all compounds.5
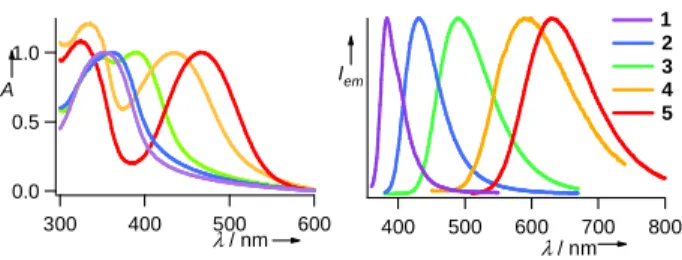
Compared to those in solution, the absorption spectra of thin films and nanoparticles of 1-5 are slightly red-shifted due to local increase in polarity. They present neither additional band nor significant broadening, proving the lack of strong π−π stacking in the ground state. The UV-vis absorption spectra exhibit a 330 nm-centered band which shows little sensitivity to the electron-accepting group, and was ascribed to an aminobiphenyl-centered
π−π* transition as confirmed by TDDFT calculations (B3LYP basis/ 6-31G(d) – Supporting information) (Figure 1).
1.0 0.5 0.0 A 600 500 400 300 λ / nm Iem 800 700 600 500 400 λ / nm 1 2 3 4 5
Figure 1. Normalized UV-vis absorption (left) and emission spectra (right) of nanoparticles 1-5 dispersed in water.
A distinct additional band assigned to an intramolecular charge transfer (ICT) excited state appears for compounds 3-5. The ICT band undergoes a dramatic bathochromic shift from 320 to 459 nm according to the strength of the electron-attracting groups. TDDFT calculations revealed that this latter band stems from a charge transfer from the HOMO to the LUMO (highest occupied and lowest unoccupied molecular orbitals) located on the triphenylamino and electron-withdrawing groups respectively.
Unlike the ground state whose absorption hardly varies with the investigated media, the properties of the emissive excited state considerably depend on the solvent polarity and the matrix identity. All compounds are fluorescent in the solid state (thin film, powder, nanoparticles) with the emission band peaking from 432 to 632 nm for 1 to 5 (Figure 1). Excitation in the aminobiphenyl-centered or charge-transfer bands leads invariably to the same lowest emissive state with emission quantum yields φF Br N Br EWG B(OH)2 N EWG + 1 2 5 3 4 -H -CN -CHO -NO2 CN CN [Pd] EWG:
in toluene varying from 0.79 to 0.12 when going from 1 to 5. Accordingly the emission Stokes shift increases from 600 cm-1 (∆λ=53 nm) for 1 up to 5240 cm-1 (∆λ=140 nm) for 5.
Remarkably, except for 1, almost no decrease of φF is encountered
in thin films compared to toluene solution, which emphasizes the lack of strong intermolecular quenching and reabsorption effect.
This dramatic Stokes shift and the antenna effect exerted by the biphenyl units give straight access to multicolor emission from a mixture of 1-5 particles by using a single excitation wavelength in the UV or IR range (see infra), which is of highest interest for signal multiplexing in biological imaging (Figure 2).6
Figure 2. a) TEM image of nanoparticles 5 stained with RuO4. b) Fluorescence microscope imaging of 2-5 nanoparticles deposited on glass slit (λexc = 343 nm). c) Absorption and d) emission of nanoparticles dispersed in water (λexc = 343 nm).
Lifetime measurements performed in spectroscopic grade toluene solution show monoexponential decay in the nanosecond range for all compounds but 3. The longer singlet excited lifetime
τS for compounds 3-5 compared to those of 1-2 rely on strongly
distorted emissive excited states whose relaxation to the ground state is partly prohibited. Indeed, calculations of the radiative (kf)
and non-radiative (knr) rate constants from φF and τS show that kf
is one order of magnitude less for compounds 3-5 (9.0×10⁷, 4.2×10⁷ and 4.8×10⁷ s-1) compared to 1-2 (5.8×10⁸ and 2.1×10⁸ s
-1
) while knr remains in the same range of order (1.6−4.1×10⁸ s-1).
Star-burst symmetric triphenylamine derivatives and compounds exhibiting strong ICT are broadly used for biphotonic applications.7 Therefore we inquired into the two-photon
absorption (TPA) cross-sections of compounds 1-5 since they combine both properties. TPA measurements were carried out on solutions and isoabsorbing nanoparticles dispersed in water by recording the two-photon excited fluorescence after near-infrared excitation and comparison with fluoresceine as a reference standard. Despite their short π-conjugated system, compounds 4-5 in cyclohexane or toluene solution show significant TPA cross-sections σTPA up to 95 GM (1 GM = 10-50 cm4.s.photon -1.molecules-1) at 820 nm. Therefore, dipolar contribution clearly
plays a predominant role to the nonlinear absorption properties of
4-5.8 These cross-sections values dramatically increase by 5 to 30 times upon aggregation as dispersed nanoparticles 1-5 (Figure 3). This enhancement can reasonably be assigned to exciton coupling in the solid state permitted by the fairly high molar absorption coefficients.2c,9 This striking result proves that fluorescent organic nanoparticles appear extremely attractive to generate efficient two-photon absorbing systems with little synthetic efforts compared to systems with a high TPA chromophore density such as dendrimers.10 300 200 100 0 σTPA/ GM 840 820 800 780 760 740 λ/ nm 1 2 3 4 5
Figure 3. TPA cross sections for nanoparticles 1-5 dispersed in water. Fluoresceine in 0.01 M NaOH as TPA reference.
Finally, the applicability of these nanoparticles as biological probes under two-photon excitation was investigated. NIH-3T3 murine fibroblasts fixed with methanol at -20 °C were incubated in PBS solution at 37°C for 20 min with compound 5 which appeared to be the best candidate in terms of emission response and uptake by the cells. One and two-photon fluorescence imaging was done by using a laser scanning confocal microscope working at 820 nm and collecting the fluorescence in the 550-680 nm region. The images showed clear localization of the nanoparticles into the lipophilic cell membrane with no accumulation in the cytoplasm or the nucleus as pointed out by the Z-scan profile (Figure 4).
Figure 4. Laser scanning confocal microscopy images of fixed NIH-3T3 murine cells after uptake of nanoparticles 5. a) Phase–contrast picture. b) One-photon fluorescence imaging (λexc = 458 nm; λem = 550-680 nm). c) Z-scan profile of image b). d) Two-photon fluorescence imaging (λexc = 820 nm; λem = 550-680 nm).
In summary, we have developed a new series of fluorescent amorphous compounds forming stable spherical nanoparticles which a) strongly fluoresce in water, ii) yield multicolor emission from blue to red by using one single UV excitation wavelength, iii) exhibit significant TPA cross-section largely enhanced compared to solution. For the first time to our knowledge, we have demonstrated that small molecule-based organic nanoparticles can be efficiently used for two-photon bioimaging. These studies open up a novel appealing alternative to numerous organic and inorganic materials thanks to the synthetic simplicity and expected lower cytotoxicity of the present nanoparticles. Their use as emitting polarity probes of biological media as well as systematic correlations between the particle size and their optical properties are under progress.
Acknowledgment. C. Andraud and O. Maury (ENS Lyon,
France) are gratefully thanked for integrating sphere fluorescence measurements.
Supporting Information Available: Synthesis, photophysical
properties, two-photon measurements and imaging, nanoparticle characterizations, cell culture. This material is available free of charge via the Internet at http://pubs.acs.org.
REFERENCES
(1) (a) Kasai, H.; Kamatani, H.; Okada, S.; Oikawa, H.; Matsuda, H.; Nakanishi, H. Jpn. J. Appl. Phys. 1996, 35, L221A. (b) An, B. K.; Kwon, S.-K.; Park, S. Y. Angew. Chem. Int. Ed. 2007, 119, 2024;
Angew. Chem. 2007, 119, 2024. (c) Shao, H. X.; Chen, X. P.; Wang, Z.
X.; Lu, P. J. Phys. Chem. B 2007, 111, 10386. (d) Irie, M.; Fukaminato, T. Adv. Mater. 2006, 18, 3225.
(2) (a) Zhu, L.; Wu, W. W.; Zhu, M. Q.; Han, J. J.; Hurst, J. K.; Li, A. D. Q.
J. Am. Chem. Soc. 2007, 129, 3524. (b) Dong, S.; Roman, M. J. Am. Chem. Soc. 2007, 129, 13810. (c) Kim, S.; Ohulchanskyy, T. Y.;
Pudavar, H. E.; Panday, R. K.; Prasad, P. N. J. Am. Chem. Soc. 2007,
129, 2669.
(3) (a) Wakamiya,A.; Mori, K.; Yamaguchi, S. Angew. Chem. Int. Ed. 2007,
46, 4273. (b) Yuan, C.-X.; Tao, X.-T.; Ren, Y.; Li, Y.; Yang, J.-X.; Yu,
W.-T.; Wang, L.; Jiang, M.-H. J. Phys. Chem. C 2007, 111, 12811. (c) Huang, T.-H.; Lin, J. T.; Tao, Y.-T.; Chuen, C.-H. Chem. Mater. 2003,
15, 4854. (d) Lee, Y.-T.; Chiang, C.-L.; Chen, C.-T. Chem. Commun.,
2008, 217.
(4) (a) Ishow, E.; Brosseau, A.; Clavier, G.; Nakatani, K.; Pansu, R.; Vachon, J.-J.; Tauc, P.; Chauvat, D.; Mendonça, C. R.; Piovesan, E. J.
Am. Chem. Soc. 2007, 119, 8970. (b) Patra, A.; Anthony, S. P.;
Radhakrishnan, T. P. Adv. Func. Mater. 2007, 17, 2077.
(5) (a) Shirota, Y. J. Mater. Chem. 2005, 15, 75. (b) Chen, C.-T. Chem.
Mater. 2004, 16, 4389.
(6) (a) Wang, L.; Tan, W. Nano Letters 2006, 6, 84. (b) Agrawal, A. Zhang, C. Byassee, T. Tripp, R. A. Nie, S. Anal. Chem. 2006, 78, 1061. (7) (a) Suo, Z.; Drobizhev, M.; Spangler, C. W.; Christensson, N.; Rebane,
A. Org. Lett. 2005, 7, 22. (b) Porrès, L.; Mongin, O.; Katan, C.; Charlot, M.; Pons, T.; Metz, J.; Blanchard-Desce, M. Org. Lett. 2004, 6, 47. (c) Varnavski, O.; Yan, X.; Mongin, O.; Blanchard-Desce, M.; Goodson III, T. J. Phys. Chem. C 2007, 111, 149. (d) Kato, S.-I.; Matsumoto, T.; Shigeiwa, M.; Gorohmaru, H.; Maeda, S.; Ishi-I, T.; Mataka, S. Chem.
Eur. J. 2006, 12, 2303. (d) Allain C.; Schmidt, F.; Lartia, R.; Bordeau
G.; Fiorini-Debuisschert C.-F.; Charra, F.; Tauc, P.; Teulade-Fichou, M.-P. ChemBioChem. 2007, 8, 424.
(8) (a) Beljonne, D.; Wenseleers, D. W.; Zojer, E.; Shuai, Z.; Vogel, H.; Pond,. S. J.; Perry, J. W.; Marder, S. R.; Brédas, J.-L. Adv. Func. Mater.
2002, 12, 631. (b) Beverina, L.; Fu, J.; Leclerq, A.; Zojer, E.; Pacher, P.;
Barlow, S.; Van Stryland, E. W.; Hagan, D. J.; Brédas, J.-L.; Marder, S. R. J. Am. Chem. Soc. 2005, 117, 7282.
(9) (a) Cohanoschi, I. Yao, S. Belfield, K. D. Hernandez, F. E. J. Appl. Phys.
2007, 101, 086112. (b) Belfield, K. D.; Bondar, M. V.; Hernandez, F. E.;
Przhonska, O. V.; Yao S. Chem. Phys. 2006, 320, 118. (c) Kim, S.; Zheng, Q.; He, G. S.; Bharali, D. J.; Pudavar, H. E.; Baev, A.; Prasad, P. N. Adv. Func. Mater. 2006, 16, 2317.
(10) Krishna, T. R.; Parent, M.; Werts, M. H. V.; Moreaux, L.; Gmouh, S.; Charpak, S.; Caminade, A.-N.; Majoral, J.-P.; Blanchard-Desce M.
A series of dipolar amorphous triphenylamine derivatives exhibiting fluorescence in the solid state has been synthesized. Perfectly spherical nanoparticles have been obtained by precipitation, and showed strong emission in water from blue to red with no aggregation propensity after weeks of storage. Their two-photon absorption cross sections dramatically enhanced (up to thirty times) relative to solutions and large cell uptake open up a new alternative for near-infrared bioimaging.
-S1-
Supporting Information to Accompany
Two-Photon Fluorescent Amorphous Organic Nanoparticles
Contribution from
ENS Cachan, PPSM-CNRS UMR 8531, 61 av. Pdt Wilson, 94235 Cachan Cedex, France
Eléna Ishow,* Arnaud Brosseau, Gilles Clavier, Keitaro Nakatani, Céline Fiorini-Debuisschert,
Patrick Tauc, Julie Lagirand-Cantaloube, Céline Fiorini-Debuisschert, Anne Léaustic, Olivier Sandre
and Sophie Neveu
Experimental Section
Synthetic procedures S1
Thermal and photophysical studies (absorption and emission) S6
Two-photon absorption cross section measurements S9
Ab-initio computations S10
Structural characterizations of nanoparticles Cell culture and two-photon imaging References
S12 S13 S13
Synthetic procedures
All chemical reagents and solvents were purchased from commercial sources (Aldrich, Acros, SDS) and used as received. Spectroscopic grade toluene was used for spectroscopic measurements. All air-sensitive reactions were performed under argon using a vacuum line. Analytical TLC was performed on Kieselgel F-254 precoated plates. Visualization was done with UV lamp. Flash chromatography was carried out with silica gel 60 (230-400 mesh) from Merck. 4,4’-di(bromophenyl)amine[1], bis(4-bromophenyl)phenylamine[2] and bis(4’-tert-butylbiphenyl-4-yl)-4-nitrophenylamine[3] 4 were synthesized according to reported literature procedures.
1
H and 13C NMR spectra were recorded on a Bruker 300 MHz spectrometer, and chemical shifts δ were reported in ppm relative to TMS and referenced to the residual solvent. High resolution mass spectra were obtained by MALDI-TOF (Voyager-DE sSTR, Perseptive Biosystems) or ESI-TOF (LCT, Waters) techniques.
-S2-
N
1
4-di(4’-tert-butylbiphenyl-4-yl)aminobenzene 1:[4] A solution of bis(4-bromophenyl)phenylamine (1.822 g, 4.52 mmol) and tetrakistriphenylphosphinepalladium(0) (156 mg, 0.13 mmol) in 20 mL of toluene was stirred at room temperature under argon for 15 min. A solution of 4-tert-butylphenylboronic acid (1.690 g, 9.5 mmol) in 5 mL of methanol was added, followed by the addition of a 2 mol.L-1 aqueous carbonate solution (1.916 g, 18 mmol). The resulting reaction mixture was heated for 20 h at 80 °C. After being cooled to room temperature, the reaction mixture was extracted with toluene. The combined organic layers were washed with 10 % aqueous ammonia solution and brine, and dried over anhydrous magnesium sulphate. Concentration in vacuo followed by flash column chromatography on a column of silica gel using 10 % dichloromethane in petroleum ether (45-65) as the eluent, afforded 1 as fluffy white flakes (710 mg, 31 %). Tg 68 °C. 1 H NMR (300 MHz, CDCl3): δ = 7.52 (d, 3 J = 8.5 Hz, 4H), 7.48 (d, 3J = 8.5 Hz, 4H), 7.45 (d, 3J = 8.5 Hz, 4H), 7.27 (dd, 3J = 7.0; 8.4 Hz, 2H), 7.17 (d, 3J = 8.5 Hz, 4H), 7.15 (d, 3J = 8.4 Hz, 2H), 7.05 (t, 3J = 7.0 Hz, 1H), 1.36 ppm (s, 18H); 13C NMR (75 MHz, CDCl3): δ = 149.9, 147.8, 146.9, 137.9, 135.4, 129.4, 127.8, 126.5, 125.8, 124.7, 124.3, 123.1, 34.6, 31.5 ppm. HR-MS (MALDI-TOF) m/z [M]+ for C38H39N: calcd. 509.30770, found 509.30820. UV-vis toluene): λmax(ε) : 330 nm (37
400). Anal. calcd. for C38H39N: C, 89.54; H, 7.71; N, 2.75. Found: C, 89.27; H, 7.82; N, 2.63. Br
N Br
CHO 6
4-di(4-bromophenyl)aminobenzaldehyde 6:[5] A solution of trichloride phosphorus oxide POCl3 (7.58
mL, 81 mmol) in 15 mL of dimethylformamide was slowly added to a solution cooled at 0 °C of bis(4-bromophenyl)phenylamine (6.54 g, 16.2 mmol) in 15 mL of dimethylformamide. The solution was stirred at room temperature for 1 h, and heated at 80 °C under argon for 20 h. After cooling to room temperature, the reaction mixture was quenched with cool water and 10 mL of 1 mol.L-1 sodium hydroxide solution until neutral pH. The solution was extracted with chloroform. The combined organic extracts were dried over anhydrous magnesium sulphate and concentrated in vacuo. The residue was purified by flash chromatography on a column of silica gel (dichloromethane). The pale yellow collected fractions were
-S3-
evaporated in vacuo and the residue was recrystallized from cyclohexane to afford 6 as yellow flakes (1.58 g, 23 %). Mp 154 °C. 1H NMR (300 MHz, CDCl3): δ = 9.83 (s, 1H), 7.70 (d,
3
J = 8.5 Hz, 2H), 7.43 (d, 3J
= 8.8 Hz, 4H), 7.03 (d, 3J = 8.9 Hz, 2H), 7.01 ppm (d, 3J = 8.5 Hz, 4H); 13C NMR (75 MHz, CDCl3): δ =
190.5, 162.6, 152.5, 145.2, 133.1, 131.5, 127.6, 118.2 ppm. HR-MS (ESI-TOF) m/z [M]+ for C19H14NOBr2: calcd. 431.9422, found 431.9431. Anal. Calcd for C19H14NOBr2: C, 52.93; H, 3.04; N, 3.25.
Found C, 53.21; H, 2.94; N, 3.21.
N
CHO 3
4-di(4’-tert-butylbiphenyl-4-yl)aminobenzaldehyde 3: A solution of compound 6 (1.08 g, 2.5 mmol)
and tetrakistriphenylphosphinepalladium(0) (0.29 g, 0.25 mmol) in 15 mL of toluene was stirred at room temperature under argon for 15 min. A solution of 4-tert-butylphenylboronic acid (0.98 mg, 5.5 mmol) in 5 mL of methanol was added, followed by the addition of a 2 mol.L-1 aqueous carbonate solution (1.06 g, 10 mmol). The resulting reaction mixture was heated for 6 h at 80 °C. After being cooled to room temperature, the reaction mixture was extracted with toluene. The combined organic layers were washed with 10 % aqueous ammonia solution and brine, and dried over anhydrous magnesium sulphate. Concentration in vacuo followed by flash column chromatography on a column of silica gel (3/7 hexane/chloroform) afforded 3 as a fluorescent yellow solid (0.74 g, 55%). Tg 77 °C.
1
H NMR (300 MHz, CDCl3): δ = 9.83 (s, 1H), 7.72 (d, 3J = 8.5 Hz, 2H), 7.57 (d, 3J = 8.8 Hz, 4H), 7.53 (d, 3J = 9.2 Hz, 4H),
7.47 (d, 3J = 7.9 Hz, 4H), 7.25 (d, 3J = 8.1 Hz, 4H), 7.12 (d, 3J = 8.5 Hz, 2H), 1.37 ppm (s, 18H). 13C NMR (75 MHz, CDCl3): δ = 190.5, 153.4, 150.5, 145.2, 137.9, 137.5, 131.5, 129.5, 128.3, 126.7, 126.5,
126, 120.0, 34.7, 31.5 ppm. HR-MS (MALDI-TOF) m/z [M]+ for C39H39NO: calcd. 537.30262, found
-S4-
N
CN CN
5
4-di(4’-tert-butylbiphenyl-4-yl)amino-4’-dicyanovinylbenzene 5: A solution of 3 (537 mg, 1 mmol),
malonitrile (100 mg, 1.5 mmol), and a catalytic amount of ammonium acetate (1 crystal) in a mixture of 2 mL of glacial acetic acid and 10 mL of pyridine was allowed to stir under argon at room temperature for 12 h. The bright red solution was added to 50 mL of water under stirring; the solid formed was filtered off and washed well with water. The compound was subjected to purification by chromatography on a column of silica gel using 25 % to 50 % chloroform in hexane as the eluent. Concentration of the collected fractions in vacuo afforded 5 as a bright red powder (560 mg, 96 %). Tg 86 °C.
1 H NMR (300 MHz, CDCl3): δ = 7.77 (d, 3 J = 9.2 Hz, 2H), 7.60 (d, 3J = 8.5 Hz, 4H), 7.47 (d, 3J = 8.5 Hz, 4H), 7.54 (d, 3J = 8.5 Hz, 4H), 7.53 (s, 1H), 7.27 (d, 3J = 8.8 Hz, 4H), 7.07 (d, 3J = 8.8 Hz, 4H), 6.97 (d, 3J = 8.8 Hz, 4H), 1.37 ppm (s, 18H); 13C NMR (75 MHz, CDCl3): δ = 157.9, 153.4, 150.8, 144.1, 139.0, 137.2, 131.1, 128.5, 126.9, 126.7, 126.0, 123.1, 119.1, 115.3, 114.2, 115.3, 114.2, 34.7, 31.5 ppm. HR-MS (MALDI-TOF) m/z [M]+ for C42H39N3: calcd. 585.31385, found 585.31612. UV-vis(toluene): λmax (ε): 453 (46700), 319 nm
(34300). Anal. Calcd. for C42H39N3. 0.07 CHCl3: C, 85.01; H, 6.62; N, 7.21. Found C, 84.97; H, 6.63; N,
7.08.
N
CN 7
4-Diphenylaminobenzonitrile 7: A solution of diphenylamine (1.12 g, 6.6 mmol), 4-bromobenzonitrile
(1.09 g, 6 mmol), Pd2(dba)3 (0.11 g, 0.12 mmol), dppf (0.2 g, 0.36 mmol), and sodium tertbutoxide (0.81
g, 8.4 mmol) in 50 mL of anhydrous toluene was stirred overnight under argon at 80 °C. After cooling to room temperature, the mixture was diluted with water, 10 % aqueous ammonia solution and extracted with toluene. The combined organic extracts were washed with brine, dried over anhydrous magnesium sulphate, and the solvent was removed in vacuo. The residue was subjected to flash chromatography on a column of silica gel (1/1 petroleum ether 45-65/dichloromethane). Recrystallization from ethanol 95%
-S5-
afforded 7 as a white needles (1.15 g, 64%). Mp 138°C.1H NMR (300 MHz, CDCl3): δ = 7.42 (d, 3
J = 8.5
Hz, 4H), 7.35 (d, 3J = 8.1 Hz, 2H), 7.32 (d, 3J = 7.7 Hz, 4H), 7.16-7.14 (m, 6H), 7.14 (d, 3J = 8.8 Hz, 4H),
6.96 ppm (d, 3J = 8.5 Hz, 4H). 13C NMR (75 MHz, CDCl3): δ = 151.7, 146.1, 133.3, 129.9, 126.3, 125.3,
119.8, 102.6 ppm. HR-MS (MALDI-TOF) m/z [M]+ for C19H14N2: calcd. 270.11515, found 270.11400.
Anal. Calcd. for C19H14N2: C, 84.42; H, 5.22; N, 10.36. Found C, 84.19, H, 5.14; N, 10.22.
N
CN
Br Br
8
4-di(4-bromophenyl)aminobenzonitrile 8: A solution of N-bromosuccinimide (1.05 g, 5.8 mmol) in 10
mL of DMF was added dropwise under stirring to a solution cooled at 0 °C of 7 (0.80 g, 2.9 mmol) in 10 mL of dimethylformamide. The resulting solution was allowed to stir at 0 °C for a further 12 h. Water was added under stirring to precipitate the dibrominated compound which was filtered off and washed with water. Recrystallization from a mixture of ethanol/choroform afforded 8 as a cream microcrystalline product (1.20 g, 97 %). Mp 197 °C. 1H NMR (300 MHz, CDCl3): δ = 7.45 (d,
3
J = 8.7 Hz, 4H), 7.44 (d, 3J
= 8.8 Hz, 4H), 6.99 (d, 3J = 8.8 Hz, 4H), 6.97 ppm (d, 3J = 9.2 Hz, 2H). 13C NMR (75 MHz, CDCl3): δ =
150.9, 144.9, 133.6, 133.2, 127.4, 120.9, 119.3, 118.3, 104.3 ppm. HR-MS (MALDI-TOF) m/z [M]+ for C19H12N2Br2: calcd. 425.93617, found 425.93525. Anal. Calcd. for C19H12N2Br2: C, 53.30; H, 2.83; N,
6.54. Found C, 53.05, H, 3.09; N, 6.29.
N
CN 2
4-di(4’-tert-butylbiphenyl-4-yl)aminobenzonitrile 2: A solution of compound 8 (670 mg, 2 mmol) and
tetrakistriphenylphosphinepalladium(0) (91 mg, 0.1 mmol) in 15 mL of toluene was stirred at room temperature under argon for 15 min. A solution of 4-tert-butylphenylboronic acid (560 mg, 4 mmol) in 2 mL of methanol was added, followed by the addition of a 2 mol.L-1 aqueous carbonate solution (670 mg, 8 mmol). The resulting reaction mixture was heated for 20 h at 80 °C under argon. After cooling to room temperature, the reaction mixture was extracted with toluene. The combined organic layers were washed
-S6-
with brine and dried over anhydrous magnesium sulphate. Concentration in vacuo followed by flash column chromatography on a column of silica gel (1/1 increasing to 5/7 hexane/chloroform) afforded 2 as a white solid (570 mg, 71%). Tg 94 °C. 1H NMR (300 MHz, CDCl3): δ = 7.57 (d, 3J = 8.5 Hz, 4H), 7.50 (d, 3
J = 9.2 Hz, 2H), 7.45 (d, 3J = 8.8 Hz, 4H), 7.23 (d, 3J = 8.8 Hz, 4H), 7.08 (d, 3J = 8.8 Hz, 4H), 1.36 ppm
(s, 18H); 13C NMR (75 MHz, CDCl3): δ = 151.6, 150.5, 145.0, 137.9, 137.4, 133.4, 128.4, 118.9, 126.3,
125.9, 120.3, 119.8, 102.9, 34.7, 31.5 ppm. HR-MS (MALDI-TOF) m/z [M]+ for C39H38N2: calcd.
534.30295, found 534.30126. UV-vis (toluene): λmax (ε): 335 nm (42000). Anal. Calcd. for C39H38N2.0.06
CHCl3: C, 86.51; H, 7.07; N, 5.16. Found C, 86.47; H, 7.26; N, 5.31.
Thermal and photophysical studies (absorption and emission)
Thermal properties were measured by using differential scanning calorimetry (Perkin Elmer Pyris Diamond) in alumina caps under a nitrogen flow at a scan rate of 10 °C.min-1 over the temperature range [25 °C - 250 °C].
UV-visible absorption spectra were recorded using a Varian Model Cary 5E spectrophotometer. Corrected emission spectra were obtained using a Spex Fluorolog 1681 spectrofluorometer.
Fluorescence quantum yield in toluene solution was determined from a solution of Coumarine 540 A in EtOH (Φf = 0.38) or diphenylanthracene in cyclohexane (Φf = 0.90) absorbing equally at the excitation
wavelength. Measurements of Fluorescence quantum yield in the solid state were carried out using a Jobin-Yvon. Inc spectrofluorimter (Fluoromax 4) equipped with a hollow integrating sphere coated on its internal surface with a diffusely reflecting material (reflecting efficiency: 95% in the spectral range 250-2500 nm).
Fluorescence intensity decays were measured by the time-correlated single-photon counting method with a picosecond laser excitation at 330 nm provided by a Spectra-Physics setup composed of a titanium-sapphire Tsunami Laser pumped by an argon ion laser, and doubling LBO crystals and tripling BBO crystals. Light pulses were selected by an opto-acoustic crystal at a repetition rate of 4 MHz. Fluorescence photons were detected through a monochromator by a Hamamatsu MCP photomultiplier R3809U connected to a constant-fraction discriminator. Pulse deconvolution was performed from the time profile of the exciting pulse recorded under the same conditions by using a Ludox solution.
-S7-
Table 1. Thermal and spectroscopic properties of derivatives 1−−−−5.
Compound Tg a [°C] µ[D] calc λmax abs [nm] λmax em (φF c,d ) [nm] τS e [ns] 1 68 0.21 C6H12 toluene filmb 328 331 338 376 (0.73) 384 (0.79) 383 (0.45) 1.34 2 94 7.13 C6H12 toluene filmb 331 336 336 395 (0.42) 421 (0.34) 432 (0.81) 1.61 3 77 6.20 C6H12 toluene filmb 335, 365 340, 368 340, 377 421 (0.34) 466 (0.37) 484 (0.39) 3.98 4 92 9.03 C6H12 toluene filmb 322, 397 324, 408 324, 415 507 (0.22) 574 (0.12) 601 (0.15) 2.84 5 86 11.29 C6H12 toluene filmb 314, 447 320, 454 319, 479 530 (0.27) 594 (0.22) 631 (0.20) 4.37
aDSC analysis using a 10 °C.min-1 thermal gradient. bSpin-coated film from chloroform solution. cFluorescence standards:
9,10-diphenylanthracene in cyclohexane (φF = 0.90) for 1-3 and coumarine 540A in EtOH (φF = 0.38) for 4-5. dFrom integration
sphere measurements. eMeasured in toluene by time-correlated single photon counting.
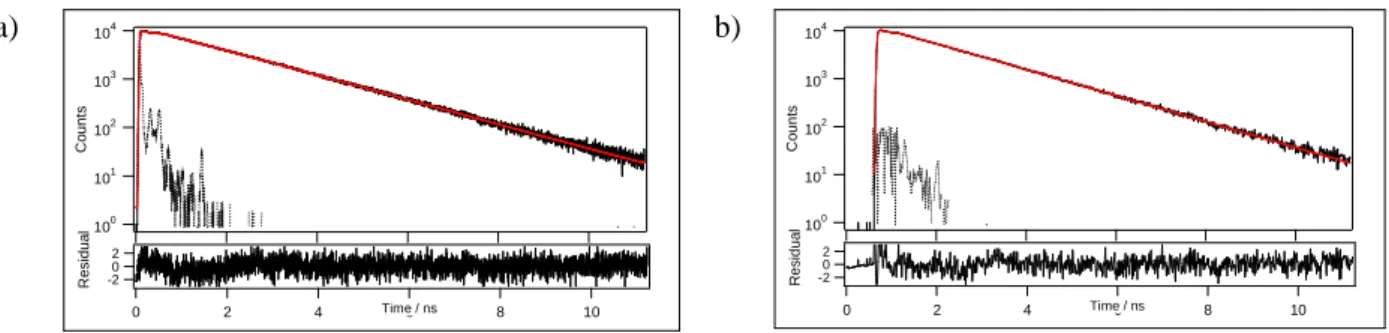
Single-photon counting lifetime measurements. Fluorescence decays.
a) 100 101 102 103 104 C o u n ts -20 2 10 8 6 4 2 0 R e s id u a l Time / ns b) 100 101 102 103 104 C o u n ts -20 2 10 8 6 4 2 0 R e s id u a l Time / ns
Figure 1. Fluorescence decay curves of compound 1 in a) cyclohexane (τ = 1.30 ns, χ2 = 1.11) and b) toluene (τ = 1.34 ns,χ2 = 1.18). Monoexponential fit (red curve) and residual for decay at 386 nm following a 330 nm excitation pulse.
-S8- a) 100 101 102 103 104 C o u n ts -20 2 10 8 6 4 2 0 R e s id u a l Time / ns b) 100 101 102 103 104 C o u n ts -20 2 10 8 6 4 2 0 R e s id u a l Time / ns
Figure 2. Fluorescence decay curves of compound 2 in a) cyclohexane (τ = 1.71 ns, χ2 = 1.15), and b) toluene (τ = 1.61 ns, χ2 = 1.15). Monoexponential fit (red curve) and residual for decay at 420 nm following a 330 nm excitation pulse.
a) 100 101 102 103 104 C o u n ts -2 0 2 10 8 6 4 2 0 R e s id u a l Time / ns b) 100 101 102 103 104 C o u n ts -2 0 2 30 25 20 15 10 5 0 R e s id u a l Time / ns
Figure 3. Fluorescence decay curves of compound 3 in a) cyclohexane (τ1 = 1.59 ns, a1 = 1.52, τ2 = 1.04
ns, a 2 = 6.32, χ2 = 1.10), and b) toluene (τ1 = 3.98 ns, a1 = 1.24, τ2 = 1.71 ns, a 2 = 0.26, χ2 = 1.02). Biexponential fit (red curve) and residual for decay at 430 nm in cyclohexane and 500 nm in toluene following a 330 nm excitation pulse.
a) 100 101 102 103 104 C o u n ts -2 0 2 20 15 10 5 0 R e s id u a l Time / ns b) 100 101 102 103 104 C o u n ts -2 0 2 30 25 20 15 10 5 0 R e s id u a l Time / ns
Figure 4. Fluorescence decay curves of compound 5 in a) cyclohexane (τ = 3.23 ns, χ2 = 1.12) and b) toluene (τ = 4.37 ns, χ2 = 1.20). Monoexponential fit (red curve) and residual for decay at 540 nm in cyclohexane and 590 nm in toluene following a 330 nm excitation pulse.
-S9-
Two-photon absorption cross section measurements
Two-photon excited fluorescence measurements (TPEF) were performed using a mode-locked Ti-sapphire laser (Tsunami, Spectra Physics) delivering 90 fs pulses with a 76 MHz repetition rate, using fluorescein in 0.01 mol.L-1 NaOH as reference. The experimental set-up used was adapted from literature reports.[6] The Ti-Sapphire excitation beam was focussed in a 1 cm-long and 2 mm -large cell filled with moderately concentrated solutions, using a 20 mm focal length lens. The signal was collected at 90° from excitation using a high NA lens: a spectrometer was used for detailed study of the emission spectra. The laser beam was linearly polarized and a set of half-wave plate and polarizer was used to vary the fundamental beam intensity. Excitation spectra were determined following measurements of the whole emitted light using an amplified photodiode (Hamamatsu) preceded with filters cutting the fundamental beam (CVI short pass filter and Schott BG40 color filter). For each dye, the quadratic dependence of the signal with the pump beam was checked.
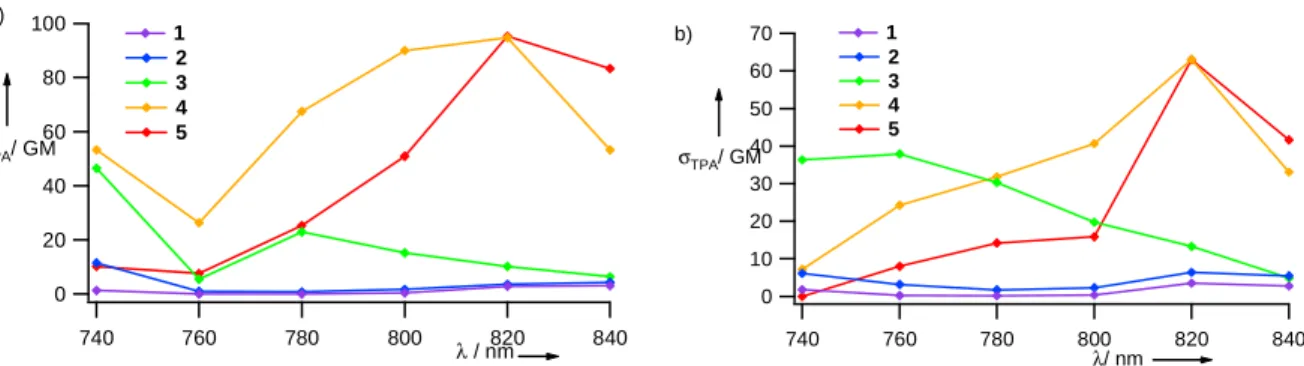
100 80 60 40 20 0 σTPA/ GM 840 820 800 780 760 740 λ / nm 1 2 3 4 5 a) 70 60 50 40 30 20 10 0 σTPA/ GM 840 820 800 780 760 740 λ/ nm 1 2 3 4 5 b)
Figure 4. Two-photon cross sections of compounds 1-5 in a) cyclohexane and b) toluene.
The two photon cross-sections of the sample were calculated from the following expression: ref s ref s TPA F F TPA σ σ ref s s ref I c I c ϕ ϕ
= where ϕFi designates the fluorescence quantum yield of compound i, ci the
concentration of compound i deduced from UV-vis absorption measurements in solution and Ii the
integrated fluorescence signal emitted by the compound i and detected at each wavelength. Quadratic dependence of the collected emission with the laser power as well as spectral matching between the one-photon and two-one-photon emission maxima were checked.
-S10-
Ab-initio computations
DFT calculations were conducted using Becke’s three-parameter hybrid functional[7] and the correlation functional of Lee, Yang and Parr[8] (B3LYP) with a 6-31G(d) basis set as implemented in the GAUSSIAN 03 package.[8] Illustrations were obtained with GaussView 3.0.
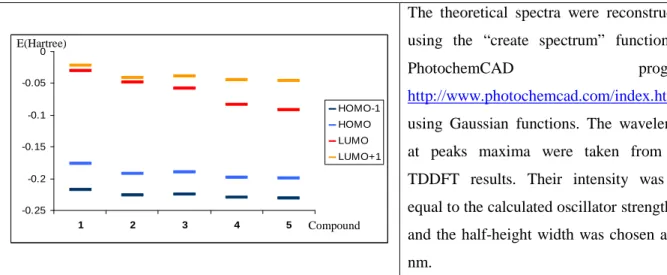
The theoretical spectra were reconstructed using the “create spectrum” function of
PhotochemCAD program
http://www.photochemcad.com/index.html using Gaussian functions. The wavelength at peaks maxima were taken from the TDDFT results. Their intensity was set equal to the calculated oscillator strength (f) and the half-height width was chosen at 40 nm.
Figure 5. Energy evolution (1 Hartree = 27.2116 eV) of the HOMO-1, HOMO, LUMO and LUMO+1 for compounds 1-5.
Table 3. TDDFT calculated absorption transitions and absorption spectra in gaz phase for compounds 1-5
(set B3LYP/ 6-31G(d)). λabs
max(calcd) [nm] (oscillator strength f) [a] Cpd HOMO-LUMO HOMO-LUMO+1 1 350.58 (0.8559) 2 350.64 (0.6062) 3 381.06 (0.5774) 340.50 (0.6798) 4 446.79 (0.4390) 331.20 (0.7258) 5 451.76 (0.8135) 335.83 (0.6347) 1.2 1.0 0.8 0.6 0.4 0.2 0.0 A / a.u. 550 500 450 400 350 300 250 λ / nm 1 2 3 4 5 -0.25 -0.2 -0.15 -0.1 -0.05 0 1 2 3 4 5 HOMO-1 HOMO LUMO LUMO+1 Compound E(Hartree)
-S11- 1 2 3 4 5 LUMO+1 LUMO HOMO HOMO-1
-S12-
Structural characterizations of nanoparticles
Dynamic light scattering
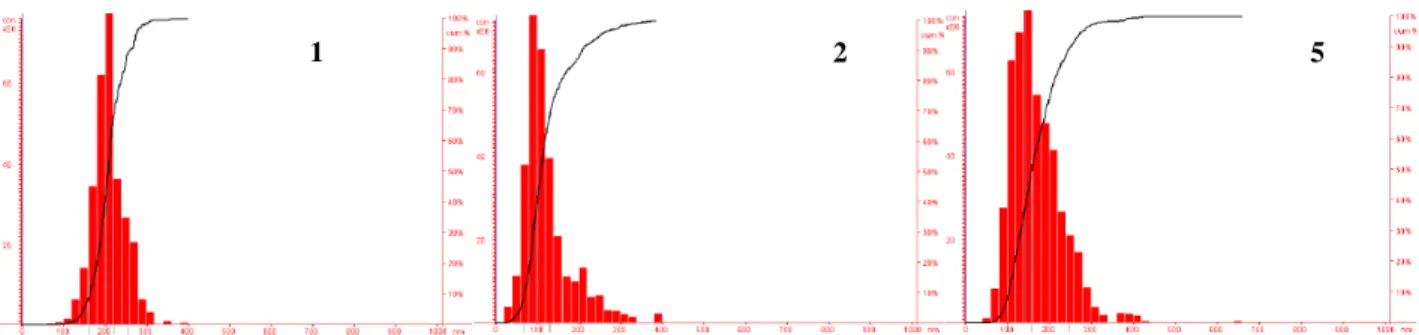
Mean particles size and distribution were measured in dilute solution by dynamic light scattering at 655 nm using the Nanoparticle Tracking Analyser provided by Nanosight (Nanosight LM20); the system allows nanoparticles to be dynamically visualized and counted in real time by analysing the paths each particle takes under Brownian motion by means of an optical microscope coupled to a camera.
Figure 7. Size distribution of precipitated nanoparticles obtained by adding 4 mL of pre-filtered deionized
water into a 0.2 mL acetonitrile solution containing 40 µg of compound. From left to right: nanoparticles of compound 1 (size~205 nm), compound 2 (size~95 nm), and compound 5 (size~145 nm).
TEM imaging
The morphology of the nanoparticles was investigated by transmission electron microscopy (TEM, JEOL 100CXII). Solutions of nanoparticles dispersed in a mixture of water:acetonitrile were deposited onto a carbon-coated copper grid. After solvent evaporation, the grid was exposed to ruthenium tetraoxide vapor for 10 s to stain the aromatic rings of the compounds and gain imaging contrast.
Figure 8. TEM images of precipitated nanoparticles after having been deposited on carbon-coated grid and
stained with RuO4 vapor. a) and b) Nanoparticles 2. c) Large view of nanoparticles 5.
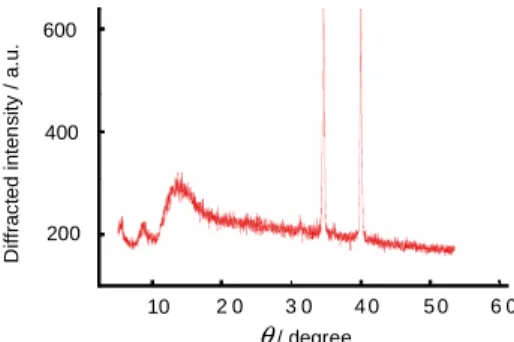
X-ray powder diffraction
Amorphous properties of the precipitated nanoparticles were checked by X-ray powder diffraction. The two peaks correspond to the diffracted patterns of the anti-cathode Cuα (1.54057 Å).
-S13-
Figure 9. X-ray powder diffraction spectrum of compound 4 precipitated by addition of water into an
acetonitrile solution and filtration.
Cell culture and two-photon imaging
NIH-3T3 murine fibroblasts were grown on XXX chambered coverslips in XXX supplemented with 10 % fetal bovine serum (105 cells per mL) in a humidified atmosphere at 37 °C with 5% CO2 for XX days. The
cells were fixed with methanol at -20 °C for 7 min., washed twice with PBS and incubated at 37 °C with 50 µL of compound 5 dissolved in dimethylsulfoxide at a concentration of 40 µg.mL-1 for 20 min. For two-photon imaging, the incubated cells were washed twice with PBS and then transferred on a thermally regulated stage of a Leica SP2 inverted microscope (DMIRE2) equipped with a Leica TCSP2 confocal system, an oil immersion objective (magnification 63× NA 1.32) and a Maï Taï tunable laser (Spectra Physics). Two-photon excitation was carried out at 820 nm and emission was collected in the 550-680 nm spectral range. The excitation wavelength was fixed at 820 nm, with pulses in the 100-200 fs range and repetition frequency around 80 MHz. Neither degradation, nor bleaching were observed during the image acquisition.
[1] B. E Love, E. G. Jones, Synth. Commun. 1999, 29, 2831-2840.
[2] K. Haga, K. Iwaya, R. Kaneko, Bull. Chem.Soc. Jpn. 1986, 59. 803-807.
[3] E. Ishow, A. Brosseau, G. Clavier, K. Nakatani, R. B. Pansu, J.-J. Vachon, P. Tauc, D. Chauvat, C. R. Mendonça, E. Piovesan J. Am. Chem. Soc. 2007, 129, 8970-8971.
[4] T. Ohno, K. Morikawi, T. Miyata, J. Org. Chem. 2001, 66, 3397-3401. [5] P. Wei, X. Bi, Z. Wu, Z. Xu, Org. Lett. 2005, 7, 15, 3199-3202.
[6] M. A. Albota, C. Xu, W. W. Webb, Nature Biotechnology 1998, 37, 7532-7356. [7] A. D. Becke, J. Chem. Phys. 1993, 98, 5648-5652.
[8] C. Lee, W. Yang, R. G. Parr, Phys. Rev. B 1988, 37, 785-789.
10 20 30 40 50 60 200 400 600 θ/ degree D if fr a c te d i n te n s it y / a .u .
-S14-
[9] Gaussian 03, Revision C.02, Frisch, M. J.; Trucks, G. W.; Schlegel, H. B.; Scuseria, G. E.; Robb, M. A.; Cheeseman, J. R.; Montgomery, Jr., J. A.; Vreven, T.; Kudin, K. N.; Burant, J. C.; Millam, J. M.; Iyengar, S. S.; Tomasi, J.; Barone, V.; Mennucci, B.; Cossi, M.; Scalmani, G.; Rega, N.; Petersson, G. A.; Nakatsuji, H.; Hada, M.; Ehara, M.; Toyota, K.; Fukuda, R.; Hasegawa, J.; Ishida, M.; Nakajima, T.; Honda, Y.; Kitao, O.; Nakai, H.; Klene, M.; Li, X.; Knox, J. E.; Hratchian, H. P.; Cross, J. B.; Bakken, V.; Adamo, C.; Jaramillo, J.; Gomperts, R.; Stratmann, R. E.; Yazyev, O.; Austin, A. J.; Cammi, R.; Pomelli, C.; Ochterski, J. W.; Ayala, P. Y.; Morokuma, K.; Voth, G. A.; Salvador, P.; Dannenberg, J. J.; Zakrzewski, V. G.; Dapprich, S.; Daniels, A. D.; Strain, M. C.; Farkas, O.; Malick, D. K.; Rabuck, A. D.; Raghavachari, K.; Foresman, J. B.; Ortiz, J. V.; Cui, Q.; Baboul, A. G.; Clifford, S.; Cioslowski, J.; Stefanov, B. B.; Liu, G.; Liashenko, A.; Piskorz, P.; Komaromi, I.; Martin, R. L.; Fox, D. J.; Keith, T.; Al-Laham, M. A.; Peng, C. Y.; Nanayakkara, A.; Challacombe, M.; Gill, P. M. W.; Johnson, B.; Chen, W.; Wong, M. W.; Gonzalez, C.; and Pople, J. A.; Gaussian, Inc., Wallingford CT, 2004.