HAL Id: hal-02747286
https://hal.archives-ouvertes.fr/hal-02747286
Submitted on 17 Jul 2020
HAL is a multi-disciplinary open access archive for the deposit and dissemination of sci-entific research documents, whether they are pub-lished or not. The documents may come from teaching and research institutions in France or abroad, or from public or private research centers.
L’archive ouverte pluridisciplinaire HAL, est destinée au dépôt et à la diffusion de documents scientifiques de niveau recherche, publiés ou non, émanant des établissements d’enseignement et de recherche français ou étrangers, des laboratoires publics ou privés.
in small size isolated populations, French Polynesia,
1978-2014
Yoann Teissier, Richard Paul, Maite Aubry, Xavier Rodó, Carlos Dommar,
Henrik Salje, Anavaj Sakuntabhai, Bernard Cazelles, Van-Mai Cao-Lormeau
To cite this version:
Yoann Teissier, Richard Paul, Maite Aubry, Xavier Rodó, Carlos Dommar, et al.. Long-term persis-tence of monotypic dengue transmission in small size isolated populations, French Polynesia, 1978-2014. PLoS Neglected Tropical Diseases, Public Library of Science, 2020, 14 (3), pp.e0008110. �10.1371/journal.pntd.0008110�. �hal-02747286�
RESEARCH ARTICLE
Long-term persistence of monotypic dengue
transmission in small size isolated
populations, French Polynesia, 1978-2014
Yoann Teissier1,2☯, Richard PaulID3,4☯*, Maite Aubry1, Xavier Rodo5,6, Carlos Dommar6,
Henrik Salje7, Anavaj Sakuntabhai3,4, Bernard Cazelles8,9,10☯, Van-Mai Cao-Lormeau1☯*
1 Laboratoire de recherche sur les maladies infectieusesàtransmission vectorielle, Institut Louis Malarde´ , Papeete, Tahiti, French Polynesia, 2 Universite´ Paris Descartes, PSL University, Paris, France, 3 Institut Pasteur, Unite´ de Ge´ne´tique Fonctionnelle des Maladies Infectieuses, UMR 2000 CNRS, Paris, France,
4 Pasteur Kyoto International Joint Research Unit for Integrative Vaccinomics, Kyoto, Japan, 5 ICREA,
Barcelona, Spain, 6 CLIMA (Climate and Health) Program, ISGlobal, Barcelona, Spain, 7 Institut Pasteur, Mathematical Modelling of Infectious Diseases Unit, UMR 2000, Centre National de la Recherche
Scientifique, Paris, France, 8 International Center for Mathematical and Computational Modeling of Complex Systems (UMMISCO), UMI 209, Sorbonne Universite´ - IRD, Bondy cedex, France, 9 iGLOBE, UMI CNRS 3157, University of Arizona, Tucson, Arizona, United States of America, 10 IBENS, UMR 8197 CNRS-ENS Ecole Normale Supe´ rieure, Paris, France
☯These authors contributed equally to this work.
*rpaul@pasteur.fr(RP);mlormeau@ilm.pf(VMCL)
Abstract
Understanding the transition of epidemic to endemic dengue transmission remains a chal-lenge in regions where serotypes co-circulate and there is extensive human mobility. French Polynesia, an isolated group of 117 islands of which 72 are inhabited, distributed among five geographically separated subdivisions, has recorded mono-serotype epidemics since 1944, with long inter-epidemic periods of circulation. Laboratory confirmed cases have been recorded since 1978, enabling exploration of dengue epidemiology under monotypic condi-tions in an isolated, spatially structured geographical location. A database was constructed of confirmed dengue cases, geolocated to island for a 35-year period. Statistical analyses of viral establishment, persistence and fade-out as well as synchrony among subdivisions were performed. Seven monotypic and one heterotypic dengue epidemic occurred, followed by low-level viral circulation with a recrudescent epidemic occurring on one occasion. Inci-dence was asynchronous among the subdivisions. Complete viral die-out occurred on sev-eral occasions with invasion of a new serotype. Competitive serotype replacement has been observed previously and seems to be characteristic of the South Pacific. Island population size had a strong impact on the establishment, persistence and fade-out of dengue cases and endemicity was estimated achievable only at a population size in excess of 175 000. Despite island remoteness and low population size, dengue cases were observed some-where in French Polynesia almost constantly, in part due to the spatial structuration generat-ing asynchrony among subdivisions. Long-term persistence of dengue virus in this group of island populations may be enabled by island hopping, although could equally be explained by a reservoir of sub-clinical infections on the most populated island, Tahiti.
a1111111111 a1111111111 a1111111111 a1111111111 a1111111111 OPEN ACCESS
Citation: Teissier Y, Paul R, Aubry M, Rodo X, Dommar C, Salje H, et al. (2020) Long-term persistence of monotypic dengue transmission in small size isolated populations, French Polynesia, 1978-2014. PLoS Negl Trop Dis 14(3): e0008110.
https://doi.org/10.1371/journal.pntd.0008110
Editor: Laith Yakob, London School of Hygiene & Tropical Medicine, UNITED KINGDOM Received: October 11, 2019 Accepted: February 2, 2020 Published: March 6, 2020
Copyright:© 2020 Teissier et al. This is an open access article distributed under the terms of the
Creative Commons Attribution License, which permits unrestricted use, distribution, and reproduction in any medium, provided the original author and source are credited.
Data Availability Statement: All data for review purposes can be accessed through the Dryad link
https://datadryad.org/review?doi=doi:10.5061/ dryad.gk100m1This URL will change if the MS is accepted and then become a more general URL for full data availability.
Funding: The research leading to these results has received funding from the European Commission Seventh Framework Program [FP7/2007-2013] for the DENFREE project under Grant Agreement n˚ 282 378 to RP,XR,BC,AS,VMCL (https://ec.europa.
Author summary
Dengue virus is the most significant arthropod-borne virus infecting man. Understanding how long dengue virus can persist in populations of varying size is key to understanding its epidemiology. This is, however, impossible to achieve in settings where dengue is endemic, because of continued human movement and is further complexified by the occurrence of several co-circulating serotypes. By contrast, French Polynesia, an isolated group of 72 inhabited islands in the South Pacific, has had intermittent majoritarily monotypic dengue epidemics since the 1940s and offers a unique opportunity to address questions of viral persistence, turnover and the importance of spatial sub-structure in determining dengue epidemiology. Collating and analyzing a database of laboratory-con-firmed dengue cases from across French Polynesia over a 35 year period we were able to show that dengue virus die-out can occur with or without replacement by a new serotype, monotypic transmission of dengue viruses fails to be maintained within small island pop-ulations but can persist for years among isolated islands connected via air and sea links. This remarkable long-term persistence of dengue virus in French Polynesia could be maintained by asynchronous viral transmission among connected islands and/or by repeated seeding from a reservoir of sub-clinical infections in the most populated island, Tahiti.
Introduction
Dengue is caused by any of four antigenically distinct dengue virus serotypes, designated DENV-1, DENV-2, DENV-3, and DENV-4, which are transmitted byAedes (Ae.) mosquito
species. Dengue has become a major international public health concern and over the past decade the number of outbreaks has escalated and the population at risk is increasing yearly [1–4]. More than 3.5 billion people are at risk of DENV infection and it has been estimated that there are 390 million DENV infections every year [5].
Understanding the spatio-temporal dynamics of dengue epidemiology is key for identifying reservoirs of infection, chains of transmission and quantifying the force of infection. Dengue epidemics occur intermittently, driven by climate suitability impacting mosquito density and vectorial capacity, and a sufficient non-immune population. In hyperendemic mainland regions, where the majority of the burden of disease occurs, dengue epidemiology is complexi-fied by the co-circulation and/or rapid sequential circulation of several serotypes, large scale movement of people on daily, monthly and annual timescales, leading to a changing viral com-munity on a changing human background. Coupled with difficulties in differentiating among DENV serotypes using serological methods and the high but variable incidence of inapparent infections, characterizing the spatio-temporal dimension of dengue epidemiology in such set-tings is challenging [6–9].
In contrast to such mainland hyperendemic settings, French Polynesia has a small popula-tion size (275 918 inhabitants, 2017 census) distributed on 72 isolated islands with a climate permissive for perennial mosquito-borne virus transmission [10]. Since 1944, French Polyne-sia Public Health authorities have reported 14 monotypic dengue epidemics often followed by long periods of low-level transmission and one recent heterotypic epidemic in 2013/4 [11]. Such a scenario offers a unique opportunity to address questions of viral persistence, turnover and the importance of spatial sub-structure in determining dengue epidemiology in small sized geographically isolated populations. Implicit in this first description of the data is the
eu/research/fp7/index_en.cfm). YT is thankful for financial support to undertake his PhD thesis from the De´le´gationà la Recherche de la Polyne´sie franc¸aise. The funders had no role in study design, data collection and analysis, decision to publish, or preparation of the manuscript.
Competing interests: The authors have declared that no competing interests exist.
question as to whether French Polynesia is effectively a meta-population whereby DENV is maintained by island-hopping or whether there is a single major source of infection on the main island of Tahiti that subsequently feeds DENV into the smaller islands. We provide here the first collation, description and analysis of dengue dynamics in French Polynesia over a 35-year period, from 1978 to 2014.
Methods
Study site, demographic and migration data
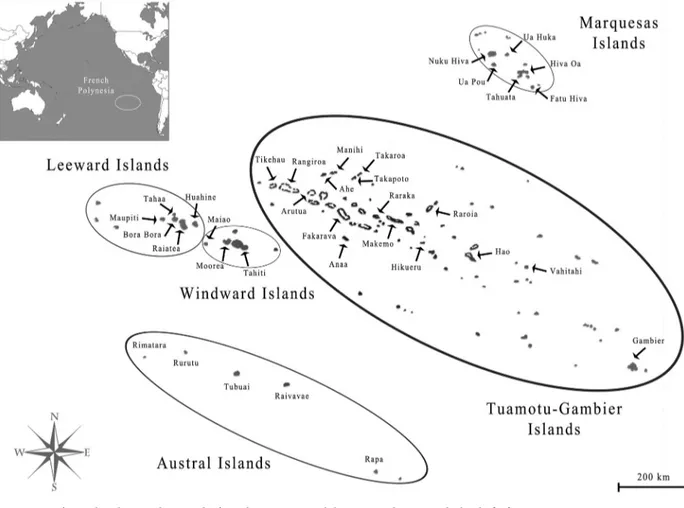
French Polynesia is located in the middle of the Pacific ocean and is composed of 117 islands [10], grouped into five administrative subdivisions: the Windward Islands (five islands), the Leeward Islands (nine), the Marquesas Islands (12), the Austral Islands (seven) and the Tua-motu-Gambier Islands (68 and 16, respectively)(Fig 1). Out of the 72 inhabited islands, only 15 have a population greater than 1 000 individuals, four (Moorea, Raiatea, Bora-Bora and Tahiti) have more than 10 000 and only Tahiti numbers over 100 000; at the last 2017 census, 68.7% of the total population of 275 918 lived on Tahiti [10]. Island population sizes were taken from the census records from 1971, 1983, 1988, 1996, 2002, 2007 and 2012 [10]. Among island air migration data was obtained from the Service d’Etat de l’Aviation civile en Polyne´sie Franc¸aise, Air Tahiti and the Direction de l’aviation civile. Data from 2010 was used for the correlation with the cross-correlation function.
Fig 1. Map of French Polynesia showing the five administrative subdivisions and associated islands. [12].
Dengue case data
Institut Louis Malarde´ (ILM) is a local biomedical research institute that has been involved in arbovirus diagnostic, surveillance and research in French Polynesia since the 1960s. The ILM receives samples from medical practitioners, health centers and laboratories all over French Polynesia and has recorded dengue confirmed cases from March 1975. The geolocation of the cases only started in August 1978. From 1978 to 2014, different laboratory techniques have been used to confirm dengue cases and, whenever possible, identify the serotype involved: inhibition of haemagglutination assay (1975–1988); intrathoracic inoculation of mosquitoes with the serum from suspected cases (1979–1980); isolation of DENV on C6/36 mosquito cell culture (1984–2005); IgM ELISA (from 1986); Reverse transcriptase Polymerase Chain Reac-tion (since 2000); NS1 antigen ELISA (from 2006).
Statistical analyses
Statistical analyses of the distribution of dengue cases were performed by fitting generalised linear models (GLM) to count data (loglinear regression) and proportion positive data (logistic regression). A dispersion parameter was estimated to account for any overdispersion of the data. Cross-correlation functions (CCF) for monthly dengue incidence (per 1000 individuals) across the entire 435 month period (August 1978 to October 2014) were calculated pairwise between the “capital” and the minor islands within each subdivision. Capital islands of each subdivision are defined as those being both highly inhabited and most connected to the other islands by air and boat. Only islands with six months or more incidence of dengue were ana-lysed; thus 21 islands were included. In all cases, the capital islands of each subdivision were taken as the lead island. Then, because islands may be indirectly connected, we repeated the analysis with Tahiti and all other islands. We first examined whether there significant autocor-relation within each island that might generate spurious results. There was no significant auto-correlation within any island within the selected lag month period of 20 months used in the correlation analysis. CCFs were then plotted against log10 population migration between island pairs, using the 2010 air travel data. Absolute air travel volume has altered across the 35-year period but not relatively so across islands.
The sample cross-correlation was calculated between the first island incidence series x and the second island incidence series y lagged at k months using
rk¼ 1 k n � � : Ck ðSx:SyÞ WhereCk¼ 1 nk Pn k t¼1ðxt �xÞ ytþk �y � .
The degree of significance, S, is calculated using aχ2with the number of lag months as the degrees of freedom (here selected as 20).
S ¼ nXm
k¼1r
2
k
Analyses were carried out in Genstat version 15 [13].
Wavelet analyses
As dengue dynamics in French Polynesia are very non-stationary, wavelet analyses were per-formed to explore dengue incidence periodicity [14,15]. Wavelet analysis enables investigation and quantification of the temporal evolution of time series with different rhythmic compo-nents. The Morlet wavelet was used and all analyses were performed with Matlab software
[14]. All dengue incidence time series were square root transformed and all series were nor-malized and the trend was suppressed before the computation of the wavelet power spectrum by removing the periodic components greater than 16 years by using a classical low pass filter [14]. Before investigating the synchrony between islands, we applied wavelet clustering [16] to quantify the similarity between the wavelet power spectra of all time series. This approach built cluster trees that grouped the wavelet power spectra based on the similarity of their time– frequency patterns using maximum covariance analysis [16]. Technically, the wavelet spectra are compared using a procedure based on the maximum covariance analysis that enables con-struction of a matrix of dissimilarities between wavelet power spectra over which a hierarchical clustering algorithm is applied. Then to quantify the synchrony in each subdivision, wavelet mean field (WMF) methodology was applied [17]. The magnitude of the WMF measures the strength of synchrony at both time period and frequency (periodic components). It is com-puted as a weighted average of normalized wavelet transforms of each time series [17]. Using WMF can characterize common periodic components and their potential time changes, then potential synchrony and its evolution. Significance levels of all different wavelet quantities were based on 1000 data-driven bootstrapped series with characteristics in agreement with those of the observed dataset [15].
Results
Spatio-temporal distribution of dengue cases
From August 1978 until October 2014 (435 months) the dengue database registered 48 261 geolocated results from laboratory analyses of which 14 382 were recorded as positive for DENV. Thirty-five islands (Windward– 3; Leeward– 5; Australs– 5; Marquesas– 6; Tuamotu-Gambier– 16) had at least one confirmed dengue case (S1 Table). The proportion of the popu-lation consulting for laboratory analyses from 1978 varied considerably among subdivisions, most notably being much lower in Tuamotu-Gambier (0.22%) compared to the other subdivi-sions (range 0.73% in the Australs to 1.31% in the Leeward islands). The age distribution of clinical presentations compared to the overall population was skewed by a higher percentage of children 0–1 years old presenting samples for testing (3.7% of this age group) and children aged 1–14 (1.7% of this age group) compared with 1% for older individuals. The age distribu-tion of samples sent to the laboratory for analysis and those found positive was strongly corre-lated for both genders (Male r2= 0.91; female r2= 0.85; P<0.001).
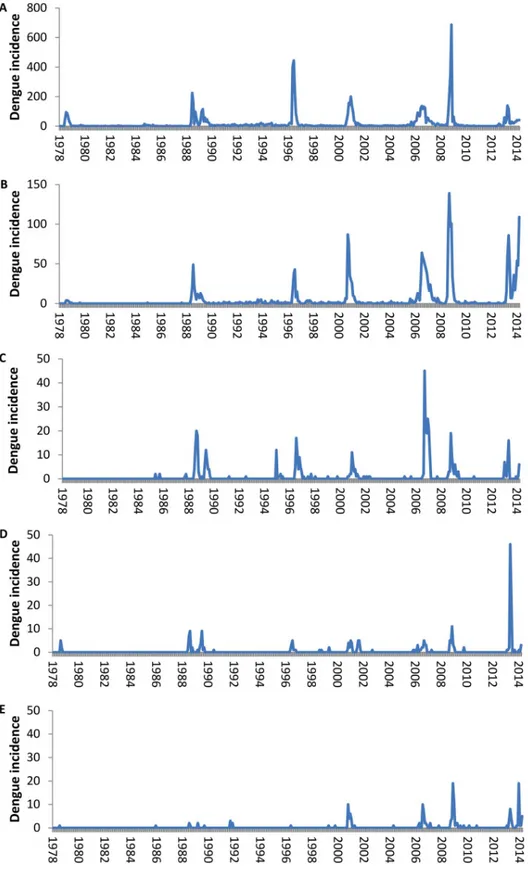
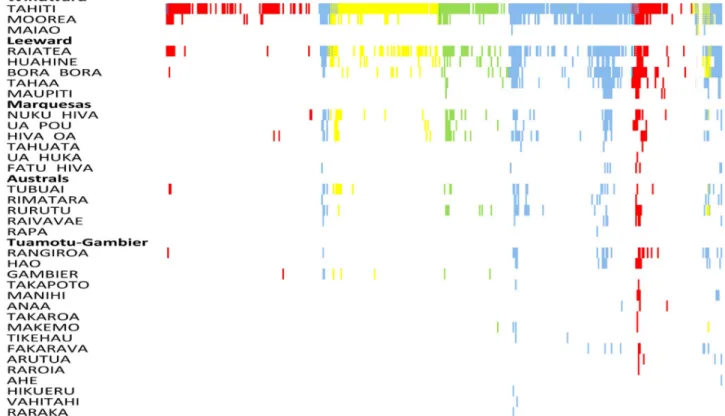
Over the 35-year period we defined eight epidemics (12 392 cases) and six inter-epidemic periods (1 990 cases) (Fig 2;S1 Text,S2andS3Tables). The corresponding occurrence of a dengue-incident month across all islands and according to DENV serotype is shown inFig 3. Until 2013, DENV circulation was monotypic with very few occasions of co-circulation of more than one serotype at any one time. The majority of the co-circulation events occurred during the initial phases of the invasion of a novel serotype. Although islands from all subdivi-sions registered at least one incidence-month of dengue from the start of the 35-year period, an increasing number of islands reported cases over time, particularly in the less populated subdi-visions, but which did not necessarily correspond to the amplitude of the dengue incidence. However, the overall number of cases was strongly positively correlated with the number of islands having at least one case during the month (Loglinear regression. Relative Risk (RR) per island number increase = 1.32, 95% Confidence intervals (CI) 1.30–1.34, P<0.001;S1 Fig).
Across the entire time period of 435 months, an absence of reported dengue cases for more than 1 month throughout French Polynesia was recorded on only 16 occasions (range 2–9 months), totalling 59 months (Fig 3). In Tahiti, the most populated island, there were no den-gue cases for two or more consecutive months on only 17 occasions (range 2–14 months),
Fig 2. Incidence of confirmed dengue cases in French Polynesia from August 1978 until October 2014. Total number of dengue cases per month per subdivision of French Polynesia. A- Windward Islands, B. Leeward Islands, C. Marquesas Islands, D. Austral Islands, E. Tuamotu-Gambier Islands.
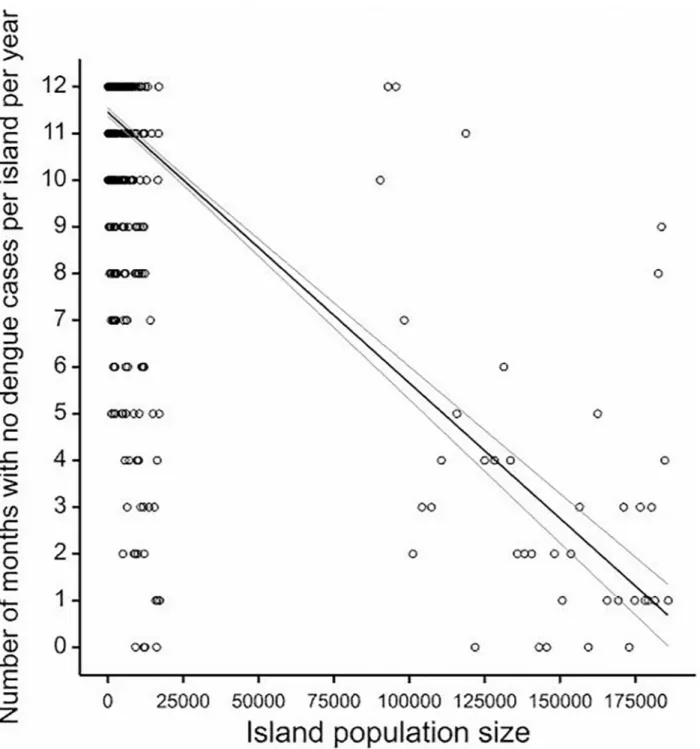
totalling 76 months absence. From November 1988 until May 2011 dengue cases were observed at least every other month somewhere across French Polynesia. To assess the Critical community size (CCS) permitting continuous circulation of DENV, we plotted the number of months per year with no dengue per island and the corresponding island size. Classically, the CCS is taken as the point at which the regression line crosses the zero month absence point on the Y-axis. However, because DENV is mosquito-borne and can persist in the infected mos-quito until it dies without being detectable in the human population, we relaxed the CCS defi-nition to crossing the one month dengue absence per year Y axis point. The CCS is estimated to exceed 175 000 individuals (Linear regression. P<0.001; 40.9% variance explained) (Fig 4). Island size being clearly a limiting factor for DENV persistence, we then addressed two pop-ulation size dependent phenomena: initial viral establishment in an island poppop-ulation and sub-sequent duration of viral transmission within the island.
The probability of DENV establishing itself for at least two consecutive dengue incident months was assessed as a function of island population size, the number of cases in the first month and DENV serotype. We first assumed that at least two consecutive months with den-gue cases was evidence of within-island transmission and not simply importation. The proba-bility of consecutive dengue incident months increased with both population size and number of cases in Month 1, reaching an asymptote at a population size in excess of 10 000 individuals and 30 dengue cases (Multivariate logistic regression, Log(10) population size: Odds Ratio (OR) for unit increase in log (10) population size = 3.36, 95% CI 2.68–4.22, P<0.001; Log(10) cases: OR for unit increase in log (10) case number = 21.7, 95% CI 13.6–34.4, P<0.001) (S2
andS3Figs). This suggests that the number of cases in month 1 has a strong impact on the probability of subsequent incident months up to a relatively low number of cases, beyond
Fig 3. Occurrence of at least one dengue case per month per island. Serotypes: Blue: DENV-1; Green: DENV-2; Yellow: DENV-3; Red: DENV-4.
which there is no increased probability. This increased risk is also observable with population size, but to a lesser extent (lower OR). DENV serotype (DENV-1, -2, -3, -4, or mixed -1 and -3) was not found to be associated with the probability of DENV transmission during two consecu-tive months (Waldχ2
4= 7.62, P = 0.17). Re-analysis excluding Tahiti revealed the same
asymp-tote for dengue cases but no asympasymp-tote whatever the population size, with increase in probability up to the maximum population size of approximately 17 000 in Moorea. Increasing the duration requirement to three consecutive months across all islands yielded an increased OR for log (10)
Fig 4. Critical community size of number of zero dengue case months per year per island.
population size (OR = 4.76, 95%CI 3.80–5.96) and for log (10) cases (OR = 36.56, 95%CI 21.35– 62.65). No population size asymptote was attained, but again an asymptote in the probability of having three consecutive months of transmission was observed at approximately 30 cases in the first month.
We next addressed the duration of viral transmission following at least two consecutive dengue incident months (when local viral transmission was presumed to be occurring) within an island as a function of population size, cumulative number of cases and DENV serotype. Local transmission was presumed to have stopped when there were three consecutive zero case months. The duration of viral circulation until three consecutive zero case months increased with island population size (RR = 1.7, 95%CI 1.39–2.07, P<0.001) and the cumula-tive number of dengue cases (RR = 2.49, 95%CI 2.13–2.91, P<0.001) (S4andS5Figs). DENV circulation was also longer for DENV-1 as compared to DENV-2, DENV-4 and the mixed DENV-1/3 epidemic (DENV-2: RR = 0.71, 95%CI 0.53–0.96, P = 0.025; DENV-4: RR = 0.63, 95%CI 0.51–0.79, P<0.001; DENV-1/3: RR = 0.59, 95%CI 0.41–0.85, P = 0.004), but not DENV-3 (RR = 0.77, 95%CI 0.57–1.03, P = 0.076) (S4andS5Figs).
Incidence synchrony among subdivisions and islands
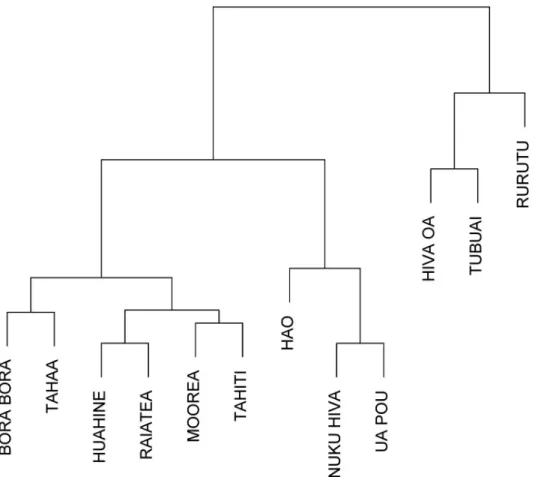
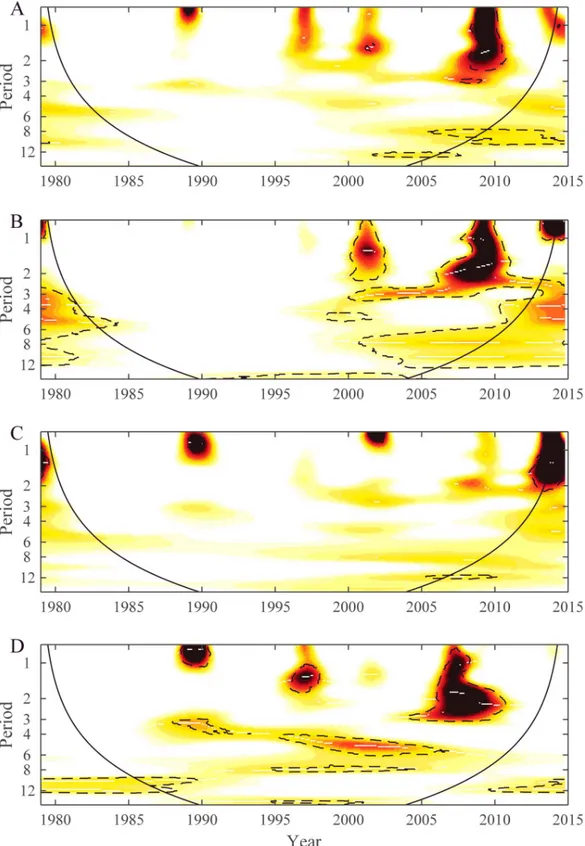
Wavelet power spectrum of time series data from 12 of the most populated islands of French Polynesia are displayed inS6andS7Figs. These 12 time series were chosen because they had enough dengue cases. In general, periodicities were detected in the 1-year, 2-year, 2–3-year and 6-year bands emphasizing that the seasonality is not marked and that each epidemic wave can last longer than 1 year. However, dengue dynamics varied across the 12 time series. To analyze these differences between time series wavelet cluster analysis [16] was performed and showed coherent dynamics within each subdivision.Fig 5shows the dendrogram obtained from wavelet clustering. Except for the time series from Hiva Oa, all others time series group by subdivision. Taking into account this subdivision arrangement for dengue dynamics, we applied WMF to quantify the synchrony inside each subdivision.Fig 6displays the results from WMF showing, for each subdivision, the common significant periodic components for which time series are synchronized highlighting each epidemic wave. This analysis demon-strates the differences among subdivisions in dengue periodicity, notably over the 1-year, 2-year, 2–3-year and 6-year periods. However, it is notable that the 2009–2010 DENV-4 epi-demic is synchronous in three subdivisions (Leeward, Windward and Marquesas islands), with a significant periodicity spreading over the 1–3 year band highlighting again the absence of seasonality of this epidemic.
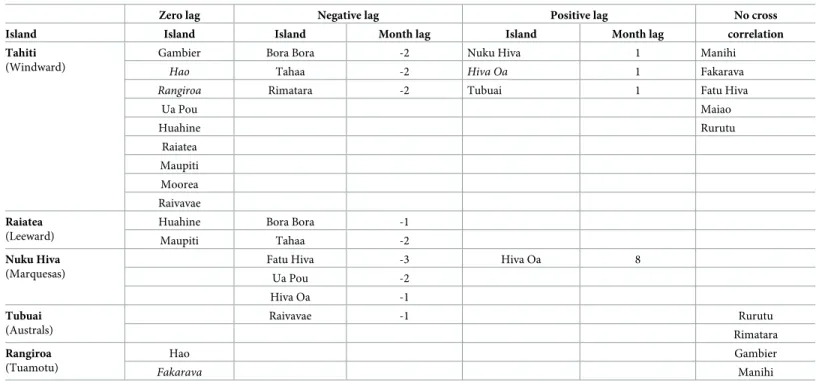
We then performed cross-correlation analyses firstly for all islands within each subdivision with the “capital” island of the subdivision and then all islands with Tahiti. Capital islands of each subdivision are defined as those being both highly inhabited and most connected to the other islands by air and boat. Individuals can island hop but their specific place of departure is not known, thus islands may be indirectly connected to Tahiti (or other capital islands). There was a significant cross-correlation with zero month lag for nine islands. Five islands showed no significant temporal association, three showed association with a positive lag (later than Tahiti) and three islands had a negative lag association. Notably Bora Bora and Tahaa precede Tahiti by two months. Cross-correlations within each of the other four subdivisions using the major island of each subdivision as the lead island yielded improved correlation (increased χ2
). Overall, when significant, most cross-correlations were either at zero lag or negative lag, suggesting that the smaller islands are synchronised with or leading the”capital” island within each archipelago (Table 1).
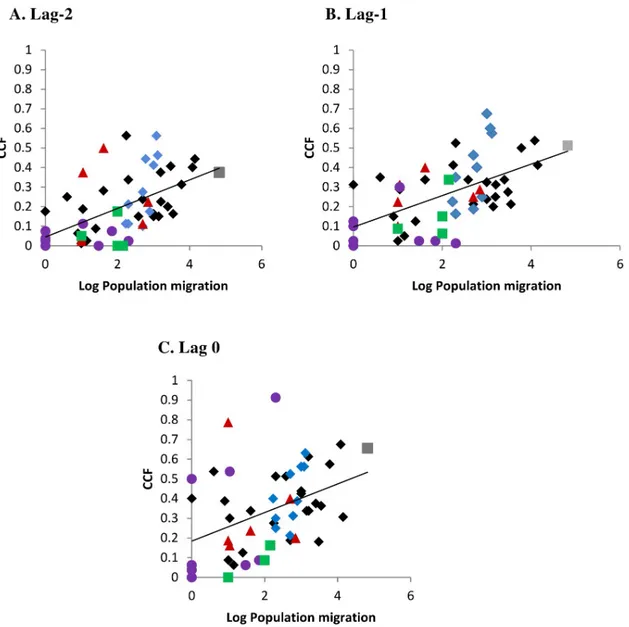
As shown inFig 7, there was an increase in the correlation of monthly incidence rate with increasing population exchange, using air travel data from 2010 (S4 Table). As indicated by different colours representing island correlations within subdivision (and black being among subdivision island correlations), the relationship was not influenced by subdivisionper se but
the extent of population exchange. Furthermore, the correlation (of CCF with population movement) was greater at months lag-1, lag-2 than at lag 0; this highlights the overall lack of immediate synchrony of the dengue incidence rate across connected populations.
Discussion
During the 35-year study period, dengue epidemiology was characterized by intermittent mono-serotype epidemics followed by inter-epidemic low circulation periods. With exception of Tahiti, the most populated island of French Polynesia, viral die-out at an island level was fre-quent and the majority of the less populated islands had few cases and rarely for more than 2 consecutive months. Indeed, according to our analyses, there was a reduced probability of islands smaller than 10 000 individuals having even two consecutive dengue positive months and a strong impact of population size on the duration of viral circulation once initiated. This would suggest that the virus is unable to take hold in these conditions, whether due to previ-ously acquired immunity or human or mosquito population density [18,19]. Despite this, almost permanent circulation of virus was observed for decades across French Polynesia and the estimated CCS of 175 000 was only attained in Tahiti in 2002 [10]. Implicit in this study
Fig 5. Dendrogram of wavelet clustering showing clusters with similar spectral features.
Fig 6. Wavelet mean field (WMF) spectra of dengue incidence time series for four subdivisions: A. Leeward, B. Windward, C. Australs and D. Marquesas. The plots show WMF representing common variance structures; common variance and synchrony (dark red) and absence of common variance (white). The dashed lines denote the 5% significance areas determined with a bootstrapping scheme based on a Hidden Markov process [15]. The black line defines the cone of influence below which the information is affected by edge effect.
was an assessment of whether there is evidence that a metapopulation approach to understand-ing the dynamics of dengue in French Polynesia is useful, based on classical concepts of syn-chrony and persistence. Dengue incidence was largely asynchronous across subdivisions, but partially synchronous within subdivision with correlations in dengue incidence occurring at zero or small lag times. It was also notable that correlations in incidence increased with inter-island population migration, irrespective of sub-division. These observations would support a meta-population structure to transmission within French Polynesia, where the virus hops from island to island, especially given that the critical community size to maintain virus was only achieved in Tahiti in 2002. However, the contribution of inapparent, subclinical infec-tions cannot be underestimated and may be sufficient for Tahiti alone to maintain a source of transmission [8].
More generally across the entirety of French Polynesia, three of the eight epidemics fizzled out after a relatively short period without any apparent change in climatic conditions and the virus continued circulating at a low level for an extended time before finally dying out. These three epidemics are: the DENV-4 1979 epidemic that lasted for 6 months but then persisted at a low level for another 113 months; the DENV-2 1996/7 epidemic that lasted for 9 months, before persisting for another 42 months; and the DENV-4 2009 epidemic that lasted for 8 months, before persisting for additional 15 months at sub-epidemic levels (S2 Table). How-ever, it is unclear whether DENV-2 died out alone as the last DENV-2 case was reported in December 2000 and the first DENV-1 case was reported the following month. Interestingly, two of the situations, where self-extinction occurred several months before the detection of a new serotype, involved DENV-4.
By contrast, in the other epidemics, there is clear suggestion that invasion of a new serotype excludes the current serotype. Within serotype competitive replacement among clades has been seen in many studies [20], where viral diversification during epidemics subsequently
Table 1. Cross-correlation over entire 435 month period of monthly incidence of dengue in all islands with Tahiti and with capital islands within each subdivision. Post Bonferroni correction non-significantly correlated islands in italics.
Zero lag Negative lag Positive lag No cross Island Island Island Month lag Island Month lag correlation Tahiti
(Windward)
Gambier Bora Bora -2 Nuku Hiva 1 Manihi
Hao Tahaa -2 Hiva Oa 1 Fakarava
Rangiroa Rimatara -2 Tubuai 1 Fatu Hiva
Ua Pou Maiao Huahine Rurutu Raiatea Maupiti Moorea Raivavae Raiatea (Leeward)
Huahine Bora Bora -1
Maupiti Tahaa -2
Nuku Hiva (Marquesas)
Fatu Hiva -3 Hiva Oa 8
Ua Pou -2 Hiva Oa -1 Tubuai (Australs) Raivavae -1 Rurutu Rimatara Rangiroa (Tuamotu) Hao Gambier Fakarava Manihi https://doi.org/10.1371/journal.pntd.0008110.t001
leads to purifying selection through immune selection in humans and mosquitoes [21]. How-ever, serotype replacement through competition has rarely been observed in most endemic natural settings [22], but seems to be a feature of the South Pacific region [23–26], except for French Polynesia.
Epidemic recrudescence of a persisting DENV occurred in 2006, with the same viral strain as in 2001 [27]. Judging from the time series (Fig 2), it would seem that the second epidemic must have occurred following expansion in the Windward Islands with subsequent exporta-tion to the Marquesas that had been spared the 2001 epidemic.
Fig 7. Cross-correlation of dengue incidence rate among connected islands with known extent of population migration (log10 transformed). Given are the cross-correlation functions (CCF) at different lag months between the lead and following island. Colours represent within subdivision island correlations: Grey square—Windward Islands, Blue diamonds—Leeward Islands, Brown triangles—Marquesas Islands, Green squares—Austral Islands, Mauve circles—Tuamotu-Gambier Islands. Black colour indicates among subdivision island correlations. Lines of tendency: Lag -2 month r2= 0.29; Lag -1 month r2= 0.32; Lag 0 month r2= 0.16. Population migration data used was air travel in 2010 (S4 Table).
How in French Polynesia, whatever the serotype, DENV circulation can persist between epidemics for several months with only few confirmed cases is perplexing. Viral maintenance by vertical transmission (VT) in mosquitoes might have occurred [28], but the role of VT is equivocal and the climatic conditions should have enabled active transmission. A significant role of inapparent infections that then led to viral transmission within naïve sub-populations seems a likely explanation.
Analyses using only laboratory confirmed cases underestimates the true burden of infection in the population where the majority are likely to be sub-clinical [8,29] and will be additionally confounded by both the vagaries of doctors’ demands for analyses to be performed and unequal access to health care facilities depending on the subdivision. This is especially evident in the Tuamotu-Gambier subdivision, from where there were few analyses performed and low confirmed dengue rates, but which was subsequently shown to have the same sero-prevalence rates as the other subdivisions [30]. An additional confounding factor in this study was that increasingly sensitive diagnostic techniques were used over time, thus making comparisons among epidemics untenable. However, insofar as this work analysed the data, for the most part, within time-period and across islands, temporal variation in diagnostic sensitivity should not alter our conclusions significantly. One feature not considered in this present study was the association of dengue incidence with climate. In French Polynesia, climate is suitable for dengue transmission year round with little variation in ambient temperature and the epidem-ics observed did not coincide with any major El Niño-Southern Oscillation events. However, the different nature of the islands, high islands as compared to atolls, could generate variability in local climate, especially rainfall and hence suitability for dengue transmission. Such island specific variation could differentially impact the different mosquito species that occur in the larger islands (Aedes aegypti) compared to the smaller outer islands (Aedes polynesiensis)
[31,32]. Both are capable of transmitting virus but have different ecologies and thus may be differentially affected by variation in climatic factors. With suitable environmental data at an island level, if available, further analysis would be of interest.
Spatial structuring of dengue epidemiology has been reported at micro- [33–37], meso- [6,
7,37–39] and macro-scales [39–44]. At increasing scales, human mobility becomes the major vector of virus, potentially providing the source of infection to generate novel, distal clusters of dengue [37,45]. This seems likely to be occurring to some extent in French Polynesia, but lim-ited to the most inhablim-ited islands. Inter-connectedness of islands does seem to enable dispersal of the virus throughout the territory, but with low probability of a subsequent epidemic occur-ring in the outlying islands. The long-term persistence of DENV duoccur-ring inter-epidemic peri-ods is remarkable and suggests that the within-island scale needs to be addressed as the foci of infection are likely to be very spatially limited. The impact of inapparent infections is likely to be non-negligible and sero-surveys across the subdivisions would reveal the extent to which herd immunity rather than stochastic viral die-out tempers the progression of epidemic viral transmission.
Supporting information
S1 Text. Epidemic and inter-epidemic period definition.
(DOCX)
S1 Fig. Relationship between the number of islands with dengue cases and the sum of the monthly dengue cases across all French Polynesia. Shown is the best fit line from the GLM
loglinear regression. (TIF)
S2 Fig. Probability of having a second consecutive month positive for a dengue case as a function of Island Log(10) population size. Shown are the best fit lines from the GLM logistic
regression and the adjusted probabilities (partial residuals) from the multivariate analysis. (TIF)
S3 Fig. Probability of having a second consecutive month positive for a dengue case as a function of Log(10) number of cases in the first month. Shown are the best fit lines from the
GLM logistic regression and the adjusted probabilities (partial residuals) from the multivariate analysis.
(TIF)
S4 Fig. Duration of viral transmission per island as a function of Island Log(10) popula-tion size and serotype. Shown are the best fit lines from the GLM loglinear regression and the
adjusted probabilities (partial residuals) from the multivariate analysis. Serotype colour codes are: DENV-1 red; DENV-2 green; DENV-3 blue; DENV-4 cyan; DENV1+3 pink.
(TIF)
S5 Fig. Duration of viral transmission per island as a function of Log(10) cumulative num-ber of cases including first two months of dengue case occurrence and serotype. Shown are
the best fit lines from the GLM loglinear regression and the adjusted probabilities (partial residuals) from the multivariate analysis. Serotype colour codes are: DENV-1 red; DENV-2 green; DENV-3 blue; DENV-4 cyan; DENV1+3 pink.
(TIF)
S6 Fig. Wavelet power spectrum of time series data from the first 6 of the 12 major islands of French Polynesia. Left panel: Local wavelet power spectrum. Colours code for power values
from white (low values) to dark red (high values). The black line defines the cone of influence below which the information is affected by edge effect. White lines represent the maxima of the undulations of the wavelet power spectrum. Right panel: Average wavelet power spectrum. For both panels, the dashed lines denote the 5% significance areas determined with a boot-strapping scheme based on a Hidden Markov process [14]. A: Bora Bora; B: Hao; C: Hiva Oa; D: Huahine; E: Moorea; F: Nuku Hiva.
(TIF)
S7 Fig. Wavelet power spectrum of time series data from the second 6 of the 12 major islands of French Polynesia. Left panel: Local wavelet power spectrum. Colours code for
power values from white (low values) to dark red (high values). The black line defines the cone of influence below which the information is affected by edge effect. White lines represent the maxima of the undulations of the wavelet power spectrum. Right panel: Average wavelet power spectrum. For both panels, the dashed lines denote the 5% significance areas deter-mined with a bootstrapping scheme based on a Hidden Markov process [14]. G: Raiatea; H: Rurutu; I: Tahaa; J: Tahiti; K: Tubuai; L: Ua Pou.
(TIF)
S1 Table. Dengue circulation within islands. Population size is the mid-term value from the
censuses [10]. Bold type for island showing the highest number of incidence months within each subdivision. Colour coding for different subdivisions.
(DOCX)
S2 Table. Summary data of the 8 epidemic and 6 inter-epidemic periods of dengue trans-mission between August 1978 and October 2014. Given are the etiological serotype and
total number of samples tested and found positive for DENV. NK–not known. (DOCX)
S3 Table. Number of confirmed dengue cases by subdivision and epidemic and inter-epi-demic period between August 1978 and October 2014.
(DOCX)
S4 Table. Air travel between islands in 2010.
(DOCX)
Acknowledgments
We are grateful to Mrs. Claudine ROCHE, ILM, for her contribution to complete the dengue database.
Author Contributions
Conceptualization: Richard Paul, Xavier Rodo, Anavaj Sakuntabhai, Bernard Cazelles,
Van-Mai Cao-Lormeau.
Data curation: Yoann Teissier, Maite Aubry.
Formal analysis: Richard Paul, Carlos Dommar, Henrik Salje, Bernard Cazelles.
Funding acquisition: Richard Paul, Xavier Rodo, Anavaj Sakuntabhai, Bernard Cazelles,
Van-Mai Cao-Lormeau.
Investigation: Yoann Teissier.
Methodology: Richard Paul, Henrik Salje, Anavaj Sakuntabhai, Bernard Cazelles, Van-Mai
Cao-Lormeau.
Resources: Yoann Teissier.
Supervision: Richard Paul, Maite Aubry, Xavier Rodo, Carlos Dommar, Anavaj Sakuntabhai,
Van-Mai Cao-Lormeau.
Validation: Richard Paul, Maite Aubry, Anavaj Sakuntabhai, Van-Mai Cao-Lormeau. Writing – original draft: Richard Paul, Maite Aubry, Bernard Cazelles, Van-Mai
Cao-Lormeau.
Writing – review & editing: Yoann Teissier, Xavier Rodo, Carlos Dommar, Henrik Salje,
Anavaj Sakuntabhai.
References
1. Gubler D, Kuno G, editors. Dengue and Dengue Hemorrhagic Fever. Wallingford: CAB International; 1997.
2. Lambrechts L, Scott TW, Gubler DJ. Consequences of the expanding global distribution of Aedes albo-pictus for dengue virus transmission. PLoS Negl Trop Dis 2010; 4: e646.https://doi.org/10.1371/ journal.pntd.0000646PMID:20520794
3. Halstead SB. Dengue. Lancet 2007; 370: 1644–52.https://doi.org/10.1016/S0140-6736(07)61687-0 PMID:17993365
4. World Health Organization. Dengue—Guidelines for diagnosis, treatment, prevention and control. Geneva: World Health Organization; 2009.
5. Bhatt S, Gething PW, Brady OJ, Messina JP, Farlow AW, Moyes CL, et al. The global distribution and burden of dengue. Nature 2013; 496: 504–507.https://doi.org/10.1038/nature12060PMID:23563266
6. Liebman KA, Stoddard ST, Morrison AC, Rocha C, Minnick S, Sihuincha M, et al. Spatial dimensions of dengue virus transmission across interepidemic and epidemic periods in Iquitos, Peru (1999–2003). PLoS Negl Trop Dis 2012; 6(2): e1472.https://doi.org/10.1371/journal.pntd.0001472PMID:22363822
7. Salje H, Lessler J, Endy T, Curriero FC, Gibbons RV, Nisalak A, et al. Revealing the microscale spatial signature of dengue transmission and immunity in an urban population. Proc Natl Acad Sci U S A 2012; 109: 9535–8.https://doi.org/10.1073/pnas.1120621109PMID:22645364
8. Grange L, Simon-Loriere E, Sakuntabhai A, Gresh L, Paul R, Harris E. Epidemiological risk factors associated with high global frequency of inapparent dengue virus infections. Frontiers in Immunology 2014; 5: 280.https://doi.org/10.3389/fimmu.2014.00280PMID:24966859
9. Salje H, Rodrı´guez-Barraquer I, Rainwater-Lovett K, Nisalak A, Thaisomboonsuk B, Thomas SJ, et al. Variability in dengue titer estimates from plaque reduction neutralization tests poses a challenge to epi-demiological studies and vaccine development. PLoS Negl Trop Dis 2014; 8(6): e2952.https://doi.org/ 10.1371/journal.pntd.0002952PMID:24967885
10. ISPF. Population le´gale—ISPF [cited 16 November 2018].http://www.ispf.pf/bases/Recensements/ 2017/poplegale.aspx.
11. Aubry M, Cao-Lormeau VM. History of arthropod-borne virus infections in French Polynesia. New Microbes New Infect. 2019 Feb 8; 29:100513.https://doi.org/10.1016/j.nmni.2019.01.009PMID: 30899520
12. Aubry M, Teissier A, Huart M, Merceron S, Vanhomwegen J, Roche C, et al. Zika Virus Seroprevalence, French Polynesia, 2014–2015. Emerg Infect Dis. 2017 Apr; 23(4):669–672.https://doi.org/10.3201/ eid2304.161549PMID:28084987
13. GenStat for Windows 15th Edition, VSN International Ltd., Hemel Hempstead, UK.
14. Cazelles B, Chavez M, Constantin de Magny G, Gue´gan JF, Hales S. Time dependent spectral analysis of epidemiological time series with wavelets. J Royal Soc Interface 2007; 4: 625–636.https://doi.org/ 10.1098/rsif.2007.0212PMID:17301013
15. Cazelles B, Cazelles K, Chavez M. Wavelet analysis in ecology and epidemiology: Impact of statistical tests. J Royal Soc Interface 2014; 11: 20130585.https://doi.org/10.1098/rsif.2013.0585PMID:24284892
16. Rouyer T, Fromentin JF, Stenseth NC, Cazelles B. Analysing multiple time series and extending signifi-cance testing in wavelet analysis. Mar Ecol Prog Ser. 2008; 359: 11–23.https://doi.org/10.3354/ meps07330
17. Sheppard LW, Bell JR, Harrington R, Reuman DC. Changes in large-scale climate alter spatial syn-chrony of aphid pests. Nature Climate Change 2016; 6: 610–613.https://doi.org/10.1038/nclimate2881
18. Brelsfoard CL, Dobson SL. Population genetic structure of Aedes polynesiensis in the society islands of french polynesia: implications for control using a wolbachia-based autocidal strategy. Parasites & Vec-tors 2012; 5: 80.https://doi.org/10.1186/1756-3305-5-80PMID:22531297
19. Rosen L, Rozeboom LE, Sweet BH, Sabin AB. The transmission of dengue by Aedes polynesiensis Marks. The American Journal of Tropical Medicine and Hygiene 1954; 3(5): 878–882.https://doi.org/ 10.4269/ajtmh.1954.3.878PMID:13197723
20. OhAinle M, Balmaseda A, Macalalad AR, Tellez Y, Zody MC, Saborı´o S, et al. Dynamics of dengue dis-ease severity determined by the interplay between viral genetics and serotype-specific immunity. Sci Transl Med 2011; 3: 114–128.https://doi.org/10.1126/scitranslmed.3003084PMID:22190239
21. Lambrechts L, Fansiri T, Pongsiri A, Thaisomboonsuk B, Klungthong C, Richardson JH, et al. Dengue-1 virus clade replacement in Thailand associated with enhanced mosquito transmission. J Virol 20Dengue-12; 86(3): 1853–1861.https://doi.org/10.1128/JVI.06458-11PMID:22130539
22. Thu HM, Lowry K, Myint TT, Shwe TN, Han AM, Khin KK, et al. Myanmar dengue outbreak associated with displacement of serotypes 2, 3, and 4 by dengue 1. Emerg Infect Dis 2004; 10 (4): 593–597. https://doi.org/10.3201/eid1004.030216PMID:15200847
23. Cao-Lormeau VM, Descloux E, Roche C, Aubry M, Teyssou R. Lost in French Polynesia: which strate-gies for a dengue virus to spread? The American Journal of Tropical Medicine and Hygiene 2007; 77(5 suppl): 129.
24. Chungue E, Deparis X, Murgue B. Dengue In French Polynesia: Major Features, Surveillance, Molecu-lar Epidemiology And Current Situation. Dengue Bulletin 1998; 22: 74–93.
25. Li DS, Liu W, Guigon A, Mostyn C, Grant R, Aaskov J. Rapid displacement of dengue virus type 1 by type 4, Pacific region, 2007–2009. Emerg Infect Dis 2010; 16(1): 123–5.https://doi.org/10.3201/ eid1601.091275PMID:20031057
26. Cao-Lormeau V-M, Roche C, Aubry M, Teissier A, Lastere S, Daudens E, et al. Recent Emergence of Dengue Virus Serotype 4 in French Polynesia Results from Multiple Introductions from Other South Pacific Islands. PLoS ONE 2011; 6(12): e29555.https://doi.org/10.1371/journal.pone.0029555PMID: 22216313
27. Descloux E, Cao-Lormeau VM, Roche C, De Lamballerie X. Dengue 1 diversity and microevolution, French Polynesia 2001–2006: connection with epidemiology and clinics. PLoS Negl Trop Dis 2009; 3 (8):e493.https://doi.org/10.1371/journal.pntd.0000493PMID:19652703
28. Lequime S, Paul RE, Lambrechts L. Determinants of arbovirus vertical transmission in mosquitoes. PLoS Pathog 2016; 12(5): e1005548.https://doi.org/10.1371/journal.ppat.1005548PMID:27171170
29. Clapham HE, Cummings DAT, Johansson MA. Immune status alters the probability of apparent illness due to dengue virus infection: Evidence from a pooled analysis across multiple cohort and cluster stud-ies. PLoS Negl Trop Dis 2017; 11(9): e0005926.https://doi.org/10.1371/journal.pntd.0005926PMID: 28953902
30. Aubry M, Teissier A, Huart M, Vanhomwegen J, Mapotoeke M, Mariteragi-Helle T, et al. Seropreva-lence of Dengue and Chikungunya Virus Antibodies, French Polynesia, 2014–2015. Emerg Infect Dis 2018; 24(3): 558–561.https://doi.org/10.3201/eid2403.171149PMID:29460745
31. Jachowski L.A. Filariasis in American Samoa. V. Bionomics of the principal vector, Aedes polynesiensis Marks. Am J Hyg. 1954; 60: 186–203. PMID:13197370.
32. Richard V, Cao-Lormeau VM. Mosquito vectors of arboviruses in French Polynesia. New Microbes New Infect. 2019 Jun 10; 31:100569.https://doi.org/10.1016/j.nmni.2019.100569PMID:31316821
33. Mammen MP, Pimgate C, Koenraadt CJ, Rothman AL, Aldstadt J, Nisalak A, et al. Spatial and temporal clustering of dengue virus transmission in Thai villages. PLoS Med 2008; 5: e205.https://doi.org/10. 1371/journal.pmed.0050205PMID:18986209
34. Hono´rio NA, Nogueira RMR, Codec¸o CT, Carvalho MS, Cruz OG, Magalhães Mde A, et al. Spatial Eval-uation and Modeling of Dengue Seroprevalence and Vector Density in Rio de Janeiro, Brazil. PLoS Negl Trop Dis 2009; 3(11): e545.https://doi.org/10.1371/journal.pntd.0000545PMID:19901983
35. Mondini A, Bronzoni RVdM, Nunes SHP, Chiaravalloti Neto F, Massad E, Alonso WJ, et al. Spatio-Tem-poral Tracking and Phylodynamics of an Urban Dengue 3 Outbreak in São Paulo, Brazil. PLoS Negl Trop Dis 2009; 3(5): e448.https://doi.org/10.1371/journal.pntd.0000448PMID:19478848
36. Vazquez-Prokopec GM, Kitron U, Montgomery B, Horne P, Ritchie SA. Quantifying the Spatial Dimen-sion of Dengue Virus Epidemic Spread within a Tropical Urban Environment. PLoS Negl Trop Dis 2010; 4(12): e920.https://doi.org/10.1371/journal.pntd.0000920PMID:21200419
37. Telle O, Vaguet A, Yadav NK, Lefebvre B, Cebeillac A, Nagpal BN, et al. The spread of dengue in an endemic urban milieu–the case of Delhi, India. PLoS One 2016; 11(1): e0146539.https://doi.org/10. 1371/journal.pone.0146539PMID:26808518
38. Bhoomiboonchoo P, Gibbons RV, Huang A, Yoon IK, Buddhari D, Nisalak A, et al. The spatial dynamics of dengue virus in Kamphaeng Phet, Thailand. PLoS Negl Trop Dis 2014; 8(9): e3138.https://doi.org/ 10.1371/journal.pntd.0003138PMID:25211127
39. Salje H, Lessler J, Maljkovic Berry I, Melendrez MC, Endy T, Kalayanarooj S, et al. Dengue diversity across spatial and temporal scales: Local structure and the effect of host population size. Science 2017; 355(6331):1302–1306.https://doi.org/10.1126/science.aaj9384PMID:28336667
40. Cummings DA, Irizarry RA, Huang NE, Endy TP, Nisalak A, Ungchusak K, et al. Travelling waves in the occurrence of dengue haemorrhagic fever in Thailand. Nature 2004; 427(6972):344–7.https://doi.org/ 10.1038/nature02225PMID:14737166
41. Cazelles B, Chavez M, McMichael AJ, Hales S. Nonstationary influence of El Niño on the synchronous dengue epidemics in Thailand. PLoS Med 2005; 2: e106.https://doi.org/10.1371/journal.pmed. 0020106PMID:15839751
42. Raghwani J, Rambaut A, Holmes EC, Hang VT, Hien TT, Farrar J, et al. Endemic dengue associated with the co-circulation of multiple viral lineages and localized density-dependent transmission. PLoS Pathog. 2011; 7(6): e1002064.https://doi.org/10.1371/journal.ppat.1002064PMID:21655108
43. Teurlai M, Huy R, Cazelles B, Duboz R, Baehr C, Vong S. Can human movements explain heteroge-neous propagation of dengue fever in Cambodia? PLoS Negl Trop Dis 2012; 6(12): e1957.https://doi. org/10.1371/journal.pntd.0001957PMID:23236536
44. Cuong HQ, Vu NT, Cazelles B, Boni MF, Thai KT, Rabaa MA, et al. Spatiotemporal dynamics of dengue epidemics, southern Vietnam. Emerg Infect Dis 2013; 19(6):945–53.https://doi.org/10.3201/eid1906. 121323PMID:23735713
45. Stoddard ST, Morrison AC, Vazquez-Prokopec GM, Paz Soldan V, Kochel TJ, Kitron U, et al. The role of human movement in the transmission of vector-borne pathogens. PLoS Negl Trop Dis 2009; 3: e481.https://doi.org/10.1371/journal.pntd.0000481PMID:19621090
![[PDF] Cours Algorithme et Structure de données en PDF | Cours informatique](data:image/gif;base64,R0lGODlhAQABAIAAAP///wAAACH5BAEAAAAALAAAAAABAAEAAAICRAEAOw==)