HAL Id: hal-02060441
https://hal.archives-ouvertes.fr/hal-02060441
Submitted on 7 Mar 2019
HAL is a multi-disciplinary open access
archive for the deposit and dissemination of
sci-entific research documents, whether they are
pub-lished or not. The documents may come from
teaching and research institutions in France or
abroad, or from public or private research centers.
L’archive ouverte pluridisciplinaire HAL, est
destinée au dépôt et à la diffusion de documents
scientifiques de niveau recherche, publiés ou non,
émanant des établissements d’enseignement et de
recherche français ou étrangers, des laboratoires
publics ou privés.
Detection of the conformational changes of Discosoma
red fluorescent proteins adhered on silver
nanoparticles-based nanocomposites via
surface-enhanced Raman scattering
Adriana Scarangella, Marvine Soumbo, Adnen Mlayah, Caroline Bonafos,
Marie-Carmen Monje, Christine Roques, Cécile Marcelot, Nicolas Large,
Thameur Dammak, K Makasheva
To cite this version:
Adriana Scarangella, Marvine Soumbo, Adnen Mlayah, Caroline Bonafos, Marie-Carmen Monje, et
al.. Detection of the conformational changes of Discosoma red fluorescent proteins adhered on silver
nanoparticles-based nanocomposites via surface-enhanced Raman scattering. Nanotechnology,
Insti-tute of Physics, 2019, 30 (16), pp.165101. �10.1088/1361-6528/aaff79�. �hal-02060441�
OATAO is an open access repository that collects the work of Toulouse
researchers and makes it freely available over the web where possible
Any correspondence concerning this service should be sent
to the repository administrator:
tech-oatao@listes-diff.inp-toulouse.fr
This is an author’s version published in:
http
s://oatao.univ-toulouse.fr/22891
To cite this version:
Scarangella, Adriana and Soumbo, Marvine and Mlayah, Adnen
and Bonafos, Caroline and Monje, Marie-Carmen and Roques,
Christine and Marcelot, Cecile and Large, Nicolas and Dammak,
Thameur and Makasheva, Kremena Detection of the
conformational changes of Discosoma red fluorescent proteins
adhered on silver nanoparticles-based nanocomposites via
surface-enhanced Raman scattering. (2019) Nanotechnology, 30 (16).
165101. ISSN 0957-4484
Detection
of the conformational changes of
Discosoma red fluorescent proteins adhered
on
silver nanoparticles-based
nanocomposites
via surface-enhanced
Raman
scattering
Adriana
Scarangella
1,2,3,
Marvine Soumbo
1,4,
Adnen Mlayah
2,
Caroline
Bonafos
2,
Marie-Carmen Monje
4,
Christine Roques
4,
Cecile
Marcelot
2,
Nicolas Large
5,
Thameur Dammak
6and
Kremena
Makasheva
11 LAPLACE, Université de Toulouse; CNRS, UPS, INPT; 118 route de Narbonne, F-31062 Toulouse,
France
2 CEMES-CNRS; Université de Toulouse, 29 rue Jeanne Marvig, BP 94347, F-31055 Toulouse, France 3 FERMaT, Université de Toulouse; CNRS, UPS, INPT, INSA; Toulouse, France
4
LGC, Université de Toulouse; CNRS, UPS, INPT; 35 chemin des maraîchers, F-31062 Toulouse, France
5 The University of Texas at San Antonio, Department of Physics and Astronomy, One UTSA Circle, San
Antonio, TX 78249, United States of America
6 Laboratoire de Physique Appliquée, Faculté des Sciences, Université de Sfax, BP 802, 3018 Sfax, Tunisia
E-mail:kremena.makasheva@laplace.univ-tlse.fr
Abstract
Description of the relationship between protein structure and function remains a primary focus in molecular biology, biochemistry, protein engineering and bioelectronics. Moreover, the investigation of the protein conformational changes after adhesion and dehydration is of importance to tackle problems related to the interaction of proteins with solid surfaces. In this paper the conformational changes of wild-type Discosoma recombinant red fluorescent proteins (DsRed) adhered on silver nanoparticles (AgNPs)-based nanocomposites are explored via surface-enhanced Raman scattering (SERS). Originality in the present approach is to work on dehydrated DsRed thin protein layers in link with natural conditions during drying. To enable the SERS effect, plasmonic substrates consisting of a single layer of AgNPs encapsulated by an ultra-thin silica cover layer were elaborated by plasma process. The achieved enhancement of the electromagnetic field in the vicinity of the AgNPs is as high as 105. This very strong
enhancement factor allowed detecting Raman signals from discontinuous layers of DsRed issued from solution with protein concentration of only 80 nM. Three different conformations of the DsRed proteins after adhesion and dehydration on the plasmonic substrates were identified. It was found that the DsRed chromophore structure of the adsorbed proteins undergoes optically assisted chemical transformations when interacting with the optical beam, which leads to reversible transitions between the three different conformations. The proposed time-evolution scenario endorses the dynamical character of the relationship between protein structure and function. It also confirms that the conformational changes of proteins with strong internal coherence, like DsRed proteins, are reversible.
Keywords: silver nanoparticles, plasma deposition process, plasmonic substrate, surface-enhanced Raman scattering, Discosoma red-fluorescent protein DsRed, protein conformation
1. Introduction
Proteins represent an important class of biomolecules under-pinning every reaction occurring in living organisms [1].
Recent advances in biotechnology enlarged the possibilities to explore their structural and functional properties. The poten-tial use of proteins in newly created niche applications like biosensors, bioelectronics, photosensitizers, drug screening systems, and artificial implants among others [2–7],
deter-mines the intensive research on the relationship between protein structure and function promoting the release of more than 3000 scientific articles on protein biosensors and no less than 300 articles on protein bioelectronics in the last three years only[8].
Regardless the targeted application, the current strategies on revealing the relationship between protein structure and function lead to exposure and interaction of proteins with non-biological organic and inorganic solid surfaces[9,10]. Proper
description of the underlying mechanisms will certainly unveil the fundamental protein-adsorption problem and add value to the effort of record and quantification of the conformational changes of the protein native state when interacting with solid surfaces. To that end the application of physics-based diag-nostic methods is suitable and highly demanded.
Raman spectroscopy appears the most frequently used method for the study of biological systems. However, to tackle the sensitivity limitations of Raman spectroscopy imposed by the small Raman cross sections, the biological systems should be coupled with metallic nanostructures. The scattering efficiency can be thus increased by several orders of magnitude [11] due to the activation of localized surface
plasmon resonance(LSPR) that induces strong enhancement of the electromagnetic (EM) field in the vicinity of the metallic surface. This enables to largely extend the applica-tion of Raman spectroscopy in molecular spectroscopy, bio-molecule recognition, and ultra-sensitive analysis, down to a single molecule[12–15]. Besides the sensing properties, the
strong EM enhancement can be exploited to probe protein conformational changes under photoexcitation, including real-time monitoring [16–18]. Therefore, since its discovery
in the late 70 s[19,20], the Surface-Enhanced Raman
Scat-tering(SERS) has proven to be a very powerful and reliable analytical tool for chemo- and bio-sensing[21–23], due to the
strong enhancement of the vibrational signatures of analytes in different chemical environments[12–14].
In this context, a lot of resources and time have been employed in the effort to develop plasmonic substrates based on metallic nanostructures aiming at a further increase of the EM enhancement for the realization of noninvasive, highly-sensitive, and large-scale optical sensors[17,24,25]. A large
variety of metallic nanostructure morphologies and arrange-ments (nanosphere, nanotriangles, nanodisks, nanorods,
nanocubes, etc) and different coupling geometries (dimers, trimers, arrays, etc) have been developed up to date for SERS platforms [16,26–29]. However, their conversion to
macro-scopic plasmonic substrates relies generally on the NPs volunteer arrangement on dielectric surfaces(mainly through applying chemical methods), thus often resulting in non-uniform distribution on large areas, without a well-defined control of the spacing between the metallic nanostructures and the probed molecules, high point-to-point variability, scarce reproducibility and stability under irradiation condi-tions (due to photothermal and photodegradation processes) [30]. To overcome the limitations in producing solid SERS
substrates various physical approaches, like thermal eva-poration [31], combined nanoimprint lithography-shadow
evaporation[32], gas aggregation source (GAS) [33], pulsed
laser deposition[34], low-energy ion beam synthesis [35–37],
and plasma-based deposition processes [38, 39], have been
proposed in the literature.
It is generally acknowledged that the silver nanoparticles (AgNPs) realize the best nanoscale antenna in the visible range for amplifying local electronic and vibrational signals, thus providing unique molecular information in the optical far-field regime. Indeed, compared to gold nanoparticles, the AgNPs offer the advantage of stronger plasmonic enhancement because of lower interference between intraband and interband electronic transitions [40]. Accordingly, the SERS substrates
based on AgNPs provide excellent way to study complex biological systems and in particular appear very well adapted for quantification of the conformational changes of proteins brought in contact with solid surfaces[17,18,21]. Moreover,
the use of AgNPs covers another aspect of the relationship between protein structure and function which concerns the biological activity of the AgNPs. Because of their antimicrobial properties, the AgNPs have the potential to impact human health and environment [41–45]. The biological activity of
AgNPs goes both ways, through the activity of ionic silver (Ag+) and through direct contact with the AgNPs resulting in
protein denaturation at different cell locations; specifically sensible are those enzymes of the respiratory chain and trans-port channels[46]. Therefore, there exists a recognized need to
address the relationship between protein structure and function from two distinctly different vantage points: (i) quantification of the conformational changes of proteins by using the antenna effect of AgNPs and(ii) analysis of the conformational changes of proteins induced by the AgNPs extreme chemical and bio-logical activities.
The intent of this work is to bring additional insight into the mechanisms of adsorption of proteins on solid surfaces through quantification of the conformational changes of proteins adhered on AgNPs-based nanocomposites via SERS. We focus on the wild-type Discosoma recombinant red fluorescent protein (DsRed) [47], belonging to the family of
naturally fluorescent proteins (FPs). The strong interest toward the FP family originates from their application in molecular biology as reporters of gene expression, as non-invasive markers in molecular biology and other singular events of cell activity [2]. Potential use of the FPs extends
toward biolelectronics and protein engineering for tissue regeneration, therapeutics, and nanotechnology[48–51]. The
most widely characterized member of this family is the green fluorescent protein (GFP). The lately cloned from reef coral Discosoma sp. DsRed protein possesses the longest yet reported, for a wild-type spontaneously FP, excitation and emission maxima at 558 nm and 583 nm, respectively [47].
Owing to its high fluorescence yield the red fluorescent DsRed protein has become important both as a model for understanding FPs and as a tool for biomedical research. The DsRed protein and its engineered derivatives have found broad use in cell and molecular biology including fluores-cence microscopy as a marker, fluorescence correlation spectroscopy and fluorescence activated cell sorting. Recently, the DsRed was found suitable for rational design of ultra-stable and reversible photoswitches for super-resolution imaging [52]. Moreover, it has been hypothesized that FPs
from reef-building corals operate as part of an adaptive mechanism to optically interact and to regulate the symbiotic relationship between corals and photosynthetic algae [53].
Structural rearrangements near the chromophore influence the maturation speed and brightness of the DsRed variants. It is therefore essential to examine the conformational transitions that affect the protein’s ability to transfer optical excitation energy[54].
Studies of the conformational changes of DsRed protein have been reported in the literature [55–57] but the DsRed
Raman fingerprints were investigated only by recurring to chemically synthesized model chromophores[55,56].
How-ever, the later differ from the wild-type DsRed protein for the absence of the α-helix and β-sheets that naturally surround the chromophore and for the different extensions of the conjugated π-system. The choice of chemically synthesized model chromophores is explained by the complications brought by the presence of immature green species in the solution created as a photoproduct of the red ones [55–57],
thus often resulting in an unclear or incomplete band assignment. The novelty of this work lays down the point that we work with the wild-type DsRed protein in its native state and not with DsRed model chromophore. All reported experimental studies in the literature were performed in solution. No information on the DsRed protein structural and conformational changes can be found when the DsRed pro-tein is adhered on a solid substrate and irradiated by light.
The lack of information on the above discussed issues motivated this study focusing on the investigation of the interaction of wild-type DsRed proteins with AgNPs-based plasmonic substrates. Our approach involves analysis of dehydrated DsRed protein layers in link with natural condi-tions during drying. To perform the SERS study on the conformational changes of DsRed proteins adhered on AgNPs-based nanocomposites we have elaborated, by plasma process, highly uniform and reproducible plasmonic
substrates composed of a single layer of AgNPs coated by a silica layer [38]. Focus was made on the possibility to well
control, on a large scale, the AgNPs size distribution and interparticle distances. The resulting uniformity of hot-spot distribution guarantees the reproducibility and stability of this plasmonic sensor. Subsequently, we show how the enhanced EMfield in the vicinity of the AgNPs could be employed to detect the presence and identify the conformational changes of proteins, adsorbed and adhered to the plasmonic substrate, during optical irradiation.
2. Materials and methods 2.1. Proteins
The DsRed fluorescent protein was purchased from Biovi-sion. According to the SDS-PAGE, the recombinant DsRed was at least 97% pure and in a freeze-dried form. A DsRed stock solution of 0.1 g l−1was prepared in water for injectable preparations (PPI water). Aliquots of DsRed stock solution were diluted 1–10 times into PPI water. The pH-value of the DsRed stock solution was measured to 6.6 and its stability was continuously monitored during the measurements. The assays were performed at room temperature(23 °C).
2.2. Gas precursors and substrates
The hexamethyldisiloxane (HMDSO, Si2O(CH3)6) used as
precursor in the plasma polymerization process was pur-chased from Sigma Aldrich with purity greater than 99.5% while the argon and oxygen gases were purchased from AirLiquid AlphaGaz 2 with a purity of 99.9995%. The silver target used for sputtering was more than 99.99% pure, and was purchased from Inland Europe. The quartz substrates (25×25×1 mm) were purchased from Oxford Instruments. The silicon substrates (intrinsic, resistivity R>200 Ωcm) were purchased from Sil’tronix.
2.3. Plasma deposition process for synthesis of SERS active delta-layer of AgNPs embedded in silica host matrix
The targeted AgNPs-based nanocomposites were elaborated in a plasma process that successfully combines in the same reactor silver sputtering for the deposition of AgNPs and plasma enhanced chemical vapor deposition for the deposition of the plasma silica cover layer. This approach, offers several advan-tages compared to other deposition techniques:(i) possibility to obtain metallic concentrations from a few percent up to 100%, (ii) homogeneous dispersion of the metal nanoparticles, and (iii) fine control over the size of the metal nanoparticles. The plasma was sustained in an axially-asymmetric capacitively-coupled radio-frequency (RF, f=13.56 MHz) discharge at low gas pressure (a few Pa) [58]. The RF-driven top electrode was
smaller, made of silver to bear the sputtering. The bottom electrode, which is also the substrate holder, and the walls were grounded. This RF-discharge produces axially-asymmetric plasma inducing a self-bias voltage(Vdc) on the powered
the DC voltage drop between the bulk plasma and the electrodes across the plasma sheaths connecting the driven electrode to the ground. It is at the origin of the acceleration of argon ions towards the Ag-target to achieve sputtering. The plasma beha-vior during the deposition was controlled by optical emission spectroscopy through the line ratio of a silver and an argon lines: IAg(546.6 nm)/IAr(549.6 nm). This ratio indeed gives an image of the Ag-amount in the plasma, which can be related to the deposited Ag-volume fraction [58]. Moreover, the self-bias voltage,
reflecting the plasma stability, was continuously measured. The used plasma process is suitable for large scale technology transfer and fully compatible with standard microelectronic technologies.
Prior to deposition, the quartz and/or silicon substrates covered by a 80 nm thick layer of thermal SiO2were cleaned
in Piranha solution for 2 min and then rinsed with deionized water until attaining zero conductivity. The delta-layer of AgNPs was deposited by Ag-sputtering in an Ar-discharge maintained at low gas pressure (pAr=5.2 Pa) and power
of P= 80 W. The induced self-bias voltage was of Vdc=−950 V. The sputtering time was set to ts=5 s. The
plasma silica (SiO2) cover layer embedding the AgNPs was
deposited in the same reactor in the plasma sustained in a gas mixture of argon(Ar flow: 2.8 sccm, where sccm stands for standard cubic centimeters per minute at standard temperature and pressure), HMDSO and oxygen (O2flow: 1.25 sccm) at
total gas pressure of ptot=7.68 Pa. A strong particularity of
the used plasma process which makes it original and highly efficient is the pulsed injection of the precursor. The HMDSO was introduced in the discharge by pulses with period T=5 s (T=ton+ toff) and injection time ton=3.1 s, giving an
average flow of 0.25 sccm. The injected RF power for the SiO2plasma deposition wasfixed at 120 W giving a self-bias
voltage of Vdc= −880 V. The thickness of the SiO2plasma
cover layer was controlled by the deposition time, fixed at 30 s for this study. More details about the plasma process, plasma properties and the resulting AgNPs delta layers cov-ered by plasma silica layers, in relation with their structural characterization and optical response, are provided elsewhere [38,39,58,59].
2.4. Optical and morphological characterization of the plasmonic substrates
Optical transmittance spectra were recorded using a Hewlett Packard HP8452A Diode Array Spectrophotometer in the UV–vis–NIR range (190–820 nm) to obtain the position of the AgNPs LSPR resonance.
High resolution transmission electron microscopy (HRTEM) imaging of the plasmonic substrates was per-formed using a cold field emission gun Hitachi HF 3300 C microscope operating at 300 kV equipped with a spherical aberration corrector. To achieve observation, specimens transparent to electrons have been prepared in accordance with the standard procedure, i.e. mechanical polishing and Ar+ion milling in both cross-section and plan view con fig-urations. The former configuration is used for the accurate measurement of the position of AgNPs with respect to the
surface while the later allows measurement of the total Ag-amount contained within the NPs (deduced from their size-distribution and surface density).
2.5. Synthesis of dehydrated DsRed thin layers on the plasmonic substrates
DsRed thin protein layers deposited on the AgNPs-based nanocomposites surfaces were realized by a dip coating pro-cess. The substrates, with a fixed superficial area of 1×1 cm2, were immersed for 1 h in 1.0 ml protein solutions. After immersion, the samples were rinsed with PPI water to remove the non-adhered proteins and left dehydrating at room temperature and atmospheric pressure. Thin DsRed dehy-drated layers resulting from different DsRed solution con-centrations, starting from 0.01 g l−1(80 nM) up to the highest possible in this study one of 0.1 g l−1 (800 nM) were investigated.
2.6. Optical characterization of the dehydrated DsRed protein layers
The thickness and the optical parameters(refractive index and extinction coefficient) of the dehydrated DsRed protein layers deposited on quartz substrates were determined by spectro-scopic ellipsometry. A Semilab ellipsometer SE-2000 with a rotating polarizer and afixed analyzer was used in the spectral range 250–850 nm. The simulations of the recorded spectra were performed with spectroscopic ellipsometry analyzer software provided by Semilab[60]. Lorentz method was used
in the procedure as the DsRed is a weakly absorbing pro-tein[61].
2.7. Photoluminescence(PL) and Raman measurements The confocal imaging and spectroscopy of the elastically scattered light and of the Raman scattering were carried out using a Jobin-Yvon XploRa setup. In all PL and Raman measurements, the laser beam was focused through a 50×objective to spot of size of 2 μm2 on the freshly deposited protein layers. The PL was excited at 532 nm close to resonance with the DsRed absorption band. The Raman scattering was excited at 532, 638, and 785 nm. In order to avoid possible degradation of the proteins due to laser heat-ing, the incident intensity was limited to 1% of its maximum value(of around 0.15 mW for the 532 and 638 nm excitations and 0.8 mW for the 785 nm excitation). The Raman spectra were recorded with an accumulation time of 30 s.
2.8. Electrodynamic modeling of the AgNPs-based nanocomposites
FDTD method[62] was used to calculate the plasmonic
prop-erties(far- and near-field) of the SERS substrates. The calcu-lations were performed by using geometrical parameters based on data extracted from the TEM images. The SERS substrates were simulated as composed of a bimodal NP distribution: (i) large ellipsoidal AgNPs with major axis of 19.6 nm, minor axis of 16.7 nm, density of 0.8×10¹¹NPs cm−2 and an
average interparticle distance of 5.5 nm, and(ii) small spherical AgNPs with size distribution of 3.0±2.0 nm and density of 2.0×10¹¹NPs cm−2. The AgNPs were taken embedded at 5.0 nm underneath the SiO2 cover layer. The dielectric
per-mittivities tabulated by Palik have been used for Ag[63] and
SiO2[64]. We modeled a 2×2 μm2AgNPs distribution and
used periodic boundary conditions in the x- and y-directions to model an infinite substrate (perfectly-matched layers were taken along the z-direction). To accurately discretize the entire nanoparticle distribution the FDTD mesh size wasfixed at 1 nm in all calculations. In order to investigate the optical properties of the NP distributions, wefirst calculate the absorption cross-section and near-field response at 532 nm. Calculations were performed with linearly-polarized light at normal and oblique (30°) incidence where the oblique incidence uses the broadband fixed angle source technique [65]. Convergence was obtained
for a propagation time of ∼90 fs. In order to estimate the experimental SERS EM enhancement, we calculated the fourth power of the electric near-field (∣E E0∣ )4 [28–30].
2.9. Electronic structure calculations of the DsRed chromophore
The density functional theory (DFT/B3LYP) implemented into Gaussian 03 software package[66], was used to optimize
the molecular geometry and to calculate the vibration mode frequencies of the DsRed chromophore. In these calculations, the used basis set(6–31 G**) represents an extended base of the split-valence type. All calculations of the molecular geo-metries converged to a true energy minimum attested by the lack of vibrational frequencies. The assignment of the vibration modes was based on the visual inspection of the atomic displacements animated by graphical MOLDEN software[67]. The Raman spectra were plotted using a
Lor-entzian line shape with a full width at half maximum (FWHM) of 10 cm−1. The visualization of the atom
dis-placements in a given vibrational mode was made by using the MOLDEN software.
3. Results and discussion
3.1. AgNPs-based plasmonic substrates: structure and morphology
The specific architecture of plasmonic substrates used in the current study is based on a single layer of AgNPs deposited onto quartz substrates and coated by a plasma silica layer at a controlled nanometric distance from the free surface. Having the AgNPs not directly exposed to the surrounding environ-ment presents several advantages. First, the silica cover layer acts as a barrier layer protecting the metallic silver against quick disappearance and/or premature aging, mainly through fast oxidation [68]. Second, it properly avoids the direct
contact(i.e. chemisorption) of proteins with the AgNPs-active surface. This precaution limits the biological activity of AgNPs and prevents the DsRed proteins from denaturation and/or unfolding processes potentially related to the toxicity
of AgNPs [69,70]. In addition, due to the presence of thin
silica as dielectric spacer between the metal surface and the molecules (i.e. proteins) under study, the SERS is supplied mainly by the EM mechanism (based on ‘plasmon reso-nance’), strongly limiting the chemical one (based on ‘charge transfer’) [71].
The morphological analysis of the AgNPs-based plas-monic substrates has been performed by transmission electron microscopy (TEM). From the TEM cross-section views in figure 1(a), one can clearly notice that the AgNPs form a
planar single layer. It is also possible to appreciate the thin silica cover layer that conformably envelops the AgNPs. Its thickness of 5.5 nm is compatible with the plasmonic near-field range [72], thus allowing to keep the SERS effect
effi-cient. Moreover, from both the cross-section(figure1(a)) and
plan view (figure1(b)) images one can see that most of the
nanoparticles have prolate spheroidal shape. Their major axes are randomly-oriented on the substrate in the plane of the AgNPs delta-layer. Smaller nanoparticles are also detectable. They correspond to NPs issued from lately formed in the plasma Ag-clusters as the nucleation phase of AgNPs starts immediately after the Ag-atoms sputtering in the plasma gas-phase. The subsequent phases of aggregation and growth of AgNPs in the plasma lead to formation of larger in size AgNPs. Once the Ag-atoms/AgNPs reach the substrate sur-face their size increases through sursur-face growth mechanisms powered by the increased kinetic energy of the sputtered Ag-atoms, the high surface diffusion of Ag, and most likely involving Ostwald ripening. The apparent shell surrounding the AgNPs, visible in figure 1(b), corresponds to the silica
cover layer projection.
HRTEM observations(figures1(c) and (d)) show that all
the AgNPs (including the smallest ones) are polycrystalline and/or twinned. This is well explained by the AgNPs growth mechanisms in the plasma process that involve aggregation and sticking phases. The measured angles and interplanar distances (2.36, 2.04, and 1.44 Å) in the associated FFT (figure 1(e)), taken in the monocrystalline domain of the NP
(figure1(c)), perfectly fit ones of pure silver in the [110] zone
axis. The NP shown in figure 1(d) is fivefold twinned one
with the typical 2π/5 angle between each domain. Multiple twinned NP formation is, in general, favored in diamond and face-centered cubic crystals. Transition metal NPs like the AgNPs are thus ideal materials forfivefold twinning [73].
Statistical analysis performed on more than 500 AgNPs in the plan view image is reported in figure 2. The nano-particles follow a bimodal distribution in size. The smaller NPs have major axis of 5.1±1.7 nm and minor axis of 3.9±1.5 nm, while the major and minor axes of the larger NPs are 19.9±10.0 nm and 17.0±7.6 nm, respectively (figure2(a)). Information on the density of nanoparticles has
also been extracted from the plan view image. The surface density of AgNPs is estimated to 1.7×10¹¹NPs cm−2, corresponding to a covered area of 42.6%. The average edge-to-edge interparticle distance is 5.2 nm, with dispersion as large as 3.1 nm, as reported infigure2(b). The evolution in
shape of the AgNPs from spherical to prolate spheroid is well pronounced for the large AgNPs with the highest eccentricity
found ofε = 0.52. The irregular shape of some of the AgNPs, where sharp edges can be observed, alongside with the formed assemblies of AgNPs allows for creation of hot spots, thereby promoting the EMfield enhancement.
3.2. DsRed protein layers: optical properties
Here, we focus on the optical properties of thin layers of DsRed proteins, whose chromophoric structure is reported in
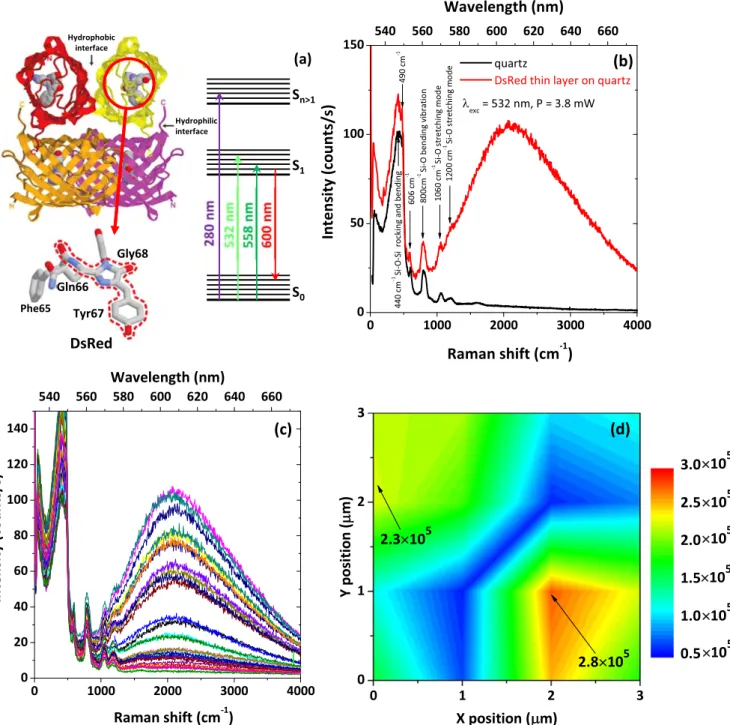
figure 3(a) together with a scheme of the main electronic
energy levels. Because of the strong interest in multicolor tagging and in fluorescence resonance energy transfer the optical properties of DsRed are widely investigated for in vivo and in vitro samples as a spectrally distinct compagnion of GFP[74]. However, very few reports on the PL properties of
nanometric layer of dehydrated DsRed proteins are available [61, 75]. Thus, before going deeper into the study of the
DsRed conformational changes through SERS effect we have Figure 1.(a) Bright-field cross-sectional TEM image showing the single layer of AgNPs with their conformal 5.5 nm thick silica cover layer; (b) bright-field plan-view TEM image of the AgNPs; (c) HRTEM image of individual polycrystalline and (d) fivefold twinned NP; (e) FFT associated to the square region drawn in the HRTEM image. The measured distances and angles perfectly match the reciprocal space of Ag oriented in[110] zone axis.
investigated the optical properties of a thin DsRed layer adhered and dehydrated on top of a pristine quartz substrate. The DsRed protein layer was deposited by dip coating pro-cess. For the PL study the DsRed layer was obtained from protein concentration in solution of 0.1 g l−1 (i.e. 800 nM). The resulting protein layer is thin, discontinuous, and com-posed mainly of DsRed monomers with some residues of dimers and tetramers. It has effective thickness of 3.7 nm and covers 35% of the substrate surface, as measured by spec-troscopic ellipsometry[61].
The DsRed layer was irradiated with a 532 nm laser in resonance with the S0to S1transition(see energy diagram in
figure 3(a)). Under this excitation, we observe a broad PL
signal at about 600 nm, overlapped with sharp peaks at lower wavelengths (figure 3(b)). The PL band is ascribed to the
recombination from the S1level to the ground state. The
red-shift from the PL emission of DsRed in solutions(583 nm) [47] is most likely due to modification/re-organization of the
protein structure after adsorption onto the solid surface and subsequent dehydration. The presence of strong PL emission from the DsRed protein layer after dehydration indicates the absence of denaturation and unfolding processes of the pro-teins secondary structure or damages in the chromophore after interaction with the substrate solid surface. PL mapping over a 3×3 μm2region with step size of 0.5μm has also been recorded to investigate the protein distribution on the surface. Some of the acquired PL spectra, as well as a map of the integrated PL intensity are reported infigures 3(c) and (d).
Since the PL intensity is generally proportional to the number of emitting centers[76], and assuming that the non-radiative
de-excitation mechanisms are the same for each protein in the layer, the variation in the PL intensity(figures3(c) and (d))
can be considered to reflect the morphology of the DsRed thin layer. Indeed, the non-uniform PL emission is in agreement
with ellipsometry measurements showing formation of a discontinuous protein layer[61], for the studied case (protein
concentration in solution 0.1 g l−1). Another essential aspect is that despite the clear observation of PL emission from the discontinuous DsRed layer, no Raman signal related to the proteins was detected. The only sharp peaks visible in figures 3(b) and (c) are due to the Raman scattering by the
optical vibrational modes of the quartz substrate [77].
3.3. Interaction of DsRed proteins with AgNPs-based plasmonic substrates: optical response and SERS effect The optical response of the AgNPs-based plasmonic sub-strates was measured by UV-visible transmission spectrosc-opy(figure 4(a), blue line). The LSPR peak of the AgNPs is
observed at 454 nm with a FWHM of 110 nm. It is red-shifted compared to the LSPR of a single spherical AgNP in silica (410 nm, see supplementary information, available online at
stacks.iop.org/NANO/30/165101/mmedia), because of the
elongated shape of the AgNPs and their mutual EM interac-tion [40, 78]. The absorption spectrum calculated by
finite-difference time-domain (FDTD) [62] method for an infinite
2D-distribution of ellipsoidal NPs with size, shape, and spa-tial distributions in accordance with the experimentally obtained AgNPs is shown on figure 4(a), black line. The
absorption peak of the calculated spectrum occurs at slightly shorter wavelengths (420 nm) as compared to the exper-imental LSPR(figure4(a), blue line). Given the large number
of parameters taken into account in the calculations this dif-ference is most likely due to non-uniformity in size, irregu-larity in shape and AgNP density variations. The localized surface plasmon band of the ellipsoidal-NP distribution results from the spectral overlap of the multiple LSPRs coming from randomly-oriented ellipsoids and their size distribution. It can also be noticed that the substrates exhibit Figure 2.Statistical analysis performed on more than 500 AgNPs on the plan view image:(a) minor and major axes of the AgNPs. The continuous lines show the corresponding Gaussianfits; (b) edge-to-edge distance between the AgNPs and the corresponding Gaussian fit.
lower intensity LSPRs above 700 nm resulting from strongly interacting dimers, trimers, and other NP clusters.
To the best of our knowledge, the Raman scattering properties of DsRed in its native state have not been inves-tigated. Density Functional Theory(DFT) calculations of the electronic and Raman scattering properties have been per-formed for DsRed model chromophores[55] and the
calcu-lated Raman spectra were compared with those measured under non-resonant excitation (752 nm), from chemically synthesized DsRed chromophores in solution[56]. Moreover,
the structure of the model chromophore is slightly different from that of the recently cloned naturally fluorescent
wild-type DsRed protein, resulting in shifted excitation and emis-sion bands, as well as in much lower optical quantum yields [56]. Besides, no information is reported on the protein
conformational changes when adhered on solid substrates or under illumination. The SERS-active substrates used in this study are suitable for investigation of adhesion of molecules (proteins) as they allow for significant enhancement of the Raman signatures of very small quantities. Indeed, the plas-monic resonance of the AgNPs-based substrates and the absorption band of the DsRed protein (figure 4(a), red line)
match rather well, which provides additional enhancement through a resonant SERS effect. To confirm the presence of Figure 3.(a) Schematic representation of the tetrameric DsRed fluorescent protein, its chromophoric structure and a scheme of the main electronic energy levels,(b) Raman spectra recorded on a pristine quartz substrate (black line) and on a thin layer of DsRed proteins adsorbed on quartz substrate(red line), (c) PL spectra of the DsRed thin layer acquired at different points on the DsRed thin layer, and (d) PL mapping over a 3×3 μm2squire of the DsRed layer recorded with a step size of 0.5μm.
Figure 4.(a) Absorption spectra of the AgNPs-based plasmonic substrate, experimental (blue line) and theoretical (black line), and of the DsRed protein(red line), (b) Raman spectra recorded on a thin layer of DsRed proteins adsorbed on the AgNPs-based plasmonic substrate for different excitation wavelength,(c) ∣E E0∣4calculated at 532 nm for four different cross-sections taken along the polarization direction(i.e. x-direction). The white dashed line highlights the free surface of the silica layer, (d) ∣E E0∣4spatial distribution calculated at 532 nm in the (x, y) plane. The Raman spectra were normalized to the same accumulation time and laser power, in order to compare their relative intensities, and(e) integrated Raman intensity for DsRed-thin layers deposited from solution with DsRed concentrations in the range 80–800 nM. The vertical bars show the deviations in the integrated Raman intensity for the protein layers issued from each DsRed concentration in solution.
efficient SERS, the samples were excited at three wave-lengths: 532, 638, and 785 nm(figure4(b)). Raman peaks are
clearly observed only for the lowest excitation wavelength i.e. close to resonance with both the AgNPs LSPR and the DsRed absorption band. This resonant Raman scattering behavior was consistently noted for all the investigated samples, hence confirming the role of the AgNPs at the origin of the SERS signal of the adhered protein layer. Experimental evaluation of the SERS enhancement factor of our plasmonic substrates was not possible as without AgNPs no Raman signal from DsRed protein layers could be detected(figure3(b)), even for
the layer resulting from the highest concentration of proteins in solution(800 nM).
In order to investigate the EM near-field enhancement of the Raman scattering in our samples, we performed FDTD numerical simulations. The simulations give an idea on the plasmonic enhancement factor of the Raman scattering but more importantly they allow determining the spatial dis-tribution of the plasmonic field and its dependence on the nanoparticles morphology, interaction and location with respect to the sample surface. Figures 4(c) and (d) display
cross-section and plan view maps of the fourth power ∣E E0∣4 of the calculated near-field at 532 nm wavelength, which gives the magnitude of the SERS EM enhancement factor [28–30]. It can be noticed that the hot spots form in the gap
regions between the AgNPs(figure 4(c)) and are uniformly
distributed across the substrate (figure 4(d)). With the
exception of a few very intense hot spots reaching enhance-ment factors of 106, the enhancement factor at 532 nm typi-cally lays at 105 with an averaged value of 2.0×10⁴ per nanoparticle. Although most of the EM field is enhanced at the AgNP-SiO2 interface, the near-field does penetrate the
thin silica layer, spilling out at the free surface. This phenomenon, which has been observed in the case of Ag–Cu2O core–shell NPs [79], occurs when the thickness of
the dielectric cover(i.e. SiO2) is comparable to the near-field
characteristic decay length. This near-field spill-out explains the observed SERS effect. For larger silica thicknesses, the near-field would then be exclusively re-localized at the metallic surface, canceling any SERS effect.
In order to probe the performance of our AgNPs sub-strates in terms of SERS efficiency, we have acquired Raman data for several DsRed protein layers deposited with con-centrations in solution spanning from 80 to 800 nM. The spectrally integrated Raman intensities measured for different DsRed concentrations are reported in figure 4(e). The
inte-grated Raman intensity increases linearly with increasing DsRed concentration in solution, as expected. However, due to the formation of non-uniform and inhomogeneous proteins layers, the Raman scattering intensity stronglyfluctuates from point-to-point thus leading to a quite important scattering of the measured Raman intensity for a given protein layer. Nevertheless, the observed in figure 4(e) linear behavior
confirms that the measured Raman signal is due to the DsRed proteins and not to some contaminants that could have adhered to the surface during manipulation of the samples.
The departure of the SERS measurements from linear trend for the protein layer resulting from 80 nM concentration in solution is due to localfluctuations of the DsRed protein. It is worth underlining that, for the lowest concentration (0.01 g l−1, 80 nM) the protein layer is organized in rod-like
structures of isolated DsRed monomers with small residues of tetramers spread over the substrate at a distance from each other of more than 15μm [61]. Presence of DsRed tetramers
is actually at the origin of the departure of the Raman intensity from linear trend for the protein layer deposited with 80 nM concentration in solution.
Although 80 nM is the lowest protein concentration used to obtain a protein layer for the current study, it cannot be defined as the lowest detection limit for the plasmonic sub-strates. The possibility to detect very intense Raman signal from proteins deposited at 80 nM suggests that this value could be decreased. However, the nature of the protein (the DsRed is initially under tetrameric form in the solution and transforms into monomers when interacting with the solid surface of the plasmonic substrate[61]) and the morphology
of the obtained dehydrated layer should be considered if searching for the lowest detection limit.
During the experiments, we have systematically observed strongfluctuations of the Raman scattering intensities: spectral features which are very weak or absent may suddenly become very intense(several thousand of counts/s), whereas other fea-tures may strongly fluctuate before they fade away. This phenomenon is well-known as SERS blinking[80] and is typical
of Raman scattering by a small number of molecules located at plasmonic hot spots. It is usually observed in single molecule SERS experiments [81, 82]. Because of blinking the SERS
intensity is very difficult to estimate with precision. Indeed, time averaging may lead to random SERS intensity values depending on the occurrence time and the duration of this phenomenon.
3.4. DsRed proteins adhered on AgNPs-based nanocomposites: assignment of the SERS features
Aiming at an assignment of the measured Raman features to the vibration modes of the proteins, we have performed cal-culations based on the DFT which allows for predicting the vibration eigenmodes of the proteins (see materials and methods section). To generate the corresponding Raman activity DFT calculations make use of the molecular polar-izability modulation which is appropriate only for non-reso-nant Raman scattering experiments. It does not account for the plasmonic resonance effect, and therefore cannot predict the SERS intensities. In addition, because of the SERS blinking, the intensity of the Raman features strongly fluc-tuates, which is another reason for the discrepancy between the measured SERS intensities and the DFT-calculated Raman activities. Nevertheless, DFT calculations are very useful for assignment of the observed Raman features based on their measured vibrational frequencies [15,80].
Since the SERS blinking is often associated with mole-cular configuration fluctuations and/or photo-induced che-mical processes which may alter the molecular structure, for
the DFT calculations we have considered three different molecular configurations of the DsRed chromophore (labeled hereafter A, B, and C; see supplementary information) with very close energy minima. In configuration A, with a mini-mum energy of −1332.6434 Ha, the phenol ring carried by 67Tyr (tyrosine 67) lies nearly in the same plane as the imidazolinone ring formed by 68Gly (glycine 68) and the same 67Tyr. Configuration B has a minimum energy of −1332.6511 Ha i.e. 0.2 eV below configuration A. It differs from configuration A for the perpendicular positioning of the phenol ring with respect to the imidazolinone one. In con-figuration C, the C=N bond of the imidazolinone ring is broken, completely altering in this way the chromophore structure. Its minimum energy is−1332.6689 Ha i.e. 0.68 eV below configuration A. By comparing the Raman spectra calculated for configurations A, B and C one can understand of how the molecular configuration fluctuations, or in our case the protein conformational changes, may impact the Raman peak intensities and give rise to Raman blinking in exper-imental situations. However, it is important to underline that the interpretation of the SERS blinking phenomenon is still under debate in the SERS community and vibrational fre-quencyfluctuations were reported and exploited in very few works [80]. The main issue lies in the modeling of realistic
situations (interaction of large molecules physically or che-mically adsorbed on a surface) at the atomic scale using quantum chemistry techniques. Moreover, since SERS blinking is a photo-thermo-induced phenomenon, there is a need of time-dependent simulation techniques capable of modeling excited states of large molecule ensemble. It is worth to underline that in most of the situations where SERS blinking was observed, the molecules under study were either tightly bounded to or coated on the metal nanoparticle. In our case, the very thin SiO2cover layer(thickness of 5.5 nm) acts
as a barrier against direct interaction between the adsorbed proteins at the sample surface and the AgNPs underneath the sample surface. Hence, the SERS blinking is solely due to photo-induced configuration fluctuations and not to the molecular adsorption/desorption process at the metal nano-particle surface.
The assignment of the Raman features observed in SERS spectra is not straightforward because of the strong blinking of the Raman signal mentioned above. Therefore, to extract general trends from the Raman signature of the protein, we have analyzed a large set of experimental data (over 300 Raman spectra) acquired from DsRed proteins located at different points on the samples. The spectra presented and discussed in this section are representative of each one of the simulated configurations. We can affirm that 70% of the data are totally assignable to one of the three simulated con fig-urations. The remaining 30% of the recorded spectra could not be fully ascribed to any of the three configurations for the following reasons:(i) the Raman signal is not observed in all scanned points. This is due to the fact that the studied DsRed protein layers are discontinuous, even for the layer resulting from the highest protein concentration in solution: 0.1 g l−1 (800 nM). As given in section3.2it covers only one third of the sample surface. There are no proteins at all in some
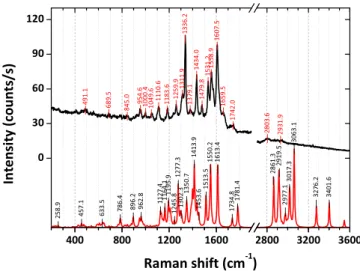
regions on the sample. So, most of the remaining 30% of the spectra displayed no signal i.e. only background signal due to AgNPs, taken as reference, was detected and(ii) in very few regions, we have observed the co-presence of different con-figurations. These spectra were not considered as no clear identification of the protein’s conformation can be achieved. Comparison between the SERS spectrum of the DsRed measured for a dehydrated protein layer deposited from pro-tein concentration in solution of 0.05 g l−1 (400 nM) and DFT-simulated Raman spectrum of the DsRed chromophore in configuration A is reported in figure 5. Three distinct spectral regions, 200–1000 cm−1, 1000–1800 cm−1, and 2700–3500 cm−1, can be identified (figure 5). All the
observed Raman features below 1000 cm−1belong to angular (in- and out-of-plane) deformations of the imidazolinone and the phenol rings carrying the three amino-acids (Gln–Tyr– Gly) that compose the DsRed chromophore and to vibrations of the entire protein [83, 84]. This assignment is also
sup-ported by previous reports on the Raman scattering properties of the GFP protein [85]. The presence of glycine in the
polypeptide chain has important consequences for the overall structure of DsRed proteins. Due to the lack of any significant functional group the glycine possesses little intrinsic chemical reactivity. Thus the absence of a large side chain results in conformational flexibility about the N–C and C–C bonds in the polypeptide chain[1]. Consequently, this spectral region
of the Raman spectra holds information on the secondary structure of the DsRed. The spectral range 1000–1800 cm−1, where the most intense Raman features are observed, is cor-related to the vibration modes of the phenol and imidazoli-none rings as well as to the C=C double bond stretching vibrations (1500–1800 cm−1). The Raman features barely visible in the 2800–3500 cm−1 range are related to C–H, N–H, and O–H stretching modes. They are particularly sen-sitive to the molecule chemical environment because of the reactivity of the hydrogen atom[85]. Detailed assignment of
Figure 5.SERS spectrum of DsRed dehydrated protein layer deposited from solution with DsRed concentration of 0.05 g l−1 (400 nM) (black line) and DFT-simulated Raman spectrum of the DsRed chromophore in configuration A (red line). The identified Raman features are also shown.
the observed Raman features based on the DFT calculations and on published works[83–87] is given in the
supplemen-tary information.
It is interesting to compare the measured SERS peaks of the adhered wild-type DsRed proteins with the Raman data reported for three DsRed model chromo-phores: 4-Hydroxybenzylidene-1, 2-dimethylimidazolinone (HBDI), 4-hydroxybenzylidene-1-methyl-2-propenyl-imi-dazolinone(HBMPI) and 4-hydroxybenzylidene-1-methyl-2-penta-1, 3-dien-1-yl-imidazolinone (HBMPDI) [56].
These model chromophores have been synthetized and investigated aiming at an identification of the chromophore formation mechanisms responsible for the strong red-shift of the PL emission. They differ from the wild-type DsRed proteins for the absence of the α-helix and β-sheets that naturally surround the chromophore and for the different extensions of the conjugated π-system, that is partially responsible for the red-shifted spectroscopic properties of DsRed when compared to GFP [56, 88–91]. Therefore, the
differences between the Raman feature frequencies observed in wild-type DsRed proteins and the model chromophores HBDI, HBMPI and HBMPDI can be due either to the different extensions of the conjugatedπ-system or to the chromophore environment that influences the molecular structure [87].
Although most of the observed Raman features in the SERS spectra belong to the DsRed model chromophores, there are additional Raman peaks that cannot be ascribed to the later, no matter the configuration considered by the DFT simulations. These additional Raman peaks can be instead attributed to the reminder of the protein i.e. the protein secondary structure, which is not in resonance with the used excitation wavelength. Specifically, the peak at around 1660 cm−1, well visible in the protein spectrum offigure 5, can be assigned to the amide I vibration mode of the protein(mostly coming from the protein α-helices), as already reported for wild-type GFP [87]. This
agrees with the Fourier transform infrared data analysis per-formed on the same dehydrated DsRed protein layers[61,75].
The peak at 1050 cm−1can be assigned to the aromatic side-chain mode of the protein, while the additional weaker peaks in the range 1200–1400 cm−1range can be related to the amide III vibration modes of the protein (giving complementary structural information on the protein structure) [87]. Finally,
the peak observed at 1530 cm−1has contributions coming from the proteins amide II band [61, 75] (linked mainly to the
protein β-sheets) although it appears broader and shifted towards higher wavenumbers when compared to the related C=N stretching of the imidazolinone ring (1513 cm−1) on the DFT-simulated spectrum.
3.5. DsRed proteins adhered on AgNPs-based
nanocomposites: conformational changes and temporal evolution
Most of the Raman spectra acquired from different points of the sample surface and for the different investigated DsRed layers are well accounted for by the DFT simulations per-formed for the DsRed chromophore in configuration A. There exists however Raman signatures which are not in line with
configuration A. The DFT simulations performed in two other configurations, namely B and C, appear very useful to investigate whether the adsorbed and dehydrated DsRed proteins can be stabilized in other conformational (config-uration B) and/or chemical forms (configuration C).
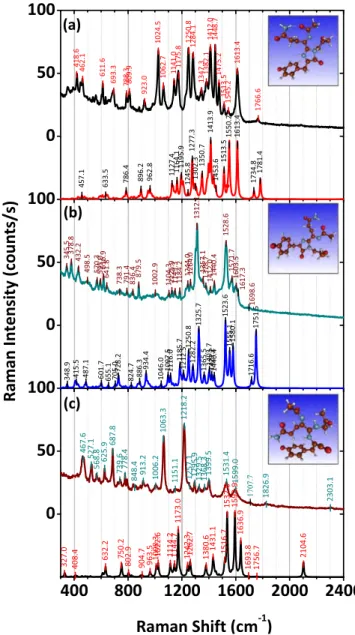
The SERS spectra extracted from systematic mapping of the DsRed dehydrated layer (concentration in solution of 0.05 g l−1, i.e. 400 nM) are presented in figure 6. These spectra match rather well the DFT-simulated Raman spectra of the three considered configurations, reported in the same graph. Detailed description of the observed molecular vibrations, including those related to the three amino-acids (Gln–Tyr–Gly) [84] present in the peptide sequence of DsRed
Figure 6.Experimentally recorded SERS spectra(upper spectra) of DsRed dehydrated protein layer deposited from solution with DsRed concentration of 0.05 g l−1(400 nM) and DFT-simulated Raman spectra(lower spectra) of the DsRed chromophore in three different configurations: (a) configuration A, (b) configuration B and (c) configuration C. The Raman spectra were recorded with an accumulation time of 30 s. Images of the three identified
conformations are shown in insets for the corresponding con figura-tion A, B and C.
and the related band assignment are reported in the supple-mentary information. Configurations A and B differ from each other only for the relative positioning of the imidazoli-none and phenol rings(the latter is perpendicular to the for-mer in configuration B), resulting in a shift of the frequency of the main C=C double bond stretching vibrations (1500–1800 cm−1). On the contrary, the configuration C
presents a broken C=N bond of the imidazolinone ring, which strongly impact its vibration modes and influences those of the phenol ring. The presence of this broken con-figuration C is evidenced in the Raman spectrum in figure6
through the decrease of the Raman intensities of most of the spectral features observed in the 1200–1600 cm−1range and through the appearance of features between 2000 and 2500 cm−1(even though with small intensity). All these dif-ferences make the broken molecule (configuration C) distin-guishable from the two other stable configurations only due to its SERSfingerprint.
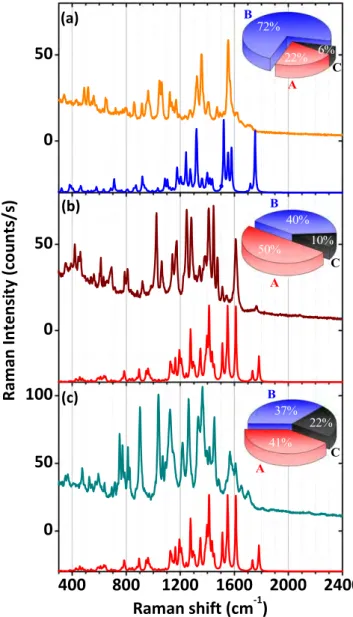
Furthermore, the population distribution of DsRed pro-teins stabilized on the substrate was analyzed as a function of the DsRed concentration in solution. Figure7 reports exper-imental and simulated spectra of the most frequently observed configuration for three protein concentrations: 0.01 g l−1 (80 nM, figure 7(a)), 0.05 g l−1 (400 nM, figure 7(b)) and
0.1 g l−1 (800 nM, figure 7(a)), alongside with the protein
population distributions in the insets. DsRed proteins adhered on the surface and stabilized in configuration B predominate significantly (72%) for the layer resulting from the lowest DsRed concentration in solution(80 nM) (inset in figure7(a)).
The contributions of the different configurations evolve with increasing the DsRed concentration. In the layers issued from protein concentration in solution higher than 400 nM, the DsRed proteins stabilize mainly in configurations A and B, with majority of configuration A. For example, the estimation gives that configuration A is present at 50%, configuration B at 40% and configuration C at 10% of the analyzed spectra for concentration of 0.05 g l−1(400 nM) displayed in figure7(b).
Globally, the quantity of the proteins displaying configuration C increases as a function of the DsRed concentration in solution(from 6% up to 22% starting from the lowest DsRed concentration). This latter aspect could be due to the presence of different photo-induced interaction mechanisms between the DsRed proteins and the AgNPs-based plasmonic substrate when the protein rearrangement occurs during the interaction of DsRed with the solid surface of the substrate. Indeed, for the protein layer resulting from the lowest concentration the signal is likely given by DsRed isolated single proteins under monomer form, while for the DsRed layers deposited at higher concentrations either DsRed proteins under monomer and tetrameric form or closely situated monomers and/or dimers can contribute. The different morphologies of the protein layer can thus explain the different population dis-tributions detected via the SERS signal. The optical dipolar coupling between adjacent chromophore sites, which is characteristic for the DsRed proteins, becomes stronger when packed monomers, dimers or tetramers are present, resulting
in stronger photo-induced interactions, highest optical absorption and thus increased modifications in the protein conformation.
To complete our analysis and better support the above given findings, we have investigated the temporal evolution of the SERS intensity of the DsRed proteins on the time-scale of few minutes. As mentioned above, conformational fluc-tuations of the DsRed proteins and/or chemical processes altering their molecular structure can be at the origin of the blinking of Raman signal. Indeed, under laser irradiation, because of the plasmonic induced light absorption by HOMO-to-LUMO transitions, the DsRed proteins undergo some structural changes, losing temporary or permanently their conformation, which in turn results in fluctuations of Figure 7.Experimentally recorded SERS spectra(upper spectra) and DFT-simulated Raman spectra(lower spectra) of DsRed dehydrated protein layers deposited from solution with(a) 0.01 g l−1(80 nM), (b) 0.05 g l−1(400 nM) and (c) 0.1 g l−1(800 nM) DsRed
concentrations. The Raman spectra were recorded with an accumulation time of 30 s. In the insets, pie charts representing the DsRed population distributions in configurations A, B and C, for each protein concentration, are reported.
their Raman signatures. To illustrate the time-dependent character of the conformational changes of DsRed proteins, some of the most significant Raman spectra are reported in figure8.
Shortly after illumination a strong decrease of the Raman spectrum intensity is observed(figure8(a)). It is accompanied
by change in the intensity of some of the characteristic Raman peaks. In time this event is followed by appearance of new Raman peaks at higher wavenumbers(figure8(b)), which are
ascribed to the stretching vibration of the broken C=N bonds in the DsRed chromophore’s imidazolinone ring, already discussed above. It may appear that the experimental spec-trum is a mixture of B and C configurations but the presence of a very intense peak at 1950 cm−1 determines the C
configuration as predominant. This observation reveals a time-dependent transition in the protein structure from con-figuration B to concon-figuration C. Such processes can be photo-induced since the molecules are submitted to intense illumi-nation by the probe light [92–94]. For larger elapsed time
(after 8 min) the proteins are stabilized back to configuration B(figure8(c)). An intense peak can be noticed at 1595 cm−1
in relation with the transitory state of the proteins, i.e. to the chemical transformations of the DsRed structure.
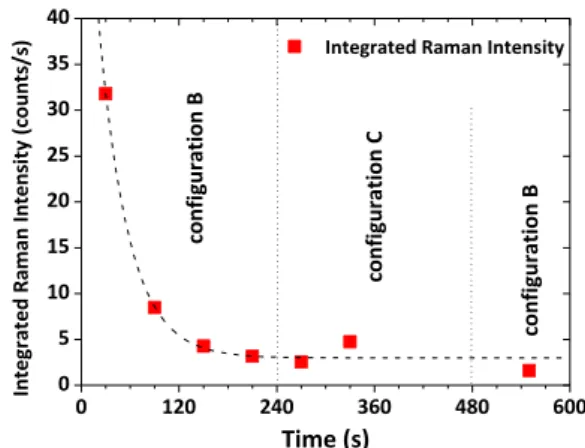
The temporal evolution of the spectrally integrated Raman intensities after subtraction of the background signal is reported in figure 9. One can notice the strong fourfold reduction of the Raman intensity during the first 60 s. This transient evolution is followed by stabilization of the DsRed proteins in configuration B. In the next four minutes, the observed Raman spectra point to protein stabilization in configuration C, followed by a return back to the initial configuration B.
Without loss of generality the temporal evolution of the SERS signal of DsRed proteins can be explained as follows: upon irradiation, and because of the large optical absorption of the DsRed proteins, the laser induced heating leads to desorption of some adhered DsRed proteins, thus causing the initial drop of the SERS signal (figure 8(a)). Then, the
chromophore’s structure of the still adsorbed proteins undergoes optically assisted chemical transformation pro-cesses which lead to the protein transient stabilization in configuration C (figure 8(b)). Finally, either some of the
desorbed proteins re-adsorb on the plasmonic substrate or the still adhered onesflip back to their initial configuration, even though with a lower SERS intensity(figure8(c)). Such
photo-induced desorption/re-adsorption process have already been discussed in the literature[80]. Under non-resonant excitation
the SERS signal and its blinking disappear(figure4(b)). The
observed SERS measurements here are resonant with the HOMO-LUMO transition of the proteins which means that a protein initially settled in configuration C or B, may relax back to a different metastable configuration thus leading to configuration fluctuations and SERS blinking. The photon Figure 8.Time-dependent character of the conformational changes
of DsRed proteins. Experimentally recorded SERS spectra(upper spectra) and DFT-simulated Raman spectra (lower spectra) of the DsRed chromophore in time:(a) t=30 s and 150 s, (b) t=270 s and 330 s and(c) t=550 s. The Raman spectra were recorded with an accumulation time of 30 s. For this study, the DsRed layer was deposited from the highest available DsRed concentration in solution (0.1 g l−1or 800 nM).
Figure 9.Temporal evolution of the spectrally integrated Raman intensities after substraction of the background signal. The spectra were acquired with 30 s accumulation time. DsRed thin layer deposited from solution with DsRed concentration of 0.1 g l−1 (800 nM).
energy used for SERS measurements is 2.33 eV, so it is high enough to induce fluctuations from C (energetically more stable) to B configuration. Further studies are required to fully elucidate the origin of the SERS signal and its temporal fluctuations, a subject still highly debated in the SERS com-munity. In our AgNPs-based plasmonic substrates, the 5.5 nm thick SiO2shell(figure 1(a)) acts as a barrier against charge
tunneling and transfer between the metal AgNPs and the adhered DsRed proteins. However, excitation transfer due to the near-field interaction between the nanoparticle surface plasmons and the HOMO-to-LUMO transitions of the pro-teins is likely to take place. This mechanism leads to enhanced excitation of the proteins followed by conforma-tional changes. The SERS blinking discussed here thus gives valuable information on the dynamics of the proteins adhered on the AgNPs plasmonic substrates. It reveals that the protein structure is essentially preserved although some alterations can be observed. This scenario endorses the dynamical character of the relationship between protein structure and function. It also confirms that, to some extent, the con-formational changes of proteins with strong internal coher-ence, like DsRed proteins, are reversible.
4. Conclusions
In this work we have investigated via SERS effect the response of wilde-type DsRed(an optically absorbing, natu-rally FP) thin protein layers after adsorption, interaction and dehydration of the proteins on the solid surface of AgNPs-based plasmonic substrate. To that end highly reproducible and sensitive AgNPs-based plasmonic substrates were rea-lized on large scale by a plasma deposition process that successfully combines sputtering from a silver target, to rea-lize the monolayer of AgNPs, with plasma polymerization to coat conformably the AgNPs with an ultra-thin silica layer. The monolayer of AgNPs is composed of smaller, rather spherical NPs (diameter of 5.0±1.7 nm) overlapped with larger, prolate spheroidal ones (major axis of 19.9± 10.0 nm) and it is responsible of the plasmonic effect. The ultra-thin silica cover layer, intended to protect the metallic silver against quick oxidation or premature aging, also properly avoids the direct contact(i.e. chemisorption) of the proteins with the AgNPs-active surface and maximizes the SERS EM mechanism based on‘plasmon resonance’. After electrodynamic simulation, the EM near-field enhancement (SERS EM enhancement factor) was found to be localized in proximity of the plasmonic substrate’s surface. It was found to reach values as high as 105 (surface averaged value of about 2.0×10⁴per silver nanoparticle), thus guarantying the validity of our AgNPs-based substrates as plasmonic sensors. The plas-monic systems were coupled with DsRed proteins in the form of dehydrated, thin and discontinuous mono-layers realized by dip coating process starting from DsRed stock solution of con-centrations varying between 80 and 800 nM. Intense SERS spectra for all the investigated DsRed thin layers were detected only in presence of the AgNPs-based plasmonic substrates. The Raman features were mostly ascribed to the DsRed
chromophore’s vibrational modes, as evidenced by DFT calcu-lations. However, it was evidenced that the spectral region 200–1000 cm−1holds information on the secondary structure of the DsRed proteins. The spectral range 1000–1800 cm−1 con-taining the most intensive Raman features is mainly correlated with the DsRed chromophore structure. The 2800–3500 cm−1 range is particularly sensitive to the DsRed chromophore che-mical environment, i.e. the primary and secondary structure of DsRed proteins, because of the reactivity of the hydrogen atom. The temporal evolution of the SERS intensity of the DsRed proteins on the time-scale of few minutes was also investigated. It is shown that under laser irradiation the DsRed proteins can undergo optically assisted chemical transformations resulting in structural changes and in the temporary or permanently stabili-zation of the protein in different conformations, with an eventual flip back to their initial state. This mechanism is in part responsible of the observedfluctuations of the Raman signatures. Although further studies are required to fully elucidate the rela-tionship between protein structure and function, which lays at the basis of the SERS signal and its temporalfluctuations, the results discussed here give valuable information on thin protein layers of DsRed monomers adhered on AgNPs-based plasmonic sub-strates. They reveal that the protein structure is essentially pre-served, even though some alterations can be observed during irradiation, and endorse the dynamical character of the interaction between proteins, laser beam and plasmonic surfaces.
Acknowledgments
This work was financially supported by the program IDEX Transversalité of Université de Toulouse (ANR-11-IDEX-0002-02), under project ADAGIO and the CNRS MI Inter-Instituts program, under project ND-AgNPs (2016). M. Soumbo acknowledges PhD-grant from Université de Toulouse—Région Occitanie, Toulouse, under APR 2016 project ADAGIO. This work received computational support from UTSA’s HPC cluster Shamu, operated by the Office of Information Technology.
ORCID iDs
Adriana Scarangella https: //orcid.org/0000-0001-8645-7770
Caroline Bonafos https://orcid.org/0000-0001-5140-6690
Nicolas Large https://orcid.org/0000-0002-2699-5718
Kremena Makasheva https: //orcid.org/0000-0001-6113-3593
References
[1] Whitford D 2005 Proteins: Structure and Function (Chichester: Wiley)
[2] Chudakov D, Matz M, Lukyanov S and Lukyanov K 2010 Fluorescent proteins and their applications in imaging living cells and tissues Physiol. Rev.90 1103–63