HAL Id: hal-00565353
https://hal.archives-ouvertes.fr/hal-00565353
Submitted on 11 Feb 2011
HAL is a multi-disciplinary open access
archive for the deposit and dissemination of
sci-entific research documents, whether they are
pub-lished or not. The documents may come from
teaching and research institutions in France or
abroad, or from public or private research centers.
L’archive ouverte pluridisciplinaire HAL, est
destinée au dépôt et à la diffusion de documents
scientifiques de niveau recherche, publiés ou non,
émanant des établissements d’enseignement et de
recherche français ou étrangers, des laboratoires
publics ou privés.
Thermal, optical and spectroscopic characterizations of
borate laser crystals
Marie Chavoutier, Veronique Jubera, Philippe Veber, Matias Velázquez,
Oudomsack Viraphong, Jiří Hejtmánek, Rodolphe Decourt, Jérôme Debray,
Bertrand Ménaert, Patricia Segonds, et al.
To cite this version:
Marie Chavoutier, Veronique Jubera, Philippe Veber, Matias Velázquez, Oudomsack Viraphong, et
al.. Thermal, optical and spectroscopic characterizations of borate laser crystals. Journal of Solid
State Chemistry, Elsevier, 2011, 184 (2), pp.441-446. �10.1016/j.jssc.2010.12.014�. �hal-00565353�
Thermal, optical and spectroscopic characterizations of borate laser
crystals
Chavoutier M., Jubera V., Veber P., Velazquez M., Viraphong O., Hejtmanek J., Decourt R., Debray J., Menaert B., Segonds P., Adamietz F., Rodriguez V., Manek-Hönninger, Fargues A., Descamps D., Garcia A.
Abtract : The Yb-content Li6Ln(BO3)3 (Ln: Gd, Y) solid solution has been investigated. Crystal growth has been
successful for several compositions. A 22% molar content of ytterbium ions was determined by chemical analysis (ICP). Physical properties relevant to laser operation like mechanical hardness, thermal expansion and thermal conductivity were measured on single crystals. Optical measurements, including refractive index and low temperature spectroscopy, were also performed. Finally, the effect of the Y/Gd ratio is discussed.
1. Introduction :
The development of high average power lasers providing short pulses or continuous waves requires the characterization of thermal, mechanical as well as spectroscopic properties [1]. Thermal properties play a key role in achieving high average power lasers because if the material stores too much heat during the pumping process, a lack of efficiency and stability or even fracture behaviour of the laser crystal may occur. Thus a high thermal conductivity is mandatory for such laser applications. Mechanical properties are also important with respect to thermal shock resistance as well as for shaping and tailoring the material as a laser gain medium. However, all these properties are more or less modified when doping of the host compounds with rare earth ions is performed for laser operation. For example, thermal conductivity decreases with increasing rare earth ion concentration [2]. Consequently, the thermal, mechanical and optical properties across the Yb-content Li6Ln(BO3)3 (Ln: Gd, Y; this notation is used for
Li6(Gd(1−x)Yx)0.75Yb0.25(BO3)3 compounds) solid solution have to be carefully studied if laser grade single crystals are to
be obtained.
In this paper, we report the dependence on the gadolinium/yttrium ratio of selected thermal and mechanical properties. In Yb-content Li6Ln(BO3)3 (Ln: Gd, Y), low temperature photoluminescence spectra will be presented and commented
on. These compounds crystallize in the monoclinic space group P21/c with Z=4 [3(a) and (b)]. According to the
crystallographic data, rare earth ions occupy an eightfold site; the LnO8 octahedra are connected by a common corner
along the c-axis (Fig. 1). Full solid solution from yttrium to gadolinium is observed. Yb3+ ions are the optically active species with a molar doping rate of 25%.
Note: the term “doping” is used to differentiate the introduction the optical active element from the solid solution between yttrium and gadolinium.
In this work, the compositions Li6(Gd(1−x)Yx)0.75Yb0.25(BO3)3 with x=0, 0.25, 0.5, 0.75 and 1 are investigated. For the
remainder of this article, they will be identified as LGB, LG¾Y¼B, LGYB, LG¼Y¾B and LYB, respectively. All the gadolinium containing crystal properties are reported here and compared to the Yb 26%-content LYB crystal, which has already been proved to be promising for laser operation [4(a)-(c)].
2. Material syntheses: crystal growth and characterization
The compounds were first prepared by solid state reaction. Raw materials Li2CO3, H3BO3, Y2O3, Gd2O3 and Yb2O3 with
a minimum purity of 99.98% were weighed in stoichiometric proportion according to the following reaction:
with x=0, 0.25, 0.5, 0.75 and 1.
The powder mixtures were first heated at 450 °C to remove water and then heated at 750 °C for 15h. The phase control of the products was achieved through X-Ray diffraction (XRD). In order to get a better insight into the crystal growth process, differential thermal analysis (DTA) measurements have been performed on a set of compositions, all of which display a melting point close to 860 °C. As in the case of Ce-content LGB [5], the DTA analysis (DSC–DTA Netzsch 404
Eos) of the ytterbium doped materials revealed that this borate series of compounds undergo high undercoolings typically around 200 °C (Table 1). Hence, crystal growth requires substantial thermal gradients, which have been set in the vicinity of the solidification interface with values reaching 20 °C cm−1. The growth kinetics depends on the roughness of the interface [6], which itself is closely related to the so-called Jackson factor [7], defined as
where ΔHf denotes the melting heat, k the Boltzmann constant and f the ratio of the number of the nearest neighbour
sites adjacent to an atom in the plane of the interface to the total number of nearest neighbours of an atom in the crystal [8]. f usually lies between 0.5 and 5/6. 2D-mean field theory predicts roughening transitions for αJ<2, whereas in the
3D-Ising model a critical value of 3.2 is found. According to our calorimetric data, the crystals we investigated exhibit α-values in the range of 1.95–3.25. Since they systematically underwent faceting, we believe their interface roughening transition is more likely to be due to a 2D-mean field behaviour.
The pre-melted product was loaded in a platinum crucible and placed inside a Czochralski pulling furnace. The compound was heated at 50 °C above the melting point in order to homogenize the composition of the melt. A seed oriented along the c-axis, corresponding to the direction of the rare earth polyhedron chain, was dipped inside the melt at a rotation rate of 5–7 rpm [5]. In order to improve the crystal quality, different growth processes were used. The pulling rate was chosen between 0.3 and 0.5 mm h−1 and the cooling rate was within the range of 0.3–1.0 °C h−1. After the growth, the crystal was annealed in a muffle furnace in order to reduce the stresses induced by the cooling. All the grown crystals showed a high optical quality zone, enabling the performance of optical tests. Their dimensions are more than 3 cm long and 2 cm wide in diameter. As an example, Fig. 2 depicts the LGB crystal that was grown using this method.
For each composition, XRD measurements were performed on crushed crystals (PANalytical X’Pert Pro diffractometer equipped with monochromatic Cu Kα1 radiation) in order to confirm the structure and determine the cell parameters, which were refined by a Lebail fit with the Fullprof programme [9]. With the substitution of yttrium for gadolinium, a contraction of the unit cell is observed (see Table 1) according to the reduction of the cation radius (r(Gd)=1.06 Å;
r(Y)=1.02 Å; r(Yb)=0.98 Å).
Chemical analysis was performed by means of Inductively Coupled Plasma (ICP) spectroscopy on a Varian 720-ES instrument to determine the ytterbium concentration in the crystals. Results obtained are consistent with those of the cell parameters refinement performed on the XRD data. Due to differences between the rare earth elements, segregation occurs and the rare earth concentration is not constant along the crystal. For each crystal, the gadolinium, yttrium and ytterbium concentrations were determined as a function of distance from the seed along the c-axis. For all compositions, the gadolinium concentration is almost constant along the crystal and the quantity of yttrium ions is higher than expected at the top of the crystal (theoretical value in italic in Table 2). It decreases downwards below the expected theoretical value at the bottom of the crystal, whereas the ytterbium concentration increases along the crystal. This first observation reveals that the crystal growth process seems to favour the dissolution of yttrium ions. When the bulk composition is poorer in yttrium, the ytterbium content increases in the crystal.
In Table 2 the rare earth concentrations in the grown crystals are shown. All the measurements reported in this paper correspond to one piece of single crystal selected in the same area of the grown crystals.
3. Mechanical and thermal properties 3.1. Hardness
Knoop hardness measurements were performed on a Leica VMHT. The hardness of these materials is about 430HK0.025, as shown in Table 3. The observed differences between the crystals are not significant and are mainly due to the stress generated by the different growth protocols (cooling rate and pulling rate). This hardness corresponds to 4–5 on the Mohs scale. Such results show that these materials are softer than other borates like GdCOB [10] or LGOB [11] (hardness of about 7 on the Mohs scale) or other well-known laser crystals like YAG [12] (hardness of about
8–8.5), but similar to KYW [13] (hardness of about 4). Considering the structure description [3], one can imagine that the limiting factor arises from the borate groups located between LnO8 chains, which introduce weaknesses.
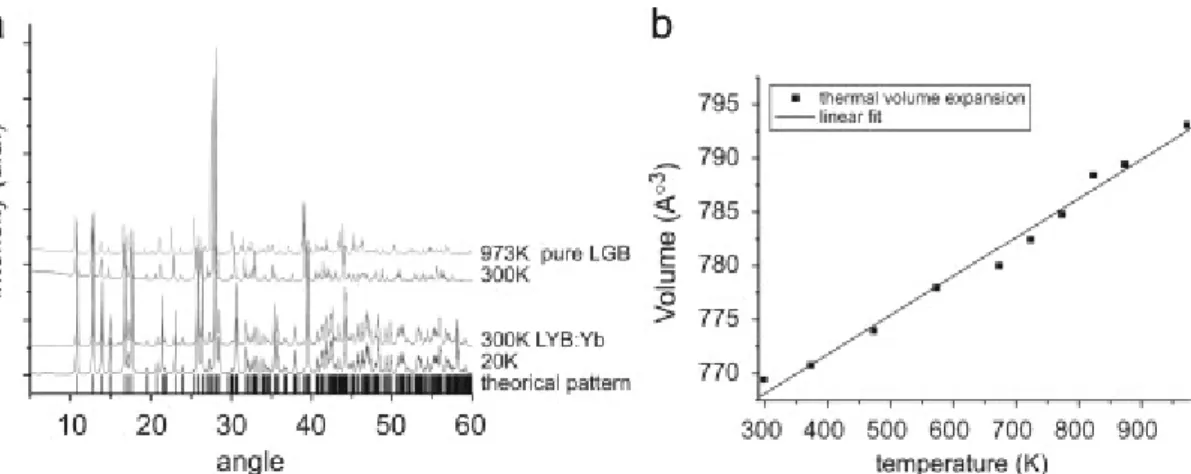
3.2. Thermal expansion
XRD measurements at different temperatures were performed in the 300–973 K temperature range on an undoped Li6Gd(BO3)3 crystal (LGB) and in the 20–300 K temperature range on the Yb (26%)-content LYB crystal (Fig. 3a). The
thermal volume expansion of the pure LGB crystal is depicted in Fig. 3b.
As for Yb 26%-content LYB, these measurements indicate a linear expansion of the unit cell before reaching the melting point. No structural change was observed on these borate matrices from 20 to 973 K.
3.3. Thermal conductivity and heat capacity
Even in ytterbium doped laser materials where the pump wavelength is very close to the laser wavelength, high average power laser operation always entails a thermal load that must be removed from the crystal. As thermal inertia due to heat conduction is linked to heat capacity Cp and thermal conductivity κ, a fine characterization of both properties
is mandatory. Note that for borate compounds, the thermal conductivity is usually small. Parameters like the low crystal symmetry, the heavy molar weight of the elements and of course the doping rate contribute to a decrease of thermal conductivity. In these materials, the gadolinium phase exhibits a larger molar weight than the yttrium one. Consequently, based on principal assumptions that govern thermal conductivity, LGB is expected to have a lower thermal conductivity than LYB at the same temperature. In addition, in these crystals the high doping rate (22%) cannot be overlooked. To assess the thermal conductivity of doped compounds quantitatively, Gaumé et al. [2] have established a relationship linking thermal conductivity with the doping ion atomic weight. In order to keep thermal conductivity at its highest level, doping ions must substitute cations with comparable atomic weights. In the case reported by Gaumé et al., gadolinium gallium garnet (GGG) has a higher thermal conductivity than yttrium aluminium garnet (YAG) for an identical ytterbium substitution rate above 5% [2]. The difference of molar masses between gadolinium ions (M=157.25 g mol−1) and ytterbium ions (M=173.04 g mol−1) is smaller than the difference between yttrium ions (M=88.9 g mol−1) and ytterbium ions. Hence, there should be a boundary ytterbium concentration from where LGB is expected to have a higher thermal conductivity than LYB. Consequently, the goal of this study is to see if the high substitution rate of ytterbium (22%) will increase the thermal conductivity of LGB with respect to LYB crystals. Measurements of the thermal conductivities were performed on rectangular bars using a four points method. The thermal conductivity κ (W K−1 m−1) is deduced from the temperature difference ΔT(K) between two sections of the crystal spaced by length L (m) measured by E-type thermocouples. One end of the crystal is heated by a micro-furnace, providing a heat flow Q (W) across the rectangular shape of the sample with the cross section area A (m²) while the cold end is held at the sink temperature T (K). The thermal conductivity was calculated for each temperature using the following relation after a careful correction of radiative losses and parasitic heat flow via thermocouples and leads:
Measurements were performed along the b-axis for Yb-LYB, Yb-LGB and Yb-LGYB crystals. Fig. 4 shows a typical example of the evolution of the Yb-LGYB crystal thermal conductivity as a function of temperature.
On decreasing temperature below 300 K, thermal conductivity increases and reaches a maximum at 25 K. Then, thermal conductivity starts to decrease down to 3 W m−1 K−1 at liquid helium temperature. This evolution is typical for crystalline materials in which an Umklapp scattering process is responsible for a decrease of thermal conductivity at high temperatures, whereas a decrease at low temperature is due to a drop of heat capacity [4(b)]. However the phonon mean free path at high temperature is in our case further depressed due to scattering of heat carrying phonons by optical modes associated with rigid BO3 groups. According to our opinion, this is the most effective process that limits thermal conductivity at high temperatures.
For the solid solution, according to Table 3, the LYB crystal exhibits a higher thermal conductivity than the LGB crystal. At room temperature, the measured values have a relatively high uncertainty (±0.3 W m−1 K−1) and, consequently, the observed differences should be considered with precaution. In comparison with other borates like GdCOB (2.1 W m−1 K−1) [14] or BOYS (1.8 W m−1 K−1) [15], the thermal conductivities are slightly better for the yttrium phase as well as for the gadolinium phase.
In order to complete the basic thermal characterization the heat capacity measurements were also performed on ytterbium doped LGB, LGYB and LYB crystals. The results are reported in Table 3 and the three compounds investigated show the same heat capacity. To conclude, the thermal properties are very close with a small improvement for the LYB compound.
4. Optical and spectroscopic properties
4.1. Refractive index measurement
Belonging to the biaxial optical class, the optical properties of monoclinic crystals are governed by the dielectric constant εr, which is a complex second order tensor. It is well known that the orthogonal frame, where the real part of εr
is diagonal, is the dielectric frame, or the optical frame, labelled (X, Y, Z). The crystallographic frame is only linked to the dielectric frame for monoclinic crystals by the b-axis which is collinear with the Y-axis. The X- and Z-axes are located in the same plane as that of the a- and c-axes, which is perpendicular to the b-axis. The surface index of biaxial crystals in this dielectric frame is composed of two layers corresponding to the propagation of two polarization modes. Their values along the three main axes of the dielectric frame are the three main refractive indices nX, nY and nZ.
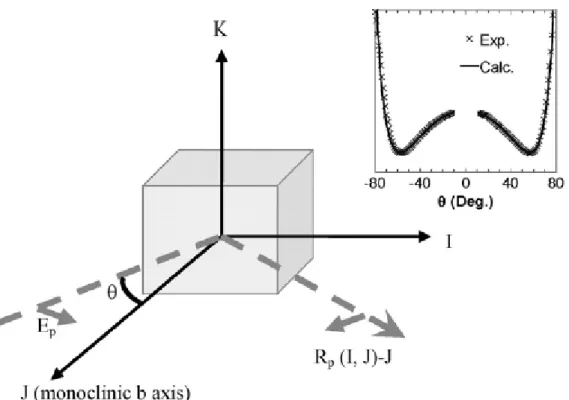
We performed refractive index measurements on a piece of an orthogonal parallelepiped oriented along (I, J, K), an orthogonal frame. We used our generalized ellipsometric technique coupled to a continuous wave laser emitting at 532 nm and the data analysis relies on an original method we developed [16]. It is based on a transfer matrix formalism that can handle quite complicated problems with ease and clarity like the study of anisotropic planar structures.
Hence, the four components of the dielectric matrix (εII, εJJ, εΚΚ, εIK=εKI), with respect to the monoclinic crystal axes,
were obtained using an extended Brewster angle reflection method over a wide θ range of ±[10°, 80°].
Reflected p-polarized intensities in the IJ-plane with incidence along the J direction, called hereafter Rp (I, J)-J, have
been recorded (Fig. 5). Six possible schemes for each crystal have been performed, i.e. Rp (nJ, nI)-I, Rp (nK, nI)-I, Rp (nI, nJ)-J, Rp (nK, nJ)-J, Rp (nI, nK)-K, Rp (nJ, nK)-K and the six corresponding patterns have been fitted together to
obtain the four components of the dielectric matrix. This original procedure minimizes the errors, and thus the accuracy of the obtained main values of refractive index from these ellipsometry measurements is better than 0.01. Finally, the obtained dielectric matrix (defined with respect to the monoclinic frame) has been diagonalized in order to give the optical index of refraction in the optical frame at 532 nm. The results are shown in Table 4.
The major variation of refractive index is observed on the ny values, which is coherent with the crystal layered structure since it corresponds to an excitation and response along the b-axis (Y-axis), i.e. perpendicular to the layers defined by the (ac) planes, which contain the LnO8 polyhedra chains.
Note: evolution of the nx, ny and nz indexes indicates that part of the refined data might be overestimated because of the poor quality of some of the experimental patterns (Yb-LGB composition).
4.2. Spectroscopic measurements
The goal of these preliminary spectroscopic measurements is to check if the modification of composition induces changes on local symmetry around the ytterbium ions. Low temperature measurements are required to achieve good resolution of the spectra and to avoid thermally activated transitions. Transmission measurements have been performed with unpolarized light on the crystals. The absorption spectra were recorded using a double beam spectrophotometer (CARY 5000-UV–vis–NIR) between 850 and 1100 nm. All the emission spectra were performed on powders (crushed crystal) and were recorded using a spectrofluorometer (Fluorolog 3 Horiba-Jobin Yvon) connected to an InGaAs detector using a 932 nm laser diode as excitation source. The low temperature measurements were recorded on the same equipment with an optistat Oxford Instrument cryostat cooled by a liquid helium circuit.
Single crystal absorption and crushed crystal emission spectra were recorded at 15 K for each composition ([Fig. 6] and [Fig. 7]) to determine the Yb3+ energy level diagram in each crystal. The gadolinium ion has a bigger radius than the yttrium ion; consequently the ion radius difference may induce a distortion of the rare earth polyhedron, which is likely to affect the crystal field around the ytterbium site. The identification of 2F5/2 and 2F7/2 transition lines was labelled with the
ground state component as number 1 and the highest excited state as number 7. The absorption intensity in the spectra of Fig. 6b is shifted in order to better visualize the expected wavelength shifts.
Surprisingly, the peak positions and the total splitting of the spectra do not change with composition. The lack of modification indicates that the substitution of yttrium by gadolinium is not sufficient to induce a strong modification of local symmetry around the ytterbium ion. Assignments of the peaks have been done according to the energy level structures determined in Refs. [17(a) and (b)]. The total splittings of the 2F5/2 and
2
F7/2 multiplets amount to 544 and
687 cm−1, respectively. Furthermore, in both absorption and emission spectra, two lines (A and B) associated with transitions between the levels 1 and 5 are detected for each composition. The presence of a second emission of ytterbium ions was first reported by Brenier et al. [17(b)]. Complementary experiments seem to indicate that the second emission is related to the crystal growth process and suggest that it arises from the existence of Yb–Yb ion pairs.
5. Conclusion
This paper investigated the characterization of mechanical, thermal and optical properties of Yb-content Li6Ln(BO3)3
(Ln: Gd, Y) single crystals grown by the Czochralski method. The thermal conductivity varies from 1.6 to 2.9 W m−1 K−1 for the gadolinium and yttrium-based phases, respectively, whereas the hardness of the crystal does not depend on composition. The modification of composition does not change the melting point temperature, and large undercoolings have been observed. Good knowledge of these thermal properties allowed us to improve the crystal growth process. The introduction of gadolinium in the matrix results in an expansion of the unit cell parameters, which in turn implies an increase of the Ln–O bond lengths. Surprisingly, the luminescence spectra do not reflect these structural distortions. Crystal field effects around the ytterbium ions seem to be identical for the whole solid solution. The energy assignment of the crystal field components is similar to that of the yttrium-based phase. The low temperature luminescence spectroscopy has also put in evidence a non-negligible second emission of ytterbium ions, likely to be due to the formation of the Yb–Yb pairs. Further optical characterizations will be performed on single crystals, including laser tests.
Acknowledgments
The authors thank M. J.-P. Manaud for his helpful advice on the Knoop test. This work was supported by Conseil Régional d’Aquitaine (Contract no. 20071101024), the CNRS and the GIS AMA. Marie Chavoutier is the holder of a Ph.D. thesis fellowship from Conseil Régional d’Aquitaine.
References
1) F. Druon, F. Balembois and R. Georges, C. R. Phys. 8 (2007), pp. 153–164.
2) R. Gaumé, B. Viana, D. Vivien, J.-P. Roger and D. Fournier, Appl. Phys. Lett. 83 (7) (2003), pp. 1355–1357.
3)(a)G.K. Abdullaev and K.S. Mamedov, Russ. J. Inorg. Chem. 22 (1977), pp. 1765–1766. (b)G.K. Abdullaev and K.S. Mamedov, Sov. Phys. Crystallogr. 22 (2) (1977), pp. 220–222.
4) (a)J. Sablayrolles, V. Jubera, J.P. Chaminade, I. Manek-Hönninger, S. Murugan, T. Cardinal, R. Olazcuaga, A. Garcia and F. Salin, Opt. Mater. 27 (2005), pp. 1681–1685. (b)J. Sablayrolles, V. Jubera, M. Delaigue, I. Manek-Hönninger, J.P. Chaminade, J. Hetjmanek, R. Decourt and A. Garcia, Mater. Chem. Phys. 115 (2009), pp. 512–515.
(c)M. Delaigue, V. Jubera, J. Sablayrolles, J.P. Chaminade, A. Garcia and I. Manek-Hönninger, Appl. Phys. B 87 (4) (2007), pp. 693–696.
5) J.P. Chaminade, O. Viraphong, F. Guillen, C. Fouassier and B. Czirr, IEEE Trans. Nucl. Sci. 48 (2001), pp. 1158– 1161.
6) D. Elwell and H.J. Scheel, Crystal Growth from High-temperature Solutions, Academic, London (1975).
7) K.A. Jackson, Liquid Metals and Solidification, ASM, Cleveland (1958).
8) X. Lu, Z. You, J. Li, Z. Zhu, G. Jia, B. Wu and C. Tu, Solid State Commun. 146 (2008), pp. 287–292.
9) J. Rodriguez-Carjaval, Fullprof: a programme for Rietveld refinement and pattern matching analysis, in: Collected Abstracts of the Powder Diffraction Meeting, Toulouse, France, 1990, vol. 127.
10) G. Aka, A. Kahn-Harari, F. Mougel, D. Vivien, F. Salin, P. Coquelin, P. Colin, D. Pelenc and J.P. Damelet, J. Opt.
Soc. Am. B 14 (9) (1997), pp. 2238–2247.
11) V. Jubera, P. Veber, M. Chavoutier, A. Garcia, F. Adamietz, V. Rodriguez, J.P. Chaminade and M. Velázquez,
Cryst. Eng. Commun. 12 (2010), pp. 355–357.
12) L. Fornasiero, E. Mix, V. Peters, K. Petermann and G. Huber, Cryst. Res. Technol. 34 (2) (1999), pp. 255–260.
13) L. Tang, Z. Lin, L. Zhang and G. Wang, J. Cryst. Growth 282 (2005), pp. 376–382.
14) S. Chénais, F. Druon, F. Balembois, G. Lucas-Leclin, P. Georges, A. Brun, M. Zavelani-Rossi, F. Augé, J.P. Chambaret, G. Aka and D. Vivien, Appl. Phys. B: Lasers Opt. 72 (2001), pp. 389–393.
15) S. Chénais, F. Druon, F. Balembois, P. Georges, R. Gaumé, P.H. Haumesser, B. Viana, G. Aka and D. Vivien, J.
Opt. Soc. Am. B 19 (2002), pp. 1083–1091.
16)(a)V. Rodriguez and C. Sourisseau, J. Opt. Soc. Am. B 19 (2002), pp. 2650–2664. (b)V. Rodriguez, J. Chem. Phys. 128 (2008), p. 064707.
17) (a)J. Sablayrolles, V. Jubera, F. Guillen, R. Decourt, M. Couzi, J.P. Chaminade and A. Garcia, Opt. Commun. 280 (2007), pp. 103–109. (b)A. Brenier, A. Yoshikawa, K. lebbou, A. Jouini, O. Aloui-Lebbou, G. Boulon and T. Fukuda, J.
Fig. 3. (a) Powder X-ray diffraction patterns of Yb: LYB crystal at 20 and 300 K and of a pure Li6Gd(BO3)3 crystal at 300
Fig. 6. (a) Absorption spectra of single crystals Yb 25%-content LGB, Yb 25%-content LG¾Y¼B, Yb 25%-content LGYB and Yb 25%-content LG¼Y¾B at 15 K (no light polarization) and (b) shifted curves.