HAL Id: hal-01789359
https://hal.archives-ouvertes.fr/hal-01789359
Submitted on 10 May 2018
HAL is a multi-disciplinary open access
archive for the deposit and dissemination of
sci-entific research documents, whether they are
pub-lished or not. The documents may come from
teaching and research institutions in France or
abroad, or from public or private research centers.
L’archive ouverte pluridisciplinaire HAL, est
destinée au dépôt et à la diffusion de documents
scientifiques de niveau recherche, publiés ou non,
émanant des établissements d’enseignement et de
recherche français ou étrangers, des laboratoires
publics ou privés.
microRNAs is controlled by nucleoplasmic Sfpq
Silvia Bottini, Nedra Hamouda-Tekaya, Raphael Mategot, Laure-Emmanuelle
Zaragosi, Stéphane Audebert, Sabrina Pisano, Valérie Grandjean, Claire
Mauduit, Mohamed Benahmed, Pascal Barbry, et al.
To cite this version:
Silvia Bottini, Nedra Hamouda-Tekaya, Raphael Mategot, Laure-Emmanuelle Zaragosi, Stéphane
Au-debert, et al.. Post-transcriptional gene silencing mediated by microRNAs is controlled by
nucleo-plasmic Sfpq. Nature Communications, Nature Publishing Group, 2017, 8 (1),
�10.1038/s41467-017-01126-x�. �hal-01789359�
Post-transcriptional gene silencing mediated by
microRNAs is controlled by nucleoplasmic Sfpq
Silvia Bottini
1,2
, Nedra Hamouda-Tekaya
1,2
, Raphael Mategot
1,2
, Laure-Emmanuelle Zaragosi
3
,
Stephane Audebert
4
, Sabrina Pisano
5
, Valerie Grandjean
1,2
, Claire Mauduit
1,2,6,7
, Mohamed Benahmed
2,8
,
Pascal Barbry
3
, Emanuela Repetto
1,2
& Michele Trabucchi
1,2
There is a growing body of evidence about the presence and the activity of the miRISC in the
nucleus of mammalian cells. Here, we show by quantitative proteomic analysis that Ago2
interacts with the nucleoplasmic protein Sfpq in an RNA-dependent fashion. By a combination
of HITS-CLIP and transcriptomic analyses, we demonstrate that Sfpq directly controls the
miRNA targeting of a subset of binding sites by local binding. Sfpq modulates miRNA
tar-geting in both nucleoplasm and cytoplasm, indicating a nucleoplasmic commitment of
Sfpq-target mRNAs that globally in
fluences miRNA modes of action. Mechanistically, Sfpq binds to
a sizeable set of long 3
′UTRs forming aggregates to optimize miRNA positioning/recruitment
at selected binding sites, including let-7a binding to Lin28A 3
′UTR. Our results extend the
miRNA-mediated post-transcriptional gene silencing into the nucleoplasm and indicate that
an Sfpq-dependent strategy for controlling miRNA activity takes place in cells, contributing to
the complexity of miRNA-dependent gene expression control.
DOI: 10.1038/s41467-017-01126-x
OPEN
1INSERM U1065, C3M, Team Control of Gene Expression (10), 151 route de St-Antoine-de-Ginestière, B.P. 2 3194, Nice 06204, France.2Université Côte d’Azur, INSERM, C3M, 151 route de St-Antoine-de-Ginestière, B.P. 2 3194, Nice 06204, France.3Université Côte d’Azur, CNRS, IPMC, Valbonne, France. 4CRCM, Marseille Protéomique, Institut Paoli-Calmettes, Aix Marseille University, INSERM, CNRS, 27 bd Leï Roure, BP 30059, Marseille 13273, France. 5Université Côte d’Azur, CNRS, INSERM, IRCAN, Faculty of Medicine, 28 Av. Valombrose, Nice 06107, France.6Université Lyon 1, UFR Médecine Lyon Sud, Lyon F-69921, France.7Hospices Civils de Lyon, Hopital Lyon Sud, Laboratoire d’Anatomie et de Cytologie Pathologiques, Pierre-Bénite F-69495, France. 8Centre Hospitalier Universitaire de Nice, Département de Recherche Clinique et d’Innovation, Nice F-06001, France. Silvia Bottini and Nedra Hamouda-Tekaya contributed equally to this work. Correspondence and requests for materials should be addressed to M.T. (email:mtrabucchi@unice.fr)
123456789
M
icroRNAs (miRNAs) are functional small RNAs and
fundamental components of gene expression programs
that regulate many biological processes, including cell
proliferation, differentiation, and death
1. Like other small RNAs,
miRNAs can be used as biomarkers for human disorders
2.
miRNAs associate with Argonaute (Ago) proteins, mainly Ago2,
to form the miRNA-induced silencing complex (miRISC) and
target mRNAs
3. Although miRNA-dependent silencing has
mainly been described in the cytoplasm, a growing body of
evi-dence indicates that miRNAs are also functional in the
nucleus
4–6. Canonically, miRNAs use a sequence of 6–8
nucleo-tides (nt) at their 5′ end, called the seed region, to block the
translation or promote the degradation of target mRNAs
1.
Despite efforts to develop bioinformatics tools to predict
miRNA-binding sites, it has been demonstrated that prediction
approa-ches can be misleading, yielding approximately 70% false or
negative targets
7. Such a low prediction efficiency might be
improved by considering the activity of RNA-binding proteins
that bind to mRNAs to control miRNA targeting
1. In support of
this mechanism, it has been shown that some RNA-binding
proteins associate with specific mRNAs and interfere with specific
miRNA-binding sites to either inhibit or enhance miRNA
tar-geting
8. This result leads to the concept of a sequence
micro-environment surrounding miRNA-binding sites that plays an
important role in regulating miRNA activity
8. Although some
examples of such a mechanism have been described, including
those for Hu-Antigen R (HuR)
9and Deadend I (Dnd1)
10, much
remains to be learned about the molecular mechanism(s)
underlying the roles of the sequences surrounding
miRNA-binding sites, and whether this feature is general of miRNA
tar-geting regulation or is confined to specific cases.
Herein, to explore the RNA dependency of miRNA activity we
used a quantitative proteomic analysis to identify
dependent Ago2 interactors. Among the identified
RNA-dependent interactors, we focused our investigation on Splicing
factor proline/glutamine-rich protein (Sfpq). We found that Sfpq
interacts with nucleoplasmic miRISC in different human and
mouse cell lines. We demonstrated that Sfpq directly promotes
miRNA targeting through local binding, ultimately facilitating
miRNA-dependent degradation. Although Sfpq only interacts
with miRISC in the nucleoplasm, it appeared to modulate miRNA
targeting in both the nucleoplasm and cytoplasm. This result
indicated that a nucleoplasmic commitment for Sfpq-target
mRNAs globally influences miRNA targeting in both cellular
compartments. We found that Sfpq preferentially binds to long 3′
UTRs through long sequences that harbor multiple copies of two
distinct Sfpq-binding motifs that we had identified. Observations
by atomic force microscope (AFM) further showed that Sfpq
aggregates onto target 3′UTRs. This process ultimately leads to
the position/recruitment optimization of miRNAs at specific
binding sites, including let-7a targeting of the Lin28A 3′UTR. In
stem cells, Sfpq regulated the let-7-dependent gene expression
program toward a neuron-like phenotype differentiation. Our
results unveil an unanticipated role for Sfpq in
post-transcriptionally promoting miRNA-dependent gene silencing
from the nucleoplasm to the cytoplasm of a sizeable subset of
mRNAs that have long 3′UTRs. These results highlight the
importance of nuclear miRNA targeting and the sequence
fea-tures of mRNAs for post-transcriptional miRNA programs
dur-ing gene expression regulation.
Results
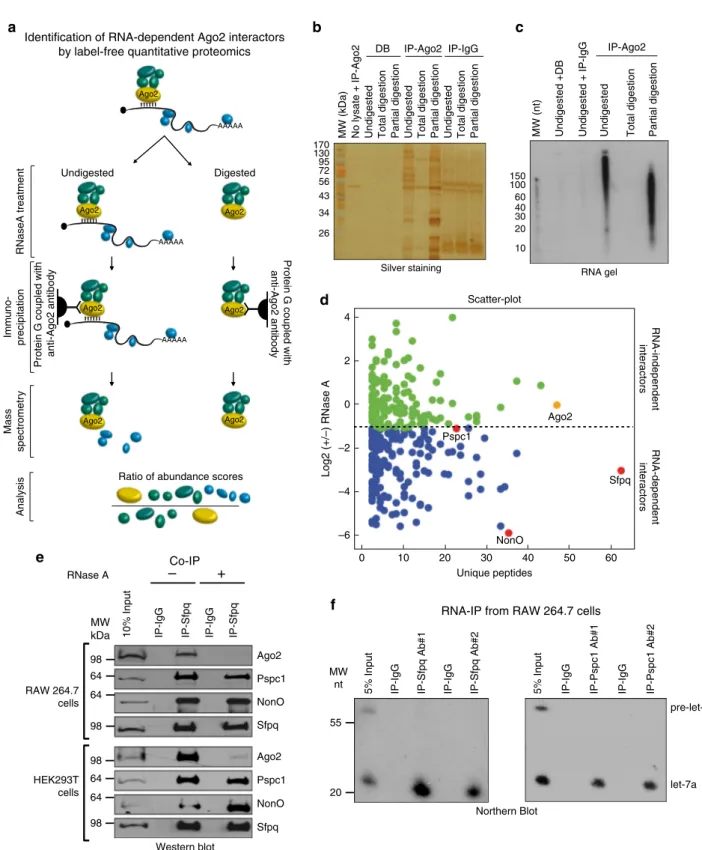
Identification of RNA-dependent Ago2 interactors. To identify
RNA-dependent Ago2 interactors, we performed a label-free
quantitative
mass
spectrometry
(MS)
analysis
11of
immunoprecipitated Ago2-containing complexes obtained from
mouse RAW 264.7 cell extracts that were either undigested ((–)
RNase) or totally digested ((+)RNase) (Fig.
1
a).
Immunopreci-pitation (IP) was revealed by SDS-PAGE-silver staining or an
RNA gel (Fig.
1
b, c). MS analysis identified 915 proteins that
might interact with Ago2 (Supplementary Data
1
). For
quanti-tative analysis, we applied different
filters based on the following
criteria: (i) the reproducibility of three replicates using a
PCA-based procedure; (ii) the application of a stringent cutoff point for
the Mascot score to identify unique peptides; and (iii) the
enrichment of proteins identified (abundance score) in the Ago2
immunoprecipitated samples with respect to the IgG IP (ANOVA
test, p-value
≤ 0.05; Supplementary Data
2
). Together, these
filters
enabled the removal of background noise and resulted in the
identification of 299 different proteins in both conditions. After
statistical analysis, we identified 133 Ago2 RNA-independent and
166 RNA-dependent interactors (Fig.
1
d, Supplementary Fig.
1
a,
b, and Supplementary Data
3
).
Many of the Ago2 interactors found in this study were
previously independently identified as being associated with
Ago2. Indeed, among the RNA-independent interactors, we
identified many miRISC components, including members of the
GW protein family (Trinucleotide Repeat Containing 6—TNRC6
—in mammals), and CCR4-NOT Transcription Complex Subunit
1 (CNOT1), which, together with DEAD-Box Helicase 6 (DDX6,
an RNA-dependent interactor), regulates miRNA-dependent
deadenylation of target mRNAs
12. As expected, we also found
several
known
RNA-dependent
interactors,
such
as
Polyadenylate-Binding Protein 1 (PABP1)
13, Elav1 (also called
HuR)
14, the putative DExD box helicase Moloney Leukemia
Virus 10 (MOV10)
13, and La Ribonucleoprotein Domain Family
Member 1 (Larp1)
15. Notably, although it has been shown that
Ago2 also associates with proteins involved in miRNA
biogen-esis
15, we did not
find Dicer, Trans-Activation Responsive
RNA-Binding Protein 2 (Trbp2), or Heat Shock Protein 90 (Hsp90) in
our analysis, suggesting that the antibody we used specifically
immunoprecipitated Ago2 associated with mature miRNAs and
not precursors (Supplementary Fig.
1
c, d). Taken together,
despite some differences, our list of 299 Ago2 interactors is
similar to that reported for a previous SILAC quantitative
proteomic analysis
15. Therefore, our results corroborate previous
works, indicating the high specificity of our analysis, and extend
them by identifying novel interactors.
To study the biological and mechanistic relevance of RNA as a
mediator of the interactions between Ago2 and other proteins for
miRNA function, we decided to focus on Sfpq, Paraspeckle
Component 1 (Pspc1), and Non-POU Domain Containing,
Octamer-Binding (NonO), which form a protein complex
16.
These three proteins were among the most abundant
RNA-dependent Ago2 interactors (red points in Fig.
1
d). All three
proteins contain two RNA recognition motif (RRM) domains that
confer binding specificity to RNA
17and a coiled-coil domain that
mediates protein aggregation
18. Sfpq and NonO are
multi-functional RNA-binding proteins that can regulate different steps
of the mRNA life cycle, including splicing, nuclear localization,
and degradation
19, 20. Pspc1 function is poorly understood.
Interestingly, these proteins are known to associate with the long
non-coding RNA Nuclear Paraspeckle Assembly Transcript 1
(Neat1) to form the paraspeckle, a nucleoplasmic compartment of
approximately 0.2–1 μm in size with several physiopathological
functions
16, including nuclear retention of mRNAs
21,
transcrip-tional regulation
22, cancer pathogenesis
23, and viral infection
24.
Interactions with Ago2 were also observed for Sfpq in previous
MS
analyses
in
HEK293T
cells
and
in
hepatocellular
carcinoma
15, 25. To validate the specific associations between
AAAAA RNaseA treatment Immuno-precipitation Mass spectrometr y Ago2 AAAAA Ago2 AAAAA Ago2 Undigested Digested Ago2 Ago2 Analysis
Ratio of abundance scores Identification of RNA-dependent Ago2 interactors
by label-free quantitative proteomics
Protein G coupled with anti-Ago2 antibody
Protein G coupled with
anti-Ago2 antibody
b
c
170 130 95 72 56 43 34 26No lysate + IP-Ago2 Undigested Total digestion Partial digestion Undigested Total digestion Partial digestion Undigested Total digestion Partial digestion
DB IP-Ago2 IP-IgG
MW (kDa) Undigested Total digestion Partial digestion
IP-Ago2
Undigested +DB Undigested + IP-IgG
MW (nt) 150 100 60 40 30 20 10
5% Input IP-IgG IP-Sfpq Ab#1 IP-IgG IP-Sfpq Ab#2
RNA-IP from RAW 264.7 cells
pre-let-7a
let-7a Northern Blot
f
e
Co-IP10% Input IP-IgG IP-Sfpq IP-Sfpq
–
+
RNase A IP-IgG RAW 264.7 cells HEK293T cells Western blotSilver staining RNA gel
d
0 10 20 30 40 50 60 –4 –2 0 2 4 –6 Unique peptides Scatter-plot RNA-independent interactors RNA-dependent interactors Ago2 Pspc1 Sfpq NonO5% Input IP-IgG IP-Pspc1 Ab#1 IP-IgG IP-Pspc1 Ab#2
Ago2 Ago2 Pspc1 Pspc1 NonO NonO Sfpq Sfpq Log2 (+/–) RNase A MW kDa MW nt 98 98 64 64 98 98 64 64 55 20
a
Ago2 Ago2Fig. 1 Sfpq, Pspc1, and NonO are components of Ago2 complex and interact with let-7a. a Overview of the proteomic method used to identify RNA-dependent proteins interacting with Ago2.b Silver staining of an SDS-PAGE analysis from the IP with the anti-Ago2 antibody, the protein G conjugated with the Dynabeads (DB), or the anti-Ago2 antibody alone incubated without cell lysate. The samples were untreated, treated with 10μg ml−1RNase A for 30 min at room temperature (for partial digestion), or treated with 10 mg ml−1RNase A for 30 min at room temperature (for total digestion).c Radioactive images of a TBE-Urea gel showing signal from32P-labeled RNA fragments of samples untreated, treated with 10μg ml−1RNase A for 30 min at room temperature (for partial digestion), or treated with 10 mg ml−1RNase A for 30 min at room temperature (for total digestion).d Scatter-plot of the log base 2 (−/+) RNase A ratios (abundance scores) plotted with the unique peptides for each identified protein. Each spot is a different protein. e Co-IP of endogenous Sfpq and Ago2, Pspc1, or NonO in RAW 264.7 and HEK293T cells. When indicated, cell lysates were incubated at room temperature with RNase A (10 mg ml−1) for 30 min.f Sfpq and Pspc1 interact with mature let-7a but not with the precursor. RAW 264.7 cell extracts were
experiments with the endogenous proteins in different human
and mouse cell lines, including RAW 264.7, P19, and
HEK293T cells (Fig.
1
e and Supplementary Fig.
2
a). In all three
cellular models, we confirmed each protein as an integral
component of the Ago2 complex. These results were also
validated by co-immunoprecipitating Sfpq-tagged and
Ago2-tagged proteins or by GST pull-down experiments
(Supplemen-tary Fig.
2
b, c). RNase treatment confirmed the RNA dependency
of the Ago2 interactions; however, it did not affect the
interactions among Sfpq, Pspc1, and NonO (Fig.
1
e and
Supplementary Fig.
2
a). To determine whether they also associate
with miRNAs, we performed an ribonucleoprotein complexes
immunoprecipitation (RNA-IP) followed by Northern blotting
for selected miRNAs in different cell lines. Sfpq and Pspc1
interact with let-7a and miR-23b (Fig.
1
f and Supplementary
Fig.
2
d).
Overall, these results validated our MS analysis and raised the
possibility that the Sfpq–Pspc1–NonO complex could regulate
miRNA functions in an RNA-dependent fashion.
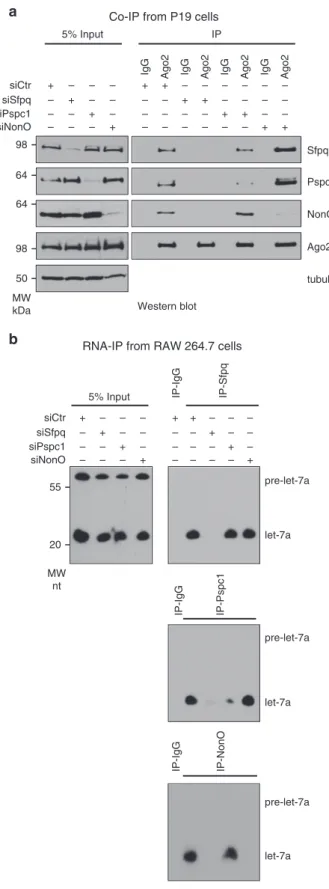
Nucleoplasmic Ago2 interacts with Sfpq and its complex.
Because Sfpq, Pspc1, and NonO form a complex and share the
ability to directly bind single-stranded RNAs, we determined
whether one of them specifically mediated the interaction with
miRISC. Thus, we singularly knocked down each protein in
mouse and human cells and checked for interactions with Ago2
by co-IP and with miRNAs by RNA-IP. As shown in Fig.
2
a and
Supplementary Fig.
3
a and b, Sfpq knockdown specifically
inhibited the interaction between Ago2 and either Pspc1 or
NonO, whereas Pspc1 or NonO knockdown did not affect the
interaction between Sfpq and Ago2. Consistently, Sfpq
knock-down also inhibited the interaction between let-7a and either
Pspc1 or NonO, whereas Pspc1 or NonO knockdown did not
affect the interaction between Sfpq and let-7a (Fig.
2
b and
Sup-plementary Fig.
3
c).
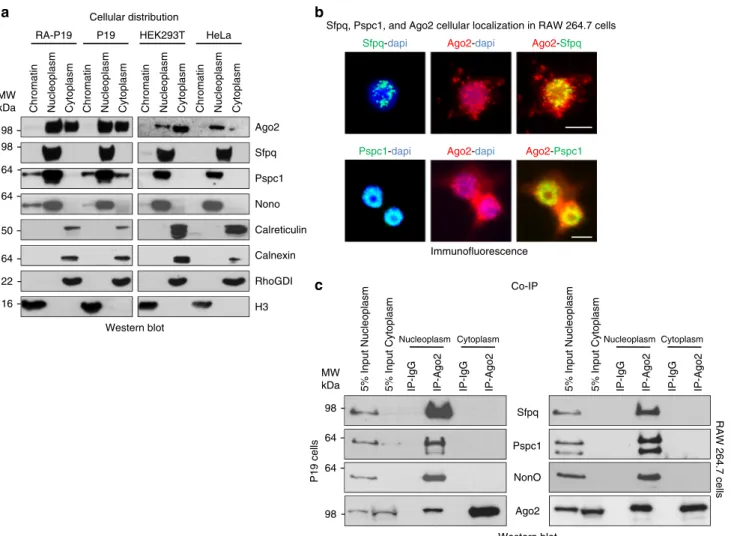
miRNAs are bound to nuclear Ago2, indicating the existence of
a nuclear miRNA pathway
6. Interestingly, we found that nuclear
miRISC co-localizes with Sfpq, Pspc1, and NonO in the
nucleoplasm in both human and mouse cell lines by Western
and Northern blot analyses (Fig.
3
a and Supplementary Fig.
4
a).
Protein markers for the cytoplasm and the endoplasmic reticulum
were absent from nuclear preparations (Fig.
3
a). As a second
method for testing the nuclear localization of Sfpq and Pspc1, we
used co-immunostaining, which clearly indicated that Sfpq and
Pspc1 localize in the nucleus, whereas Ago2 is localized in both
compartments (Fig.
3
b). Co-IP experiments confirmed that Ago2
interacts with Sfpq–Pspc1–NonO complex in the nucleoplasm,
but not in the cytoplasm or on chromatin (Fig.
3
c and
Supplementary Fig.
4
b, c). Together, our results indicate that
Sfpq mediates the interaction of both Pspc1 and NonO with
nucleoplasmic miRISC. Therefore, Sfpq appears to mediate the
sequence specificity of this complex to modulate nucleoplasmic
miRISC activity.
Sfpq promotes miRNA binding on a subset of binding sites. To
investigate whether Sfpq associates to all or to a subset of
miR-NAs, we performed an Sfpq RNA-IP experiment in RAW 264.7
cells followed by high-throughput small RNA sequencing analysis
and compared the results with the Ago2 RNA-IP-sequencing data
(Supplementary Data
4
). We found that 224 and 259 mature
miRNAs associated with Sfpq and Ago2, respectively
(Supple-mentary Data
4
and Supplementary Fig.
5
a). All 224 miRNAs
enriched in the Sfpq IP were also associated with Ago2 (Fig.
4
a).
Most of the 35 remaining miRNAs that associated solely with
Ago2 were miRNA passenger strands (Supplementary Data
4
).
Western blot
a
Co-IP from P19 cellsSfpq Ago2 tubulin NonO Pspc1 siCtr siSfpq siNonO siPspc1 – – – + – – – + – – – + – + – – + – – – – – + – + – – – – + – – – + – – + – – – – – + – – – + – 5% Input IP
IgG Ago2 IgG Ago2 IgG Ago2 IgG Ago2
b
RNA-IP from RAW 264.7 cellspre-let-7a let-7a Northern blot pre-let-7a let-7a pre-let-7a let-7a siCtr siSfpq siNonO siPspc1 + – – – – + – – – – – + + – – – + – – – – + – – – – – + – – + – – – + –
5% Input IP-IgG IP-Sfpq
IP-IgG IP-Pspc1 IP-IgG IP-NonO 64 64 50 98 MW kDa 98 20 MW nt 55
Fig. 2 Sfpq mediates the interaction between miRISC and Pspc1 or NonO. a Co-IP of endogenous Ago2 with Sfpq, Pspc1, or NonO from P19 cells. Cells were transfected with the indicated siRNAs and analyzed by Western blotting. Ago2 and tubulin served as controls.b RNA-IP of let-7a with the endogenous Sfpq, Pspc1, or NonO. RAW 264.7 cells were transfected with the indicated siRNAs. Cell extracts were immunoprecipitated with the indicated antibodies and the RNA was purified and analyzed by Northern blotting
Therefore, we concluded that all the miRNAs associated with
Sfpq are functionally active, given that they also associate with
Ago2. These miRNAs include the let-7 family, miR-21, miR-31,
miR-106b, and miR-23b. To validate this analysis, RNA-IP
fol-lowed by either Northern blot or quantitative
reverse-transcriptase PCR (RT-qPCR) analyses in both RAW 264.7 and
HEK293T cells confirmed that let-7a, miR-23b, miR-125b, and
miR-24 associate with Sfpq (Fig.
1
f and Supplementary Figs.
2
d,
5
b). Notably, Sfpq only co-immunoprecipitated with mature
miRNAs, not with precursors. These results indicate that Sfpq
may be involved in the miRNA mode of action but not in miRNA
biogenesis. Indeed, Sfpq knockdown did not affect miRNA
expression or Ago2-loaded miRNA levels (Fig.
4
b). Therefore,
these results prompted us to investigate the possible role of Sfpq
in regulating miRNA activity in gene silencing.
We hypothesized that similar to other RNA-binding proteins,
Sfpq could modulate miRNA-binding activity. To test this
hypothesis, we performed HIgh-Throughput Sequencing of
RNA isolated by CrossLinking IP (HITS-CLIP) on Ago2 in the
presence or absence of Sfpq. We performed this analysis on
ectopically expressed let-7a and endogenous miRNAs in stem
cells. We selected let-7a as a model for the following reasons: (i)
let-7 is the most associated miRNA with Sfpq (Supplementary
Data
4
); (ii) ingenuity pathway analysis from the Sfpq RNA-IP
experiment followed by small RNA sequencing showed an
enrichment of cell cycle and cell development biological processes
(Supplementary Fig.
5
c), and let-7 controls both cell cycle and cell
development
26; (iii) both Sfpq and let-7 control nervous system
development
27,28; and (iv) let-7 has been largely used as a model
to study miRNA biology and biochemistry
29. Although not
expressed in stem cells, let-7 expression is induced upon retinoic
acid (RA) stimulation to promote cell cycle arrest and
differentiation
30. As shown in Fig.
4
c, Sfpq, Pspc1, and NonO
co-immunoprecipitated with mature let-7a in RA-stimulated P19
cells, a cellular model for embryonic stem cells. Therefore, to
investigate the impact of Sfpq on the modulation of
let-7a-binding activity, we conducted HITS-CLIP mapping of Ago2
before and after Sfpq knockdown in let-7a-transfected P19 and
control cells (Supplementary Data
5
). Levels of ectopic
Ago2-loaded let-7a in transfected P19 cells were comparable to that of
endogenous miRNAs (Supplementary Fig.
5
d), and its cellular
localization was similar to that of RA-treated P19 cells
(Supplementary Figs.
4
a,
5
e). Briefly, HITS-CLIP analysis
identified 4202 Ago2-peaks specific for the let-7a condition
(Ago2-let-7a peaks), which were distributed in different parts of
the transcriptome, including the 3′UTR and protein coding
sequence (CDS), as the main target substrates of let-7a
(Supplementary Fig.
6
a and Supplementary Data
5
)
1. To assess
whether Sfpq directly regulates the identified Ago2-let-7a peaks,
we
first mapped the Sfpq-binding sites by comparing the Sfpq
b
a
RA-P19 P19 HEK293T HeLa
Chromatin Nucleoplasm Cytoplasm Chromatin Nucleoplasm Cytoplasm Chromatin Nucleoplasm Cytoplasm Chromatin Nucleoplasm Cytoplasm
Western blot Pspc1 Nono Calreticulin Calnexin RhoGDI H3 Ago2 Sfpq Cellular distribution
c
P19 cells RAW 264.7 cells Co-IP IP-Ago2 IP-Ago2 IP-IgG IP-IgG 5% Input Nucleoplasm 5% Input CytoplasmNucleoplasm Western blot Sfpq Pspc1 IP-Ago2 IP-Ago2 IP-IgG IP-IgG 5% Input Nucleoplasm 5% Input Cytoplasm
NonO
Ago2
Sfpq, Pspc1, and Ago2 cellular localization in RAW 264.7 cells
Sfpq-dapi Ago2-dapi
Immunofluorescence Ago2-Sfpq Ago2-dapi Pspc1-dapi Ago2-Pspc1 64 64 50 98 MW kDa 98 64 22 16 64 64 98 MW kDa 98
Cytoplasm Nucleoplasm Cytoplasm
Fig. 3 Sfpq, Pspc1, and NonO interact with Ago2 in the nucleoplasm. a Immunoblot analysis of chromatin, nucleoplasm, or cytoplasm from HeLa, HEK293T, P19, or RA-treated P19 cells using antibodies directed to the indicated proteins.b Co-immunofluorescence analysis of RAW 264.7 cells stained with the indicated antibodies. Scale bar corresponds to 10μm. c Co-IP of endogenous Ago2 and the indicated proteins from nucleoplasmic or cytoplasmic extracts from RAW 264.7 or P19 cells
HITS-CLIP in siSfpq-transfected P19 cells with
sicontrol-transfected cells. Sfpq peaks identified by HITS-CLIP mainly
co-localized with the Ago2 peaks in the 3′UTR (Supplementary
Data
5
and Supplementary Fig.
6
b). Hence, we calculated the
distance between the Ago2-let-7a peaks and the closest Sfpq
peaks. All the Ago2-let-7a peaks were then grouped into the
following three categories: (1) close to Sfpq peaks, within a
distance of 500 nt; (2) far from Sfpq peaks, between a distance of
500–7000 nt; and (3) very far from Sfpq peaks, with a distance of
7000 nt or more (virtually not bound to Sfpq). We reasoned that
the close distance would provide information about the local and
direct roles of Sfpq in modulating Ago2-binding activity, whereas
RNA-IP from RAW 264.7 cells (microRNAs)
a
Small RNA sequencing
Within 500 nt from Sfpq peaks Between 500 and 7000 from Sfpq peaks
d
Genomic distribution of Sfpq-dependent Ago2-let-7a peaksaccording to the distance between Ago2-let-7a and Sfpq peaks
400 (36%) 11 (1%) 114 (10%) 38 (3%) 306 (27%) 1 (0%) 184 (16%) 70 (6%) 274 (27%) 18 (2%) 140 (14%) 33 (3%) 137 (14%) 13 (1%) 347 (35%) 35 (4%)
More than 7000 nt from Sfpq peaks
HITS-CLIP 114 (14%) 4 (0%) 103 (12%) 26 (3%) 442 (54%) 7 (1%) 107 (13%) 21 (3%) 3′UTR TTS CDS Non-coding RNAs Introns Promoters Intergenic 5′UTR Let-7a Expression levels Quantitative RT-PCR Ago2 RNA-IP siCtr 0.0 0.5 1.0 1.5 2.0 siCtr siSfpq siSfpq
b
0.0 0.5 1.0 1.5 2.0 ns nse
Genomic distribution of Sfpq-dependent Ago2-miRNA peaksaccording to the distance between Ago2-miRNA and Sfpq peaks Between 500 and 7000 from Sfpq peaks HITS-CLIP 3′UTR TTS CDS Non-coding RNAs Introns Promoters Intergenic 5′UTR Within 500 nt from Sfpq peaks
118 (48%) 4 (2%) 46 (19%) 18 (7%) 29 (12%) 3 (1%) 6 (2%) 21 (9%) 85 (37%) 0 (0%) 39 (17%) 4 (2%) 17 (7%) 17 (7%) 66 (29%) 0 (0%)
More than 7000 nt from Sfpq peaks
22 (14%) 7 (5%) 60 (39%) 13 (8%) 4 (3%) 1 (1%) 46 (30%) 1 (1%) pre-let-7a let-7a RA: 5% Input
IgG IgG Sfpq Pspc1 Sfpq Pspc1 Nono
– + – + – – – + + +
Nono
c
Northern blot RNA-IP from P19 cells
Nucleoplasm Cytoplasm Phc3 3′UTR Phlpp2 3′UTR Crct2 3′UTR
g
Ago2 RNA-IP from P19 cells0 0.5 1.0 1.5 0 0.5 1.0 1.5 Quantitative RT-PCR ns ns Quantitative RT-PCR
Lin28a 3′UTR Atf6b 3′UTR Nucleoplasm Cytoplasm Nucleoplasm Cytoplasm
0 5 10 0 5 10 Igf2bp1 3′UTR Dusp1 3′UTR
f
Ago2 RNA-IP from P19 cells0 2 4 8 6 ns 0 2 4 6 ns ns ns siCtr + mimic Ctr let-7a + siCtr siSfpq + mimic Ctr let-7a + siSfpq siCtr + mimic Ctr let-7a + siCtr siSfpq + mimic Ctr let-7a + siSfpq siCtr
siSfpq siCtr siSfpq
2 –ΔΔ Ct 2 –ΔΔ Ct 2 –ΔΔ Ct siCtr + mimic Ctr let-7a + siCtr siSfpq + mimic Ctr let-7a + siSfpq let-7a + siSfpq + rSfpq 0 25 50 100 75
**
*
**
*
0 5 10 20 15**
**
let-7a + siSfpq + mut-Sfpq
siCtr + mimic Ctr let-7a + siCtr siSfpq + mimic Ctr let-7a + siSfpq let-7a + siSfpq + rSfpq 0 10 20 40 30
**
*
**
*
0 2 4 8 6*
**
let-7a + siSfpq + mut-Sfpq
Nucleoplasm Cytoplasm 0 0.7 1.4 2.1 siCtr siSfpq siSfpq + rSfpq siSfpq + mut-Sfpq
** *
0 0.7 1.4 2.1 siCtr siSfpq siSfpq + rSfpq siSfpq + mut-Sfpq** *
Nucleoplasm Cytoplasm 0 0.5 1.0 1.5 siCtr siSfpq siSfpq + rSfpq siSfpq + mut-Sfpq* *
0 0.5 1.0 1.5 siCtr siSfpq siSfpq + rSfpq siSfpq + mut-Sfpq* *
35 224 0 Ago2 Sfpq IP MW nt 55 20far and very far distances would represent indirect effects of Sfpq
knockdown, providing important internal controls for our
analyses. Using this approach, we identified 1134 Ago2-let-7a
peaks that were reduced in the absence of Sfpq, with a close
distance to an Sfpq peak (Supplementary Fig.
6
c). Among them,
only those that mapped in the 3′UTR were significantly enriched
compared with those with far or very far distances from Sfpq
peaks (Fig.
4
d; Fischer exact test p-value
= 2.2E-16 for both
comparisons). To determine whether 500 nt is the critical
distance to define a direct regulation of Ago2-binding activity
by Sfpq, we reasoned that within this distance, but not further, we
should observe a significant reduction in Ago2-let-7a peaks upon
Sfpq knockdown compared to a random distribution of the
distance calculated computationally. Briefly, we divided the
distance between Sfpq peaks and the reduced Ago2-let-7a peaks
upon Sfpq knockdown from 0 to 1000 nt in bins of 250 nt each in
the 3′UTRs. Then, we computationally shuffled 10,000 times the
relative position of Sfpq and the reduced Ago2-let-7a peaks upon
Sfpq knockdown in each bin and calculated the Z-score as a
statistical test (Supplementary Fig.
6
d). This analysis indicated
that (i) at the closest distances between Sfpq and the
Sfpq-dependent Ago2-let-7a peaks, the functional connections between
Ago2 and Sfpq are greater and (ii) that this functional connection
is significant up to a distance of 500 nt. Therefore, these data
suggest that 500 nt is the maximal distance that can be considered
to likely indicate a direct regulation of Ago2-binding activity by
Sfpq. Importantly, among the peaks that are directly controlled by
Sfpq, we found different let-7a-binding sites to those already
validated in the mRNAs encoding for Lin28A
31, Hic2
32, Mier2,
and Igf2bp1
33. Similarly, we found that the direct reduction of the
binding sites for the endogenously expressed miRNAs
(endogen-ous Ago2-miRNA peaks; Supplementary Fig.
6
e)
34in P19 cells
upon Sfpq knockdown statistically only occurred in the 3′UTR
(Fig.
4
e and Supplementary Fig.
6
f; Fischer exact test, p-values
=
3.18E-13 and 9E-13 for the close vs. far distance and close vs. very
far distance comparisons, respectively). Importantly, we found
that 24 and 8.2% of Sfpq-independent Ago2-let-7a peaks and
endogenous Ago2-miRNA peaks, respectively, are located in the
3′UTR within a close distance to Sfpq peaks (<500 nt), suggesting
that only a subset of miRNA-binding sites is directly controlled
by Sfpq. To facilitate the accessibility and correct interpretation of
all our HITS-CLIP results, we created an online database with a
user-friendly interface containing the genomic coordinates for
both the Ago2 and Sfpq peaks in each category we considered
(
http://trabucchilab.unice.fr/SITO/index.php#
).
Together,
this
analysis indicates that the 3′UTR is the substrate by which Sfpq
can directly promote miRNA targeting at selected binding sites.
To validate these results, we performed Ago2 RNA-IP
experiments followed by RT-qPCR. P19 cells were transfected
with let-7a and/or with a different siSfpq from those used for the
HITS-CLIP experiment (Supplementary Fig.
6
g). We separated
the nucleoplasm from the cytoplasm, partially digested the RNA
and performed RNA-IP followed by RT-qPCR from each
compartment. Interestingly, Sfpq knockdown impaired the
activity of let-7a-binding sites on the Lin28A and Igf2bp1 3′
UTRs in both the nucleoplasm and cytoplasm, but not on the
Atf6b and Dusp1 3′UTRs, which were controls for
Sfpq-independent let-7a-binding sites (Fig.
4
f). By incubating the
lysates from the siSfpq-let-7a-transfected cells with the
recombi-nant wild-type Sfpq before RNA digestion, we were able to rescue
this effect (Fig.
4
f). The recombinant Sfpq mutant with L535,
L539, L546, and M549 substituted to alanine was unable to rescue
the miRNA targeting. The alanine mutations were designed to
disrupt Sfpq ability to aggregate but not its binding activity, which
was previously reported
18. These data indicate that Sfpq binding
and aggregation directly promote miRNA targeting at selected
binding sites. Similar data were also obtained in human
NTERA-2 stem cells and for the endogenous stem cell-specific
miR-302b
35, 36in both P19 and NTERA-2 cells (Fig.
4
g and
Supplementary Fig.
6
h). Therefore, these data indicate that Sfpq
directly controls a subset of miRNA-binding sites through local
binding. Despite its nucleoplasmic localization, Sfpq enhances
miRNA-binding activity in both the nucleoplasm and cytoplasm,
suggesting that it promotes a nucleoplasmic commitment of
mRNAs to globally control miRNA targeting.
Sfpq controls mRNA silencing by specific miRNA-binding
sites. To assess whether Sfpq-dependent miRNA targeting
cor-relates with changes in target mRNA gene expression levels, we
analyzed the mRNA expression profile in control and
let-7a-transfected P19 cells upon Sfpq knockdown (Supplementary
Data
6
). Consistent with our HITS-CLIP data, Sfpq knockdown
significantly rescued the magnitude of downregulation of those
transcripts containing direct Sfpq-dependent Ago2-let-7a peaks
in the 3′UTR (Supplementary Fig.
7
a; Wilcoxon test, p-value
=
4E-7), but not for other transcripts containing Sfpq-indirect (far
or very far distances between Ago2-let-7a and Sfpq peaks) or
Sfpq-independent Ago2-let-7a peaks (Supplementary Fig.
7
b).
Because canonical miRNA-binding sites confer a more potent
downregulation
37, we analyzed the rescue of the silencing for the
12 Ago2-let-7a peaks that contain canonical let-7a-binding sites
in the 3′UTR and whose binding is directly promoted by Sfpq,
namely, Lin28A, Igf2bp1, Hic2, Mier2, Notch2, Map1b, Bbx, Skil,
Lamp2, Tmem194, Ash1l, and Gns. As shown in Fig.
5
a, in this
case, the let-7a-mediated silencing and the rescue upon Sfpq
knockdown was more striking than the full set of direct
Sfpq-dependent target 3′UTRs (Wilcoxon test, p-value = 4E-6). This
analysis was validated by performing RT-qPCR analyses on six of
the selected let-7a target mRNAs, including four Sfpq-dependent
and two Sfpq-independent targets, namely, Lin28A, Hic2, Mier2,
Igf2bp1, Atf6b, and Dusp1 (Supplementary Fig.
7
c). This
Fig. 4 Sfpq promotes miRNA targeting at selected binding sites. a Venn diagram of Ago2 or Sfpq RNA-IP-enriched miRNAs found by small RNA sequencing analysis.b Let-7a expression levels (upper panel) and RNA-IP of Ago2 and let-7a (lower panel) in control or siSfpq-transfected RAW 264.7 cells. RNA extracts were analyzed by RT-qPCR. Data are presented as the mean± s.e.m. (n = 6) and normalized to U2 snRNA or the input, respectively. c Sfpq, Pspc1, and NonO interact with mature let-7a in RA-treated P19 cells. Cell extracts were immunoprecipitated with the indicated antibodies and RNA was purified and analyzed by Northern blotting. Genomic distribution of either thed Ago2-let-7a or e endogenous Ago2-miRNA peaks decreased upon Sfpq knockdown, according to the distance to Sfpq peaks by HITS-CLIP analysis. These data show the prevalence of the Sfpq-dependent Ago2 peaks in the 3′ UTR when Sfpq binds closely (<500 nt). RNA-IP of Ago2 and the indicated 3′UTRs for either f let-7a or g the endogenously expressed miR-302b-binding sites. P19 cells were transfected with the indicated molecules. Nucleoplasm and cytoplasm fractions were separated. The indicated cell lysates were incubated with either 100 nM full-length recombinant wild-type Sfpq or the Sfpq-214–598 quadruple mutant (L535A, L539A, L546A, and M549A) for 30 min at room temperature. Before IP, the lysate was partially digested with 10μg ml−1RNase A for 30 min at room temperature. RNA was purified from the immunocomplexes and from 5% of the input and analyzed by RT-qPCR using oligonucleotide probes surrounding the miRNA-binding sites identified by HITS-CLIP. Data are presented as the mean± s.e.m. (n = 3) and normalized to their own inputs. Student’s t-test (for b) or one-way ANOVA followed by Tukey’s post hoc test (for f, g) with *p < 0.05 and **p < 0.01. ns not significant, TTS transcription termination site
validation was performed with a different siRNA from that used
for the transcriptomic analysis. Similarly, Sfpq knockdown
sig-nificantly upregulated the steady-state expression of those
tran-scripts that contain direct Sfpq-dependent Ago2 peaks with
canonical binding sites for the 20 most expressed endogenous
miRNAs in the 3′UTR (Supplementary Fig.
7
d; Wilcoxon test,
p-value
= 0.04769), but not that of the other transcripts containing
indirect Sfpq-independent Ago2 peaks with canonical
miRNA-binding sites (Wilcoxon test, p-value
= 0.07729 for far and 0.9939
for very far distances, respectively; Supplementary Fig.
7
d).
However, no significant upregulation was observed upon Sfpq
knockdown when we considered the whole set of mRNAs with
endogenous Ago2 peaks containing canonical or non-canonical
miRNA-binding sites (Supplementary Fig.
7
e). The absence of
any siSfpq effects on the whole data set of endogenous Ago2
peaks could be due to the very mild downregulation conferred by
endogenous non-canonical miRNA-binding sites
37.
As shown in Fig.
5
b and Supplementary Fig.
8
a, the
downregulation of selected direct Sfpq-dependent mRNAs
targeted by let-7a or by the endogenously expressed miR-302b
was rescued in both the nucleoplasm and cytoplasm by Sfpq
knockdown, but not the Sfpq-independent miRNA-target mRNA
control Atf6b mRNA. Similar results were also obtained in
human NTERA-2 cells (Supplementary Fig.
8
b). This
Sfpq-dependent mechanism of miRNA targeting controls
let-7a-dependent differentiation programs in stem cells (Supplementary
Fig.
8
c). Therefore, these data support the hypothesis that Sfpq
plays a role in regulating miRNA silencing on specific binding
sites, which globally impact miRNA-dependent gene expression
programs.
b
c
d
e
a
Log2(let-7a+siCtr or let-7a+siSfpq/siCtr+mimic Ctr) Microarray
Cumulative fraction
Gene expression profile of mRNAs containing canonical let-7a BS on the 3′UTR bound to Sfpq (within 500 nt of distance)
Lin28a Nucleoplasm Cytoplasm Igf2bp1 Nucleoplasm Cytoplasm 2 –ΔΔ Ct 2 –ΔΔ Ct 2 –ΔΔ Ct Quantitative RT-PCR
Expression levels in P19 cells
0 0.5 1 1.5 0 0.5 1 1.5 Atf6b Nucleoplasm Cytoplasm 0 0.5 1 2 1.5 0 0.5 1 2 1.5 0 0.2 1 1.2 0.8 0.6 0.4 siCtr + mimic Ctr let-7a + siCtr siSfpq + mimic Ctr let-7a + siSfpq
Lin28A mRNA turnover 1.0 0.0 –1.0 –0.5 0.5 1.0 0.4 0.2 0.0 0.6 0.8 2 Nucleoplasm Cytoplasm
Gene reporter assay Lin28A 3′UTR siCtr + mimic Ctr let-7a + siCtr siSfpq + mimic Ctr let-7a + siSfpq siCtr + mimic Ctr let-7a + siCtr siSfpq + mimic Ctr let-7a + siSfpq siCtr + mimic Ctr let-7a + siCtr siSfpq + mimic Ctr let-7a + siSfpq siCtr + mimic Ctr let-7a + siCtr siSfpq + mimic Ctr let-7a + siSfpq siCtr + mimic Ctr let-7a + siCtr siSfpq + mimic Ctr let-7a + siSfpq Expression levels in P19 cells 0 0.2 1 1.2 0.8 0.6 0.4 Western blot ns 0 0.5 1 1.5 ns 0 0.5 1 1.5 0 30 60 90 120 ns ns ns Quantitative RT-PCR
Actinomycin D (min) Actinomycin D (min)
ns 0 0.5 1 1.5 0 30 60 90 120 ns ns ns 0 0.5 1 1.5 ns ns Lin28A tubulin siCtr + mimic Ctr let-7a + siCtr siSfpq + mimic Ctr let-7a + siSfpq FireFly/Renilla 0 0.5 1 2 1.5 siCtr + mimic Ctr let-7a + siCtr siSfpq + mimic Ctr let-7a + siSfpq
siCtr + mimic Ctr let-7a + siCtr siSfpq + mimic Ctr let-7a + siSfpq
MW kDa 36 50
* *
*
*
**
*
*
*
*
*
ns*
ns***
*
***
***
*
*
Fig. 5 Sfpq promotes post-transcriptional silencing mediated by miRNAs in both nucleoplasm and cytoplasm. a Gene expression differences in let-7a-transfected P19 cells upon Sfpq knockdown and control. Differential expression is plotted for mRNAs containing canonical let-7a-binding sites (BS) localized in the 3′UTR within a close distance to Sfpq peaks (<500 nt) and reduced upon Sfpq knockdown. b P19 cells were transfected with the indicated molecules. Nucleoplasm and cytoplasm were separated to measure the expression levels of the indicated let-7a-target mRNAs. RNA was purified and analyzed by RT-qPCR. Data are normalized with U2 snRNA and presented as the mean± s.e.m. (n = 3). c Immunoblot analysis of Lin28A and tubulin in P19 cells transfected with let-7a and/or siSfpq.d Quantitative RT-PCR analysis of the half-life of Lin28A transcript in let-7a-transfected P19 cells compared to control (upper panels) or siSfpq + let-7a-transfected cells compared to siSfpq control (lower panels). Total RNA from either nucleoplasm (left panels) or cytoplasm (right panels) was isolated at the indicated times after addition of actinomycin D. Data are normalized withβ2-microglobulin and presented as the mean± s.e.m. (n = 6). e Relative luciferase activity of reporter constructs containing the mouse Lin28A 3′UTR sequence in HEK293T cells transfected with let-7a and siSfpq as indicated. The data were normalized using Renilla activity and presented as the mean± s.e.m. (n = 4). One-way ANOVA followed by Tukey’s post hoc test: *p < 0.05, **p < 0.01, ns not significant
To further inspect the direct role of Sfpq in controlling miRNA
targeting in cells, we focused on a particular known let-7a target
—the oncogene Lin28A, also known as Lin-28 homolog A, which
regulates the self-renewal of stem cells and cancer stem cells
38.
Sfpq knockdown in either P19 or NTERA-2 cells abrogated the
let-7a-mediated decrease in the steady-state levels of Lin28A
protein in either P19 or NTERA-2 cells (Fig.
5
c and
Supplemen-tary Fig.
9
a). According to a previous work
31, we observed a
shorter half-life for endogenous nucleoplasmic and cytoplasmic
Lin28A mRNA in let-7a-transfected P19 cells compared with the
control cells. This shortened half-life was rescued by Sfpq
knockdown (Fig.
5
d). Nuclear run-on (NRO) experiments
ruled-out a transcriptional modulation of Lin28A by let-7a or
Sfpq (Supplementary Fig.
9
b, c). Overall, these data indicate that
Sfpq globally modulates the Lin28A mRNA turnover rate through
let-7a, resulting in a significant decrease in the steady-state
expression levels of the mRNA protein.
a
b
c
3′UTR TTS CDS Non-coding RNAs Introns Promoters Intergenic 5′UTR 7985 (27%) 301 (1%) 3962 (13%) 151 (1%) 6760 (23%) 1294 (4%)Genomic distribution of Sfpq peaks
20000 15000 10000 5000 0 All 3 ′ UTRs (background) 3 ′ UTRs containing Sfpq peaks 3 ′
UTRs containing Sfpq peaks close
to Ago2-let-7a peaks decrease upon siSfpq
3
′
UTR length
Distribution 3′UTR length containing Sfpq peaks 0 200 400 600 800 1000 45 50 55 60 65 70
Median of peak length per genomic categories
Main features of Sfpq occupancy 3′UTR TTS ncRNA CDS Promoters 5′UTR Introns Intergenic 858 (3%) 8276 (28%) Bits 1 0 2 1 2 3 4 5′ 3′ 1 0 2 1 2 3 4 5′ 53′
Atomic force microscopy
d
e
g
f
Sfpq binding motifs #2 #1 Western blot Sfpq GST CUGU CUGUA CCCCGBSA GST rSfpq BSA GST rSfpq BSA GST rSfpq
UV-crosslinking assay
CUGU CUGUA CCCCG
BSA GST rSfpq BSA GST rSfpq BSA GST rSfpq
0 6%
0 78.25 156.5 234.75 313 391.25
Spatial correlation between recruited and reduced Ago2-let-7a peaks in the
3′UTR upon siSfpq in P19 cells
Absolute distance from query (recruited Ago2-let-7a peaks) to reference (reduced Ago2-let-7a peaks), p< 0.1 5 nm Sfpq aggregates Lin28A 3′UTR Sfpq aggregates Lin28A 3′UTR 5 nm Aggregation of Sfpq onto Lin28A 3′UTR
MW kDa 191 51 97 64 28 39 (nt) Median of distance between consecutive
peaks per genomic categories
Radioactive exposure
Fig. 6 Sfpq aggregates onto long 3′UTRs to modulate the accessibility of miRNA-binding sites. a Genomic distribution of Sfpq peaks by HITS-CLIP analysis. b Scatter plot of length and frequency of Sfpq peaks in different genomic regions. c Distribution of the 3′UTR length of the indicated subpopulation of transcripts.d Result of the bioinformatic analysis for de novo search of Sfpq-binding motif from Sfpq HITS-CLIP data. e UV-crosslinking assay to analyze the interaction of the recombinant Sfpq (100 nM) with the32P-labeled RNA oligonucleotides containing two copies of the CUGU or CUGUA, respectively, but not to the CCCCG negative control sequence.f Top view of two topographic AFM images of typical Sfpq-Lin28A 3′UTR complexes. The color bar on the right represents the height scale with a maximum corresponding to 5 nm. Scale bar corresponds to 20 nm.g Spatial correlation of the recruited Ago2-let-7a peaks compared to the decreased ones. In thex-axis is reported the distance in nt between the reduced and the new recruited peaks on the 3′UTR, whereas in they-axis is reported the percentage of recruited peaks. The black line is the data density, the red bars indicate that the number of recruited peaks is higher than that expected by chance, the blue bars indicate the opposite, whereas the white bars indicate no recruitment
To further confirm the direct involvement of Sfpq in
controlling let-7a silencing activities on the Lin28A 3′UTR, we
used a reporter plasmid in which the Lin28A 3′UTR was cloned
downstream of a luciferase open reading frame. Overexpression
of let-7a significantly reduced the luciferase activity in
HEK293T cells transfected with the reporter plasmid, which
was rescued upon Sfpq knockdown (Fig.
5
e). However, siSfpq
failed to produce any effects on a reporter construct containing
only the six let-7a-binding sites (Supplementary Fig.
9
d) and on
the empty vector (Supplementary Fig.
9
e). By contrast, Sfpq
knockdown also failed to produce any effects on the
miR-125b-mediated downregulation of the Lin28A 3′UTR
39(Supplemen-tary Fig.
9
f), confirming the presence of Sfpq-independent
binding sites even with close Sfpq peaks, which was also observed
by the HITS-CLIP analysis. Moreover, Sfpq-binding activity on
the Lin28A mRNA is independent of let-7a activity
(Supplemen-tary Fig.
9
g). Overall, these data suggest that Sfpq binding to
specific cis-elements on the Lin28A 3′UTR optimizes the
positioning/recruitment of miRNAs to selected binding sites.
Sfpq aggregates on target 3
′UTRs to promote miRNA
target-ing. To gain insights into the mechanism by which Sfpq regulates
specific miRNA-binding sites in the 3′UTR, we investigated the
Sfpq HITS-CLIP data in P19 cells to uncover the presence of any
peculiar feature(s) of Sfpq-binding activity. Briefly, we found
approximately 30,000 Sfpq peaks, with the majority of them
mapping in introns and 3′UTRs (Fig.
6
a). Interestingly, Sfpq
peaks in the 3′UTRs are more elongated and closer to one
another than those that map in other genomic regions (Fig.
6
b).
Transcription termination sites (TTS) and non-coding RNAs
show similar trends, whereas Sfpq peaks in the introns show
opposite features. Additionally, as shown in Fig.
6
c, Sfpq
occu-pancy is enriched in long 3′UTRs compared to the entire 3′UTR
data set (Wilcoxon test, p-value
= 2.2E-16). The 3′UTR length
was even longer when we selected the 3′UTRs that contain at least
one Sfpq peak and Sfpq-dependent let-7a-binding sites
(Wil-coxon test, p-value
= 2.2E-16 compared to the length of
3′UTRs-containing Sfpq peaks). These data suggest that Sfpq
pre-ferentially binds to long 3′UTRs, forming long portions of
occupancy.
Next, we looked for specific Sfpq-binding motifs. Because RRM
domains bind an average of 4 nt
40, we looked for motifs of 4–6 nt
in length in Sfpq peaks from the HITS-CLIP data set. Briefly, we
searched for de novo motifs by dividing the Sfpq HITS-CLIP data
set into the following three groups: (i) all Sfpq peaks; (ii) Sfpq
peaks located in the 3′UTR; and (iii) Sfpq peaks within a close
distance (<500 nt) to the Sfpq-dependent Ago2 peaks. In this
analysis, we have found enriched motifs with a core composed of
the UGU sequence (Supplementary Fig.
10
a). Using motif
clusterization
41, we obtained two 4- and 5 nt-enriched consensus
motifs (Fig.
6
d). To validate these two motifs, we used
recombinant Sfpq and synthetic RNA in UV-crosslinking and
electrophoresis mobility shift (EMSA) assays (Fig.
6
e and
Supplementary Fig.
10
b). BSA, GST, and Ago2, which were used
as controls, did not show any binding activity to the newly
discovered Sfpq-binding sequences; neither did a negative control
sequence with recombinant Sfpq (Fig.
6
e and Supplementary
Fig.
10
b, c). Importantly, these two binding motifs were
significantly enriched in the Sfpq peaks located in the 3′UTR
that map very close to Sfpq-dependent Ago2-let-7a peaks with
respect to all the 3′UTR Sfpq peaks (Fisher exact test, p-value =
2.2E-16).
Because Sfpq aggregates to form polymers on nucleic acids
17,18to facilitate miRNA targeting (Fig.
4
f, g), we hypothesized that the
two Sfpq-binding motifs would serve as substrates to promote
Sfpq aggregation on target 3′UTRs. To test this hypothesis, we
performed Pearson and Spearman correlation tests between the
number of occurrences of binding motifs within the peak
sequences and the peak length. We found a higher positive
correlation in Sfpq peaks that map within 500 nt from
Sfpq-dependent Ago2-let-7a peaks and their length (Spearman
correlation for moti#1: 0.56; Pearson correlation for motif#1:
0.85; Spearman correlation for motif#2: 0.54; and Pearson
correlation for motif#2: 0.79), than in all the Sfpq peaks in the
3′UTR (Spearman correlation for moti#1: 0.55; Pearson
correla-tion for motif#1: 0.72; Spearman correlacorrela-tion for motif#2: 0.48;
and Pearson correlation for motif#2: 0.62), or in all the Sfpq peaks
(Spearman correlation for moti#1: 0.48; Pearson correlation for
motif#1: 0.65; Spearman correlation for motif#2: 0.42; and
Pearson correlation for motif#2: 0.58). This analysis indicated
that the highest frequency of Sfpq-binding sites occurred close to
direct Sfpq-dependent Ago2 peaks, thus supporting the
hypoth-esis that Sfpq has a tendency to form long aggregates that can
ultimately promote the positioning/recruitment of miRNAs on
selected and close binding sites. In fact, the Lin28A 3′UTR
contains 34 Sfpq-binding sites, and recombinant wild-type Sfpq
forms aggregates along its sequence, as we demonstrated using
AFM (Fig.
6
f and Supplementary Fig.
11
a), but not the
recombinant Sfpq-214–598 quadruple mutant (L535A, L539A,
L546A, and M549A), which was unable to aggregate while
binding to the RNA (Supplementary Figs.
10
c,
11
b)
18. BSA did
not bind to Lin28 3′UTR, which is removed from the untreated
muscovite mica surface in the washing step (Supplementary
Fig.
11
c). Furthermore, in support of this conclusion, our
HITS-CLIP analyses demonstrated that 70% of the 3′UTRs in which
Ago2-let-7a peaks are directly controlled by Sfpq (Sfpq peaks
within 500 nt of distance) undergo recruitment of new Ago2
peaks upon Sfpq knockdown, whereas for the endogenous
Ago2-miRNA peaks, this value is 98% (Supplementary Data
7
). Spatial
correlation between the recruited and reduced Ago2 peaks upon
Sfpq knockdown indicated that recruitment mainly occurs close
to the Sfpq-dependent Ago2 peaks (Fig.
6
g). These data suggest
that the presence of Sfpq locally modulates miRNA accessibility/
positioning to specific binding sites by forming aggregates that
may modulate the secondary structure of the target 3′UTR.
Finally, RNA-sequencing analysis of control and
siSfpq-transfected P19 cells ruled out any roles for Sfpq in regulating
alternative splicing or alternative polyadenylation sites in the 3′
UTRs in which Sfpq directly promotes miRNA targeting
(Supplementary Fig.
12
a, b, and Supplementary Data
8
).
Overall, these data indicate that the presence of specific
Sfpq-binding sites determines the fate of a cohort of mRNAs, where
Sfpq forms long aggregates in the 3′UTR to modulate 3′UTR
folding for the proper positioning/recruitment of miRNAs to
selected binding sites, whereas avoiding random binding of
miRNAs that would not be effective.
Discussion
The interplay between miRNAs and RNA-binding proteins has
been dubbed
“the post-transcriptional regulatory code”; by
interacting and competing to binding sites, these
post-transcriptional modulators dictate metabolic impact on cognate
RNAs to regulate stability, localization, and protein synthesis
8.
Our study added Sfpq to the list of other RNA-binding proteins,
including HuR, Pumulio, polypyrimidine tract-binding protein,
cytoplasmic polyadenylation element-binding proteins, Dnd1,
and RNA-binding motif protein 38 (RBM38), that have been
shown to be involved in regulating miRNA targeting in
mam-malian cells
42. In comparison with previous studies where specific
miRNA targeting, we found that Sfpq targets a sizeable subset of
long nuclear 3′UTRs to promote miRNA targeting.
Previous studies have reported the presence of endogenous
miRNA pathway components in the nucleus
6,43,44. According to
these reports, miRNAs are loaded into miRISC in the cytoplasm
and then imported into the nucleus by Importin 8. Indeed,
although miRISC and its factors TNRC6 and the CCR4-NOT
deadenylase complex are localized in the nucleus, miRISC loading
factors, such as Hsp90, are absent
6. Our data indicate that Sfpq
specifically binds to selected long 3′UTRs and forms aggregates
that likely modulate the secondary structure of target 3′UTRs to
promote optimal positioning/recruitment functions of miRISC to
specific binding sites, which leads to miRNA-dependent mRNA
degradation. Because Sfpq interacts in an RNA-dependent
fash-ion only with nucleoplasmic miRISC, but not on the chromatin,
we concluded that Sfpq only associates with miRNA-target
mRNAs post-transcriptionally (Fig.
7
). This mechanism is
con-served across species and in different cell types (Supplementary
Fig.
13
a), indicating that our results have uncovered a general
strategy by which cells possess a specific pathway to control
miRNA targeting in long 3′UTRs via an Sfpq-dependent
mechanism. This
finding contributes to the diversity of miRNA
modes of action and impacts on post-transcriptional gene
expression regulation. Whether the partners of Sfpq, namely,
Pspc1, NonO, and the long non-coding RNA Neat1, are part of
this mechanism is still an open question.
A plethora of observations accumulated over many years
strongly suggest that there is an intimate link between the various
steps in the post-transcriptional gene expression pathway,
including mRNA export, translation, stability, and localization
45.
Here, we demonstrated that nucleoplasmic Sfpq determines the
fate of a sizeable set of mRNAs by acting at the 3′UTR and
influencing both nucleoplasmic and cytoplasmic miRNA
target-ing, including with Lin28A mRNA in stem cells. These data
mechanistically reveal for the
first time an Sfpq-dependent link
between nuclear and cytoplasmic miRNA-dependent silencing
(Fig.
7
). In conclusion, our
findings widen the investigation of
post-transcriptional silencing beyond the traditional cytoplasmic
point of view to include a nucleoplasmic mechanism.
Methods
Proteomic analysis. The antibody we used to immunoprecipitate Ago2 has been extensively used to immunoprecipitate endogenous Ago2 in several HITS-CLIP analyses, including46,47, but it has not been used for MS analysis. IP by IgG and
Long 3′UTR Sfpq-dependent miRNA-binding site Nuclear degradation Short 3′UTR CDS Ago2 Ago2 Ago2 Ago2 Ago2 Ago2 CDS CDS Nascent RNA DNA Nucleus Cytoplasm Sfpq-dependent miRNA targeting program Sfpq Sfpq-independent miRNA targeting program CDS Sfpq-independent miRNA binding site Sfpq-independent
miRNA binding site
Pol2 Cytoplasmic degradation 3′UTR 3′UTR CDS Nuclear degradation Cytoplasmic degradation Sfpq-independent of miRNA-mediated gene expression Sfpq-dependent of miRNA-mediated gene expression