HAL Id: hal-00872587
https://hal.archives-ouvertes.fr/hal-00872587
Submitted on 14 Oct 2013HAL is a multi-disciplinary open access
archive for the deposit and dissemination of sci-entific research documents, whether they are pub-lished or not. The documents may come from teaching and research institutions in France or
L’archive ouverte pluridisciplinaire HAL, est destinée au dépôt et à la diffusion de documents scientifiques de niveau recherche, publiés ou non, émanant des établissements d’enseignement et de recherche français ou étrangers, des laboratoires
fluid to measure viscosity and Navier slip length
Pierre Gilormini, Hubert Teyssèdre
To cite this version:
Pierre Gilormini, Hubert Teyssèdre. On using the leveling of the free surface of a Newtonian fluid to measure viscosity and Navier slip length. Proceedings of the Royal Society A: Mathematical, Physical and Engineering Sciences, Royal Society, The, 2013, 469 (2160), pp.6-24. �10.1098/rspa.2013.0457�. �hal-00872587�
This is an author-deposited version published in: http://sam.ensam.eu
Handle ID: .http://hdl.handle.net/10985/7394
To cite this version :
Pierre GILORMINI, Hubert TEYSSÈDRE - On using the leveling of the free surface of a
Newtonian fluid to measure viscosity and Navier slip length - Proceedings of the Royal Society A - Vol. 469, n°2160, p.6-24 - 2013
Science Arts & Métiers (SAM)
is an open access repository that collects the work of Arts et Métiers ParisTech researchers and makes it freely available over the web where possible.
This is an author-deposited version published in: http://sam.ensam.eu
Handle ID: .http://hdl.handle.net/null
To cite this version :
Pierre GILORMINI, Hubert TEYSSÈDRE - On using the leveling of the free surface of a
Newtonian fluid to measure viscosity and Navier slip length - Proceedings of the Royal Society A - Vol. 469, p.20130457 - 2013
On using the leveling of the free surface of a
Newtonian fluid to measure viscosity and Navier
slip length
P. Gilormini
∗1and H. Teyss`edre
2
1
PIMM, Arts et M´etiers ParisTech, CNRS, Paris, France
2Silsef, Archamps, and CEA/LETI, Grenoble, France
Abstract
Measuring the relaxation time involved in the leveling of the free sur- face of a Newtonian fluid laid on a substrate can give access to material parameters. It is shown here how most favorable pattern geometries of the free surface and film thicknesses can be defined for the measures of viscosity and Navier slip length at the fluid-solid interface, respectively. Moreover, special emphasis is put on the conditions required to avoid shear-thinning by controling the maximum shear rate. For initially sinu- soidal patterns with infinitesimal amplitudes, an analytical solution in- cluding slip at the fluid-solid interface is used, and numerical simulations based on the natural element method allow to discuss the effect of finite amplitudes. This leads to the definition of a relevance domain for the analytical solution that avoids the need for numerical simulations in prac- tical applications. It is also shown how these results can be applied to crenelated profiles, where Fourier series expansion can be used, but with caution.
Keywords polymers, leveling, viscosity, Navier slip, slip length
1 Introduction
Half a century ago, Orchard [1] published a paper where the analytical solution of the surface tension-driven leveling of a sinusoidally corrugated layer of an incompressible Newtonian fluid was given. The analysis, which covered layers of arbitrary thicknesses and mentioned brushmarks in paint coatings as an ap- plication, included the effect of gravity for a horizontal layer, but this restriction
∗E-mail: pierre.gilormini@ensam.eu
was overtaken in a later article by the same author [2] on inclined substrates. Apparently, these papers stayed unnoticed by the physics community and are not mentioned in Ja¨ckle’s later work [3], where viscoelastic behaviors are also included, still with the limitation to corrugations of infinitesimal amplitudes. In contrast, large amplitudes were accounted for in the numerical simulations by Degani and Gutfinger [4] and by Kheshgi and Scriven [5], who applied finite difference and finite element methods to Newtonian fluids, respectively, and in the finite element computations of Keunings and Bousfield [6] for viscoelastic behaviors. No slip was allowed at the fluid-substrate interface in all these works, but Henle and Levine [7] have recently extended Orchard’s solution to Navier slip at the interface between the substrate and a layer of Newtonian or Maxwell fluid, with even a double fluid layer. The possibility of slip at a fluid-solid in- terface, that Navier [8] suggested at the very beginning of fluid mechanics as a linear law that stayed unused for decades, is increasingly considered in mi- crofluidics [9]. A likely reason is the very small value of the slip length, which can be neglected in flows at the macro scale, where the usual no slip condition is preferred, but which becomes comparatively large at very small scales. Slip at fluid-solid interfaces is also mentioned in the literatures on moving contact lines [10] and on polymer injection [11]. A problem is still to measure the slip length precisely, and various elaborate techniques have been proposed [12]. It is the purpose of this paper to suggest a new and simple method to measure the slip length by studying the leveling of the free surface of the fluid of interest laid on the appropriate substrate. This requires a preliminary knowledge of the fluid viscosity, which can be obtained by applying the same method with a different geometry. Actually, leveling has already been used to measure vis- cosity ([13] and [14], for instance), assuming no slip at the fluid-solid interface and refering to the analytical solution for free surface profiles with infinitesimal amplitudes, but without an evaluation of the approximations involved. This point is analyzed here.
The remainder of the paper is organized as follows. Section 2 extends the analytical solution of Orchard [1] to slip at the fluid-solid interface in the special case where gravity can be neglected for the Stokes flow of a Newtonian fluid, as is usual in microfluidics and nanofluidics [15]. This allows to define most favorable geometries for the measures of viscosity and slip length, with special emphasis put on the conditions required to avoid shear-thinning by controling the maximum shear rate. Section 3 discusses the assumption of an infinitesimal amplitude by using numerical simulations based on the natural element method. This delimits the relevance of the analytical solution and avoids the need for nu- merical simulations in practical applications with non infinitesimal amplitudes. Finally, the extension of the method to non sinusoidal profiles is discussed and illustrated in the case of an initially crenelated free surface in Section 4.
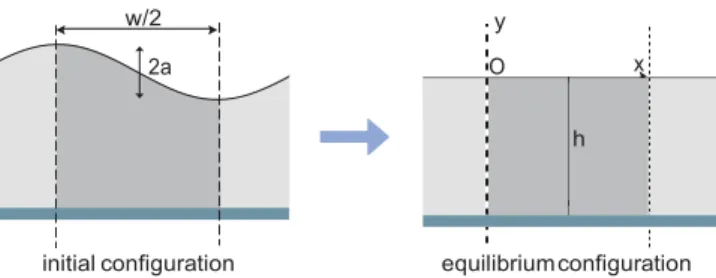
O x h w/2 y 2a
initial configuration equilibrium configuration
Figure 1: Notations used for the geometry of the problem considered with a sinusoidal free surface. For symmetry reasons (dashed lines define symmetry axes), the problem reduces to the dark gray area.
2 Analytical solution for a sinusoidal profile with
an infinitesimal amplitude
2.1 Field equations
Inspired by [1], where no slip at the fluid-substrate boundary was assumed, and by [7], where a viscoelastic fluid was considered, the solution to the two- dimensional surface tension-driven leveling of a sinusoidal free surface with an infinitesimal amplitude can be given in a direct and compact, nonetheless com- plete, manner as follows, for a Newtonian fluid with Navier slip condition at the fluid-solid interface. This presentation of a subcase of the general solution by Henle and Levine [7] involves simpler algebra, without complex numbers for instance, and allows a clear perception of the underlying assumptions. The no- tations used are defined in Fig. 1, where a cross section is shown. Consider the following velocity field in the (x, y) plane:
vx = γak r 2η
(1 − f˜ky − g˜) cosh ky − g˜ky sinh ky γak r
sin kx
vy = − 2η (1 − f˜ky) sinh ky + (f˜ − g˜ky) cosh ky cos kx (1)
with a and w denoting the profile amplitude and wavelength, k = 2π/w, γ is the surface tension and η the viscosity, f˜ and g˜ are non dimensional constants that will be deduced below from boundary conditions. This velocity field can readily be checked to preserve volume and to have a symmetrized gradient that gives the following strain rate components:
E˙xx = −E˙yy = γak
2 r
2η (1 − f˜ky − g˜) cosh ky − g˜ky sinh ky) γak2 r
cos kx
f˜ =
Therefore, the equations of motion for the Stokes flow of a Newtonian fluid with viscosity η, which can be written as
∂p = 2η ∂x ∂E˙xx ∂x + ∂E˙∂y xy and ∂p = 2η ∂y ∂E˙yy ∂y + ∂E˙∂x yx (3)
are fulfilled by the following field of hydrostatic pressure: p = γak2 (f˜sinh ky + g˜ cosh ky) cos kx + p
0 (4)
when using (2), where p0 is a constant to be deduced from boundary conditions. The boundary conditions can now be considered. The x = 0 and x = w/2 = π/k lines are symmetry axes, where vx = 0 is immediately obtained from (1) indeed, as well as E˙xy = 0 from (2), which ensures a zero shear stress. The fluid-substrate interface is defined by y = −h, and two conditions apply: the no penetration relation vy = 0 on the one hand, and the Navier slip law on the other hand, which can be written as
vx = b ∂vx (5) ∂y
for y = −h and any x, since the substrate is fixed, where b denotes the Navier slip length, i.e., the extrapolation length of Brochard-Wyart et al. [16]. The slip length is assumed constant, which may be considered as a first step and allows analytical results. These two conditions lead to the following equations by using (1): (1 + f˜kh) tanh kh = f˜ + g˜kh and r g˜kh − kb(1 + f˜kh − 2g˜) tanh kh = 1 + f˜kh − g˜ + kb(f˜ − g˜kh) (6)
which can be solved to obtain the expressions of the two unknown constants:
− 2k(h + b) + 2kb cosh 2kh + sinh 2kh 1 + 2k2h(h + 2b) + cosh 2kh + 2kb sinh 2kh (7) and g˜ = 1 + cosh 2kh + 2kb sinh 2kh 1 + 2k2h(h + 2b) + cosh 2kh + 2kb sinh 2kh . (8) On the free surface, defined by y = a cos kx, the Young-Laplace equation reduces
to
σxxnx + σxy ny = −γκnx and σyy ny + σyxnx = −γκny (9) where κ = ak2 cos kx/(1 + a2k2 sin2 kx)3/2 denotes the curvature. The compo- nents of the normal vector can be taken as nx = ak sin kx and ny = 1, and the above equations can also be written as:
˜
by expressing the stress components σij with the strain rate and hydrostatic pressure. By taking p0 = 0, which specifies the last unknown, these two relations are fulfilled if the amplitude is much smaller than the wavelength, ak « 1 (which is called an infinitesimal amplitude in this paper), since this gives yk « 1 on the free surface, the curvature linearizes as κ ≈ ak2 cos kx, and therefore
p ≈ γak2g˜ cos kx , E˙xx γak2 ≈ 2η (1 − g˜) cos kx , E˙xy ≈ 0 (11)
yield from (2) and (4). Therefore, all the equations and boundary conditions of the problem are satisfied by the solution defined by (1) combined with (7) and (8), provided that the amplitude of the profile is infinitesimal.
2.2 Profile evolution
The above solution gives the rate of evolution of the maximum height a of the sinusoidal profile (at x = 0):
γak a˙ = vy ≈ − 2η f
(12)
using the ak « 1 condition. Consequently, the amplitude follows an exponential decrease with a relaxation time τ given by
2η τ = γkf˜ = ηw 1 πγ f˜
(13)
if the solution still applies at t > 0, which assumes that a sinusoisal profile is maintained. The same result is readily obtained if the minimum height of the profile (at x = w/2) is used, which is compatible with the profile keeping its sinusoidal shape, but it may be observed that the horizontal velocity on the free surface at x = w/4 is vx ≈ γak(1 − g˜)/(2η), which is not zero and is not expected if the sinusoidal shape is maintained. This point was not discussed in [1], [3], or [7]. As can be deduced from Fig. 2, 1 − g˜ is always positive and is small for either large h/w ratios (thick films), whatever the slip conditions, or for very small h/w ratios (thin films) if the slip length b is small. It may also be noted in Fig. 2 that g˜ does not depend on the slip conditions at the fluid-substrate interface and takes the value 0.695 if h/w = 0.191 (hk = 1.2), as can be derived from (8). This also corresponds to the minimum of g˜ for no slip (b = 0).
For no-slip boundary conditions, the f˜ and g˜ functions given by (7) and (8) coincide with the f and g functions obtained by Orchard [1], hence the notation used here. Moreover, (7) can also be recovered from equation (15) of Henle and Irvine [7] when slip may occur at the interface. The relaxation time given by (13) can be normalized by ηw/(πγ) and thus reduces to 1/f˜. The variations of this normalized relaxation time are illustrated in Fig. 3. As expected, the influence of slip conditions vanishes for thick films, and this applies already for h/w = 1 (this is also true for g˜ in Fig. 2). Of course, the result for infinite
~ norm a lize d rela xat ion time (= 1/f ) 1 0.9 ∞ b/w=0 0 0.8 ~ g 0.01 0.05 0.7
0.1 0.6 0.5 1 ∞ 0.5 0 0.2 0.4 0.6 0.8 1 h/w
Figure 2: Evolution of parameter g˜ of the velocity field, as a function of the h/w aspect ratio, for various slip conditions defined by the b/w ratio.
100
50 b/w=0 30 0.05 0.1 10 0.5 1 5 ∞ 3 0.01 1 0.05 0.1 h/w 0.3 0.5 1
Figure 3: Relaxation time normalized by ηw/(πγ) for the leveling of a sinusoidal profile of infinitesimal amplitude on the surface of a Newtonian fluid, for various slip conditions defined by the b/w ratio. The dashed lines correspond to the limit of very thin films and extreme slip conditions. The results of numerical simulations (symbols) with small but nonzero amplitude (a/h = 0.05) are also shown.
ηw2
layer thicknesses recovers the classical expression τ = ηw/(πγ) that can be worked out from p. 548 of [17] and that is always exceeded for finite thicknesses, whatever the slip conditions.
The relaxation time decreases when slip length increases, since this favours flow near the interface (it is recalled that b → ∞ corresponds to perfect slip with zero shear stress), and the difference between extreme slip conditions increases notably for very thin films, reaching a ratio of 8.9 between relaxation times for h/w = 0.05 for instance. This means that evaluating viscosity by measuring relaxation time may lead to significant errors if thin films are considered and slip conditions have not been recognized formerly. More precisely, the viscosity is underestimated if it is deduced from a no slip analysis whereas the actual slip length between the fluid and the substrate considered is not zero.
The limit for very thin films h/w « 1 is obtained from (13) and (7) as 3 ηw4 1
τ = (14)
16π4 γh3 1 + 3b/h
when b is bounded, and is shown on the left side of Fig. 3 for b = 0 (dashed straight line with a slope of −3), which illustrates that h/w « 1 is not a good approximation when h/w = 0.05, for instance. In contrast, the perfect slip case (b → ∞) for very thin films, i.e., τ = (w/h)/π, gives a very good approximation of the relaxation time for moderate film thicknesses (dashed straight line with a slope of −1 in Fig. 3). Obtaining the correct result, even for no slip, is not trivial since de Gennes et al. [18], using a simplified analysis, missed the leading constant and overestimated the relaxation time by a factor of 520 in the application given in page 114 of [18], consequently. These authors do also mention the correct formula, but without any derivation or reference, though.
2.3 Maximum strain rate
The analytical solution given above assumes the fluid has a Newtonian behavior, but this may be unfounded if high strain rates develop somewhere in the flow. In such cases, the fluid would more likely have a shear-thinning behavior, with a transition to a Newtonian behavior below a critical shear rate, as pertains when a polymer obeys a Carreau-Yasuda law, for instance. Therefore, the objective of this subsection is to evaluate the largest shear rate that appears in the flow defined by the analytical solution, in order to circumscribe its applicability.
The analysis follows the same lines as in [1], but with the slip length as an
additional parameter. The generalized shear rate γ˙ = /2E˙ij E˙ij can be evaluated from (2), which leads to
2
γ˙ γ˙ ref
= α(y)2 sin2 kx + β(y)2 cos2 kx (15)
with the reference shear rate being defined as γ˙ ref = 4π2 γa
ηw2
and with
α(y) = (1 − f˜ky − g˜) sinh ky − g˜ky cosh ky and
β(y) = (1 − f˜ky − g˜) cosh ky − g˜ky sinh ky . (17) Therefore, an extremum of the generalized shear rate is obtained when
1
α(y)2 − β(y)2l sin 2kx = 0 (18)
with three possibilities: either cos kx = 0, or sin kx = 0, or α(y) = β(y), inasmuch as α(y) = −β(y) can be shown to have no negative root. In the first case, where γ˙ /γ˙ ref = |α(y)| applies, an extremum is reached below an inflection point of the free surface (where the film thickness is equal to h) and its depth can be obtained by looking for the maximum of α(y), which can be performed numerically. In the second case, the extremum is reached simultaneously at the same depth below a crest and below a trough of the free surface, γ˙ /γ˙ ref = |β(y)| is relevant and the maximum of the β(y) function has to be found numerically. In the third and last case, an extremum is obtained at a depth
w y = − 1 − g˜
(19) 2π g˜ − f˜
for any x value, where the generalized shear rate is such that γ˙ γ˙ ref = g˜ 1 − g˜ g˜ − f˜ exp 1 − g˜ − g˜ − f˜ . (20)
It may be noticed that, for no slip at the interface, this result differs from what was obtained by Orchard [1], but without consequence since this case is never selected when ordering the extrema obtained in the three possibilities above to get the overall maximum, whatever the slip conditions. This selection procedure generates the curves presented in Fig. 4. The curve for b = 0 coincides with the results of [1], where case 1 introduced above applies on the left side of the cusp and case 2 on the right side, but it can be observed that allowing slip at the interface leads to complex evolutions. As expected, the influence of slip vanishes for thick layers, and here again this applies for h/w ≥ 1. In these conditions, the maximum γ˙ /γ˙ ref = 1/e ≈ 0.368, where e denotes the base of the natural logarithm, is reached at a depth of w/(2π). Quite remarkably, the influence of slip is found to vanish also for a finite aspect ratio h/w = 0.388, where γ˙ /γ˙ ref = 0.431, which defines a point where all curves intersect in Fig. 4. Interestingly, the influence of slip conditions is very limited if h/w is larger than 0.388, but it is much more apparent for thinner layers, with the largest normalized strain rate value, γ˙ /γ˙ ref = 0.552, being obained for h/w = 0.191 with perfect slip. Therefore, the following evaluation of an upper bound of the generalized shear rate can be used when slip conditions are unknown:
ma x. no rm aliz ed s tr ain ra te OO 0.6 0.5 10 1 0.4 b/w=0
0.1
0.01 0.3 0.2 0.1 0 0 0.2 0.4 0.6 0.8 1 h/w
Figure 4: Maximum generalized strain rate, normalized by 4π2γa/(ηw2), reached below the free surface for various slip conditions defined by the b/w ratio.
for a fluid layer with average thickness h, viscosity η and surface tension γ, and for an initial sinusoidal profile with wavelength w and amplitude a (assumed small). The initial profile only is considered because amplitude decreases with time and, consequently, strain rate decreases too.
2.4 Discussion
An application of the leveling of a sinusoidal profile on a polymer film may be the evaluation of such material parameters as viscosity and slip length by measuring relaxation time. We consider here that the analytical solution described above applies, which requires that the polymer have a Newtonian behavior, that the amplitude be very small, and that the profile keep its sinuoidal shape during leveling. Surface tension γ is assumed to be known, but the discussion below about measuring η can be adapted readily if viscosity is known and surface tension is looked for, since these two quantities come into play through the η/γ ratio everywhere in the analysis.
Consider first that slip conditions are unknown and viscosity is to be mea- sured. Obviously, Fig. 3 indicates that the geometry of choice is thick layers, for slip conditions have no influence in such cases, and a good compromise is chosing a layer thickness that is equal to the profile wavelength. The viscosity is obtained from η = π γ τ /w, and one may wish to analyze the effect of very thin layers on viscosity, expecting a possible confinement effect like in Teisseire et al. [19] for instance, by considering very small wavelengths w (and, accord- ingly, small thicknesses h), keeping in mind that the present analysis neglects Van der Waals interactions that may be significant for very thin films. This will
be limited first by relaxation times being shorter for smaller wavelengths, and therefore being more difficult to measure precisely. Moreover, a Newtonian be- havior may be relevant only if the strain rate does not exceed a critical value γ˙ c defined by the specific polymer used. Combining (21) and the simple expression of the maximum strain rate found in thick layers, this gives a condition to be fulfilled by the initial amplitude:
a < 0.069 ηw2 γ γ˙ c (22)
which excludes too small wavelengths w (and, therefore, small thicknesses) be- cause measuring a relaxation time amounts to following the amplitude decrease, which may be very imprecise for too small initial amplitudes.
Consider now that viscosity is known and slip length is to be deduced from relaxation time. A good sensitivity will be obtained if the latter, given by (13) combined with (7), is affected significantly by slip conditions, and this is obtained for h/w below 0.1, where the extreme relaxation times vary by a factor of 3.2, as suggested by Fig. 3. Chosing h/w = 0.05 is even better, because this factor is 8.9 and also because relaxation times are longer when h/w is smaller, which allows more precise measurements. This suggests using long profile wavelengths, but it may also be noted that the distribution of the curves in Fig. 3 is very uneven when b/w varies, and the best sensitivity in the measure of b will be obtained for, say, b/w between 0.01 and 1. If the slip length is expected to be small, this means that the wavelength should not exceed 100 times the slip length and, accordingly, the film thickness should be about 5 times the slip length. Here again, the amplitude may be limited by the requirement of a Newtonian behavior, and (21) implies that
ηw2 a < 0.046
γ γ˙ c (23)
which excludes too small w values in order to have perceptible amplitude evo- lutions.
This discussion assumed that the amplitude is small enough for the analysis to apply, but also not too small for a measure to be possible, and that a sinu- soidal shape is maintained during leveling. The validity of these assumptions is investigated with numerical simulations in the following section.
3 Numerical simulations for a sinusoidal profile
with a nonzero amplitude
A simulation code has been written [20], which applies the natural element method (NEM) to two-dimensional and incompressible Stokes flows. The NEM is a natural neighbor Galerkin method that has already been applied to fluid dynamics by Mart´ınez et al. [21] and Gonz´alez et al. [22], for instance. The
variational formulation that we use includes Navier slip along fluid-solid inter- faces and exploits the method of Ruschak [23] to circumvent the computation of surface curvature in the application of the Young-Laplace equation when the flow is two-dimensional. Our implementation uses a mixed formulation, where three variables are introduced at each node, namely two velocity components and a pressure value. The nodes are scattered in the fluid domain and along its boundary, using the free mesh generator developed by Geuzaine and Remacle [24], and a Vorono¨ı cell results around each node. The integrations over the fluid domain involved in the variational formulation are performed by summing the integrals computed over all Vorono¨ı cells. The velocity components are interpo- lated with the Sibson [25] continuous interpolant and integration is performed with the stabilized conforming nodal integration scheme defined by Chen et al. [26], whereas the pressure is taken constant over each Vorono¨ı cell. The integration procedure is simpler along the boundary of the fluid domain, since velocities vary linearly between adjacent nodes in the C-NEM variant [27] that we use and that applies to non convex free surfaces as well. The simulation pro- ceeds incrementally, by updating the nodal positions from the velocities with a simple explicit scheme, which implies that small time steps are used.
3.1 Large amplitudes
A first validation of the code is provided by comparison with the Lagrangian finite element results of Keunings and Bousfield [6], where the amplitude of the sinusoidal profile is very large and there is no slip at the interface. Three cases are considered, where a/h = 0.5 for a thickness of h/w = 0.05, a/h = 0.8 for h/w = 0.16, and a/h = 0.5 for h/w = 0.5. The histories of the maximum and minimum thicknesses are reported in Fig. 5, using the same normalizations as in [6]: thicknesses are normalized by the average thickness of the film, and time is normalized by the relaxation time (14) that would apply for very thin films with no slip (b = 0). This allows direct comparison with figures 3, 4 and 5 of [6], and an excellent agreement is observed. This comment also applies to Fig. 5a of this paper and figure 5b of Kheshgi and Scriven [5], who used another finite element scheme. As already noted in [5] and [6], the crests of the profile always level out more rapidly than the troughs (see Fig. 5), which is clearly incompatible with a sustained sinusoidal profile. This is consistent with the movement of the initial inflection point of the profile, which translates in the direction of the nearest trough, as noted by Khesghi and Scriven [5].
The effect of slip was not considered in [6] and [5], and therefore the limit case of perfect slip is included in Fig. 5. Similarly to the trend already observed in Fig. 3 for infinitesimal amplitudes, the effect of slip decreases when h/w increases, and it has almost vanished in Fig. 5c for h/w = 0.5. The same remarks as for the no slip case apply, and the seemingly better agreement with the analytical solution (in Fig. 5a, for instance) is due to the same normalized time being used to make the comparison between slip conditions consistent. By comparing with the analytical solution for infinitesimal amplitudes, shown as dashed lines in Fig. 5, it can be noticed that the evolutions of the highest and
ma ximum th ic knes s max imum th ic knes s max imum th ic knes s mini mum thickn es s mini m u m th ic knes s mini mum thickn es s 1 1 1.1 perfect slip 0.9 1.2 0.8 1.3 no slip 0.7 1.4 0.6 1.5 0.5 (a) 0 0.5 1 1.5 2 2.5 normalized time
1 1 1.1 0.9 1.2 1.3 perfect slip 0.8 0.7 1.4 no slip 0.6 1.5 0.5 1.6 0.4 1.7 0.3
(b) 1.8 0 1 2 3 4 5 6 7 normalized time 0.2 1 1 1.1
1.2 perfect slip
perfect slip no slip 0.9
0.8
1.3 no slip perfectslip
0.7 no slip 1.4 0.6 1.5 0.5 (c) 0 10 20 30 40 50 60 normalized time
Figure 5: Histories of the maximum and minimum film thicknesses when (a) a/h = 0.5 for h/w = 0.05, (b) a/h =102.8 for h/w = 0.16, and (c) a/h = 0.5 for h/w = 0.5. Thicknesses are normalized by h and time is normalized by the relaxation time (14) that would apply for very thin films with no slip. Dashed lines: analytical result for infinitesimal amplitudes. Horizontal dotted lines refer to a profile decay by a factor of 1/e.
lowest points do not obey an exponential law, which is especially evident for the sigmoidal evolution of the lowest point. Therefore, a relaxation time is not relevant for such large amplitudes. One may nevertheless define a relaxation time from the leveling of the initial profile by a factor of 1/e, where e denotes the base of the natural logarithm, which is shown in Fig. 5, and the analytical solution would provide a better prediction for the highest point than for the lowest one with this definition, especially when slip occurs at the interface. The analytical solution provides a more accurate evaluation of the profile decay for much longer times, but with a limited interest for practical applications inasmuch as an almost flat profile is difficult to measure precisely.
3.2 Moderate amplitudes
Another validation of the code is performed by simulating the leveling of small amplitude sinusoidal profiles, namely with a equal to 5 percent of the average layer thickness h. Six values of the h/w ratio have been considered (0.05, 0.07, 0.1, 0.14, 0.2 and 1), with either no slip or perfect slip at the fluid-solid interface, or with a slip length equal to 5 percent of the wavelength. An excellent fit with an exponential law could be performed for the evolution of the amplitude, with a straight line obtained in a semilog plot. The relaxation times obtained are shown in Fig. 3, and a very good agreement is noted with the analytical result. This validates a maintained sinusoidal profile in the analytical solution, since a constant relaxation time means independence with respect to amplitude.
Similarly to the procedure applied for large amplitudes, two relaxation times have been obtained from each simulation actually, for the highest and lowest points, respectively, but the difference is less than 1 percent and is not percep- tible in Fig. 3. This also is consistent with a maintained sinusoidal shape. It may be noted, though, that the uppermost point was found to have system- atically a relaxation time slightly above the analytical result, whereas it was slightly below for the lowest point. Moreover, the displacement of the node that is located initially at the inflection point of the profile is shown in Fig. 6 for h/w = 0.1. Consistently with what was noted in 2.2, this point is not fixed and moves towards the nearest trough of the profile. This is combined with a much smaller vertical displacement below the initial free surface (note that different normalizations are used on the two axes in Fig. 6). In the case of a/h = 0.05, the relative magnitudes of these displacements, which decrease if slip is allowed at the interface, are less that 1.5 percent of the profile wavelength and ampli- tude, respectively, but they increase rapidly for larger profile amplitudes. This disagrees with a simple proportional variation of the initial sinusoidal height, keeping a fixed inflection point.
It has thus been demonstrated that departures from the assumptions of the analytical solution are qualitatively similar for large and small profile ampli- tudes, but with significant quantitative differences. It is therefore possible to define the moderate amplitudes for which the analytical solution, with its pleas- ant ease of use and flexibility with respect to full field numerical simulations, can be applied with reasonable confidence. For this purpose, Fig. 7 shows the evo-
ve rt ic a l d isp lac eme n t (n orma liz ed by a ) 0 -0.005
a/h=0.05 a/h=0.05
a/h=0.10 a/h=0.10 -0.01 -0.015 -0.02 -0.025 -0.03 0 0.005 0.01 0.015 0.02 0.025 horizontal displacement (normalized by w)
Figure 6: Displacements of the node that is located initially at the inflection point of the profile, for h/w = 0.1. Two amplitudes are considered (a/h = 0.05 and a/h = 0.10), with either no slip (solid lines) or perfect slip (dashed lines) at the interface.
lutions of the amplitude of the profile recorded at the highest and lowest points in the case of a thick layer (h/w = 1). This can be compared with Fig. 5c for a similar h/w ratio and different definitions of the axes. Since Fig. 7 is a semilog plot, an exponential decay appears as a straight line. The two points still have similar histories when the initial amplitude is 10 percent of the thickness, as this already applied for a/h = 0.05, but a clear difference is evident for 30 percent. Defining a relaxation time by a 1/e decay, as above, and taking 10 percent as a maximum admissible deviation from the analytical solution, a limit relative amplitude of a/h = 0.11 is obtained from additional simulations. Therefore, it can be concluded that the method discussed in 2.4 to deduce viscosity from re- laxation time can be applied with 10 percent confidence if the initial amplitude of the sinusoidal profile is no more than 11 percent of the film thickness when h/w = 1.
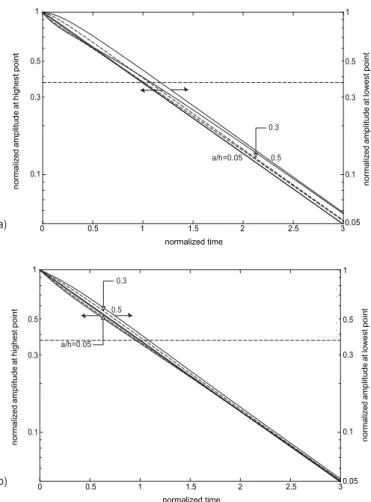
Consider now the other situation mentioned in 2.4, where slip length is to be measured. The h/w = 0.05 aspect ratio was interesting in this respect, and Fig. 8 shows the results obtained for various initial relative amplitudes a/h, when either no slip or perfect slip applies at the interface. It is noticed first that a ratio of a/h = 0.3 is now still close to the solution for an infinitesimal amplitude, with a significant departure for a/h = 0.5. Additional simulations allow to define a limit of a/h = 0.37 to have a relaxation time (be it for the highest or the lowest point of the surface) within 10 percent of the analytical result. Moreover, Fig. 8b confirms that allowing slip at the interface decreases relaxation time and, consequently, the most severe limitations for amplitude apply in the no slip case. A similar procedure has been followed with the
no rmali zed am pl itud e at hi g hes t poi n t no rmali zed am pl itud e at lo west po in t 1 1
0.5 0.5
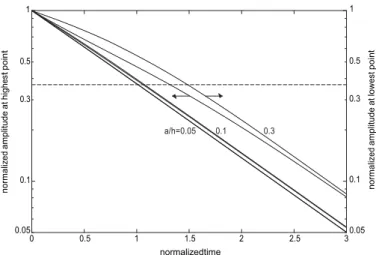
0.3 0.3 a/h=0.05 0.1 0.3 0.1 0.1 0.05 0 0.5 1 1.5 2 2.5 3 normalizedtime 0.05
Figure 7: Histories of the amplitudes at the highest and lowest points of the profile for h/w = 1 and a/h = 0.05, 0.1 and 0.3. Amplitudes are normalized by h and time is normalized by the relaxation time ηw/(πγ) for infinitesimal amplitude and infinite layer thickness. Horizontal dotted line refers to a profile decay by a factor of 1/e.
other aspect ratios considered in Fig. 3 and provided the following limits for the amplitude to have relaxation times at most 10 percent different from the analytical result, whatever the slip conditions: a/h ≤ 0.37 for h/w = 0.07 and h/w = 0.10, a/h ≤ 0.38 for h/w = 0.14, and a/h ≤ 0.36 for h/w = 0.2. Actually, the evolution of the set of values is much more regular if a/w is considered instead of a/h, as shown in Fig. 9, where additional h/w aspect ratios have been included for clarity. If less natural for thin layers, this choice of a/w is fully justified for thick layers, since the influence of h is negligible beyond h = w, with a limit value a/w = 0.115.
In order to finalize our definition of the conditions that can be considered for a reliable measure of relaxation times during the leveling of sinuoidal profiles, it should be mentioned that the maximum generalized shear rate obtained in the numerical simulations were found in very good agreement with the analytical values when small amplitudes (a/h = 0.05) were considered either without slip, or with a Navier slip length such that b/w = 0.05, or with perfect slip. Moreover, equation (21) was still verified for the largest amplitudes considered in Fig. 9.
4 Extension to non sinusoidal profiles
Nanoimprint technology allows surface nanopatterning, but sinusoidal corru- gations are uneasy to obtain, although Hamdorf and Johannsmann [28] and Teisseire et al. [19] did use sinusoidal molds. In contrast, line patterns with crenelated profiles are common in this context, and they were central in the orig-
norm a lized am pli tu d e at high est po in t norm a lized am p lit ud e at hig he st poin t norm a lized am pli tu d e at lo w e st poi nt norm a lized am p lit ud e at lo west poi n t
1 1
0.5 0.5
0.3 0.3 0.3 0.1 a/h=0.05 0.5 0.1 (a) 0 0.5 1 1.5 2 2.5 30.05 normalized time 1 1 0.3 0.5 0.5 0.5 0.3 a/h=0.05 0.3 0.1 0.1 (b) 0 0.5 1 1.5 2 2.5 3 normalized time 0.05
Figure 8: Histories of the amplitudes at the highest and lowest points of the profile for h/w = 0.05 and a/h = 0.05, 0.3 (in dashed lines for clarity) and 0.5, for (a) no slip or (b) perfect slip at the interface. Amplitudes are normalized by h and time is normalized by the relaxation time for an infinitesimal amplitude (13). Horizontal dotted lines refer to a profile decay by a factor of 1/e.
y O x h 0.12 0.1 0.08
a/w 0.06 0.04 0.02
0 0.05 0.1 0.3 0.5 1 3 h/w
Figure 9: Maximum amplitude of a sinusoidal profile for the analytical solution to give the relaxation time (defined for a decrease by 1/e) with less than 10 % error (full symbols). Same criterion fulfilled by square-wave crenelated profiles defined from 100 % (open circles), 75 % (open triangle), or 50 % (open squares) of the amplitudes allowed for sinusoidal profiles.
w w/2 2a
initial configuration equilibrium configuration
Figure 10: Notations used for an initially square-wave crenelated free surface. For symmetry reasons (dashed lines define symmetry axes), the problem reduces to the dark gray area.
=0 '\" (−1)j
inal paper on nanoimprint by Chou et al. [29] for instance, because crenelated molds are easily produced. Consequently, the analysis performed above for sinu- soidal profiles is extended here to initially crenelated profiles. The technique can be applied similarly to any periodic profile, as mentioned by Orchard [1] among others, but the specific example of a square-wave pattern is considered here, which can be defined solely by its wavelength w and amplitude a, in addition to its average level h, as shown in Fig. 10.
Such a free surface can be defined by a Fourier series:
∞ 4 y(x) = a π cos r2π(2j + 1) x 2j + 1 w j (24)
and the analytical solution can be obtained by summing the response obtained for each mode j provided that the amplitude a is infinitesimal. This is allowed because the assumption of an infinitesimal amplitude leads to a surface cur- vature that is proportional to amplitude, as mentioned in 2.1, and therefore all equations and boundary conditions can be fulfilled for each mode. Thus, the evolution of the initially crenelated profile will combine those of initially sinusoidal profiles of wavelength w and amplitude 4a/π, of wavelength w/3 and amplitude 4a/(3π), of wavelength w/5 and amplitude 4a/(5π), and so on, with every other profile shifted by half its wavelength to account for the minus signs in (24). This means for instance that the height change of the point that is located initially in the middle of an upper plateau will be the sum of the height change of the highest point of the sinusoidal profile with wavelength w and amplitude 4a/π, plus the height change of the lowest point of the sinusoidal profile with wavelength w/3 and amplitude 4a/(3π), and so on. This may be important, inasmuch as the evolutions of the highest and lowest points of a si- nusoidal profile may evolve differently when the amplitude is not infinitesimal, as mentioned in 3.1 and 3.2. It may also be noted that all modes have the same amplitude-over-wavelength ratio of 4a/(πw), which facilitates the application of the rules stated at the end of 3.2. In contrast, the modes have increasing thickness-over-wavelength ratios, i.e., decreasing relaxation times, and therefore the amplitude of the profile will not follow an exponential law, even for infinites- imal amplitudes. A representative relaxation time can nevertheless be defined, and is used below, by a 1/e decay of the initial amplitude at a point located in the middle of an upper plateau.
Consider first a crenelated profile with a small aspect ratio, h/w = 0.05, and with the largest amplitude allowed by Fig. 9, namely a/w = 0.019 π/4 = 0.015. Fig. 11 shows the evolutions given by the numerical simulations for the maximum height and depth of the profile, with no slip allowed at the fluid-solid interface. They correspond to points located initially at the centers of upper and lower plateaus, respectively. Both values are equal to the amplitude a of the profile initially, and it can be noticed that they increase before they start decreasing together to zero. A similar hump is also obtained from the Fourier series for infinitesimal amplitudes, as is evident in Fig. 11. Indeed, this Fourier series gives an initial amplitude increase for aspect ratios up to h/w = 0.4,
no rmali ze d he igh t o r d epth 1.2 largest height largest depth 1
0.8
0.6
0.4
0.2
0 0 0.5 1 1.5 2 2.5 3 normalized time
Figure 11: Evolutions of the maximum height and depth of an initially square- wave crenelated profile with h/w = 0.05 and a/w = 0.015, without slip at the fluid-solid interface. Comparison with the analytical Fourier series (dashed curve) and with an initially sinusoidal profile (dotted curve), both with in- finitesimal amplitudes. Height and depth normalized by the initial amplitude, and time normalized by the relaxation time of the sinusoidal profile.
with a decreasing peak value, and this was also observed in our simulations with finite amplitudes. It can also be observed in Fig. 11 that, after the initial hump, the upper part of the profile levels out more rapidly than the lower part, which is consistent with the observations of 3.1 and 3.2 for sinusoidal profiles. The amplitude evolution is slower than for a sinusoidal profile with the same aspect ratio, as also shown in Fig. 11. Finally, it may be noticed in this figure that the relaxation time of the largest height is evaluated by the Fourier series with a very good precision. With h/w and a/w unchanged, Fig. 12 confirms this is also true for other slip conditions, for which shorter relaxation times apply. Therefore, it can be concluded that the analysis of 3.2 can be extended directly to square-wave crenelated profiles as far as the maximum allowable amplitude is concerned, for small h/w aspect ratios. This can be useful for practical applications where slip conditions are investigated. Moreover, the analytical relaxation time can be computed very accurately by using the first two modes only of the Fourier series for such aspect ratios, since the next modes have negligible contributions at this time value, which may help reversing the analytical formulas in an identification procedure.
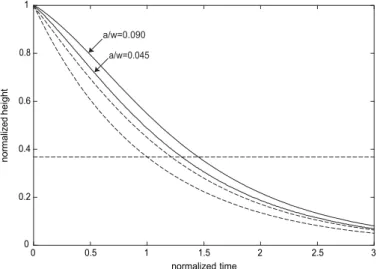
Consider now a crenelated profile with a large aspect ratio, h/w = 1, which has been checked to be unaffected by slip conditions and is relevant to measure viscosity. Numerical simulations using the maximum amplitude that is deduced from Fig. 9, namely a/w = 0.115 π/4 = 0.090, give a representative relaxation time that is more than 10 percent larger than the value given by the Fourier
no rmali ze d he igh t no rmal ize d hei ght 1.2
1 no slip 0.8
0.6 b/w=0.05 0.4
0.2 perfect slip
0 0 0.2 0.4 0.6 0.8 1 normalized time
Figure 12: Evolutions of the maximum height of an initially square-wave crenelated profile with h/w = 0.05 and a/w = 0.015, with various slip con- ditions at the fluid-solid interface. Comparison with the analytical Fourier se- ries (dashed curves) for an infinitesimal amplitude. Same normalization as in Fig. 11. 1 0.8 a/w=0.090 a/w=0.045
0.6 0.4 0.2 0 0 0.5 1 1.5 2 2.5 3 normalized time
Figure 13: Evolutions of the height of an initially square-wave crenelated profile with h/w = 1 and either a/w = 0.090 or a/w = 0.045, without slip at the fluid- solid interface. Comparison with the analytical Fourier series (dashed curve) and with an initially sinusoidal profile (dotted curve), both of infinitesimal am- plitude. Height normalized by the initial amplitude, and time normalized by the relaxation time of the sinusoidal profile.
series for an infinitesimal amplitude, as can be observed in Fig. 13. Therefore, the simple rules obtained for sinusoidal profiles in 3.2 cannot be applied directly for large h/w values. The reason may be some coupling between modes that affects a mere superposition. As shown in Fig. 13, the required precision on relaxation time is obtained nevertheless when the initial amplitude of the crenel is divided by 2, and therefore it is recommended to apply such a reduction if square-wave crenelated profiles are used to measure viscosity. The other h/w values shown in Fig. 9 have also been investigated for square-wave crenelated profiles by using either 100, 75, or 50 percent of the maximum amplitude given by the rules of 3.2. It appears that using 100 percent leads to less than 10 percent difference with the analytical relaxation time up to about h/w = 0.4, and that 50 percent should be used beyond h/w = 0.7, with 75 percent allowed in between. This may be closely related to the specific crenel shape considered here, and extension to other crenel profiles, with lower and upper plateaus of different lengths, or to even more general profiles, should be performed with caution. It is worth mentioning finally that the maximum shear rate recorded in the simulations of crenel leveling reported in Fig. 9 have been found in agreement with condition (21) for small h/w aspect ratios only.
5 Conclusion
It has been shown how most favorable geometries can be defined for the measures of viscosity and Navier slip length from the relaxation time involved in the leveling of the free surface of a Newtonian layer. Special emphasis has been put on the conditions required to avoid shear-thinning by controling the maximum shear rate. For initially sinusoidal patterns with infinitesimal amplitudes, an analytical solution including slip at the fluid-solid interface could be used, and numerical simulations based on the natural element method allowed to discuss the effect of finite amplitudes. This has lead to the definition of a relevance domain of the analytical solution that avoids the need for numerical simulations in practical applications with non infinitesimal amplitudes. It has also been shown how these results can be applied to crenelated profiles, where Fourier series expansion can be used with caution. Of course, all these developments assume implicitly that continuum mechanics applies to the problem considered, and this sets a lower limit to the scale where they apply, below which molecular simulations must be used instead.
Acknowledgment
Support from the Agence Nationale de la Recherche through project SINCRONE is acknowledged. The authors are grateful to L. Illoul for making his C-NEM routines available.
References
[1] Orchard SE. 1962. On surface levelling in viscous liquids and gels. Appl. Sci. Res. 11 451-464.
[2] Orchard SE. 1994. The flow of paint coatings: a hydrodynamic analysis. Prog. Orga. Coatings 23 341-350.
[3] Ja¨ckle J. 1998. The spectrum of surface waves on viscoelastic liquids of arbitrary depth. J. Phys. Condens. Matter 10 7121-7131.
[4] Degani D, Gutfinger C. 1976. A numerical solution of the leveling problem. Comput. Fluids 4 149-155.
[5] Kheshgi HS, Scriven LE. 1988. The evolution of disturbances in horizontal films. Chem. Engng Sci. 43 793-801.
[6] Keunings R, Bousfield DW. 1987. Analysis of surface tension driven leveling in viscoelastic films. J. Non-Newtonian Fluid Mech. 22 219-233.
[7] Henle ML, Levine AJ. 2007. Capillary wave dynamics on supported vis- coelastic films: single and double layers. Phys. Rev. E 75 021604-1-14.
[8] Navier CL. 1823. M´emoire sur les lois du mouvement des fluides. M´em. Acad. Sci. 6 389-440.
[9] Lauga E, Brenner MP, Stone HA. 2005. Microfluidics: the no-slip boundary condition, in: Foss J, Tropea C and Yarin A (Eds.), Handbook of Experi- mental Fluid Mechanics. Springer, 1219-1240.
[10] Shikhmurzaev YD. 2008 Capillary Flows with Forming Interfaces. Boca Raton FL: Chapman & Hall/CRC.
[11] Denn MM. 2001. Extrusion instabilities and wall slip. Ann. Rev. Fluid Mech. 33 265-287.
[12] Neto C, Evans DR, Bonaccurso E, Butt HJ, Craig VSJ. 2005. Boundary slip in Newtonian liquids: a review of experimental studies. Rep. Prog. Phys. 68 2859-2897.
[13] Kim H, Ru¨hm A, Lurio LB, Basu JK, Lal J, Lumma D, Mochrie SGJ, Sinha SK. 2003. Surface dynamics of polymer films. Phys. Rev. Lett. 90 068302-1-4.
[14] Leveder T, Landis S, Chaix N, Davoust L. 2010. Thin polymer films vis- cosity measurements from nanopatterning method. J. Vac. Sci. Technol. B 28 1251-1258.
[15] Karniadakis G, Beskok A, Aluru N. 2005 Microflows and Nanoflows. Fun- damentals and Solutions. Springer.
[16] Brochard-Wyart F, de Gennes PG, Hervert H, Redon C. 1994. Wetting and slippage of polymer melts on semi-ideal surfaces. Langmuir 10 1566-1572. [17] Lamb H. 1895 Hydrodynamics. Cambridge University Press, 2nd Edition. [18] de Gennes PG, Brochard-Wyart F, Qu´er´e D. 2004 Capillary and Wetting
Phenomena – Drops, Bubbles, Pearls, Waves. Springer.
[19] Teisseire J, Revaux A, Foresti M, Barthel E. 2011. Confinement and flow dynamics in thin polymer films for nanoimprint lithography. Appl. Phys. Lett. 98 013106-1-3.
[20] Teyss`edre H, Gilormini P. 2013. Extension of the natural element method to surface tension and wettability for the simulation of polymer flows at the micro and nano scales. J. Non-Newtonian Fluid Mech. 200 9-16.
[21] Mart´ınez MA, Cueto E, Doblar´e M, Chinesta F. 2003. Natural element meshless simulation of flows involving short fiber suspensions. J. Non- Newtonian Fluid Mech. 115 51-78.
[22] Gonz´alez D., Cueto E., Chinesta F., Doblar´e M. 2007. A natural element updated Lagrangian strategy for free-surface fluid dynamics. J. Comput. Phys. 223 127-150.
[23] Ruschak KJ. 1980. A method for incorporating free boundaries with surface tension in finite element fluid-flow simulators. Int. J. Numer. Meth. Engng 15 639-648.
[24] Geuzaine C, Remacle JF. 2009. Gmsh: a three-dimensional finite element mesh generator with built-in pre- and post-processing facilities. Int. J. Nu- mer. Meth. Engng 79 1309-1331.
[25] Sibson R. 1980. A vector identity for the Dirichlet tesselation. Math. Proc. Camb. Phil. Soc. 87 151-155.
[26] Chen JS, Wu CT, Yoon S, You Y. 2001. A stabilized conforming nodal integration for Galerkin mesh-free method. Int. J. Numer. Meth. Engng 50 435-466.
[27] Yvonnet J, Ryckelynck D, Lorong P, Chinesta F. 2004. A new extension of the natural element method for non-convex and discontinuous problems: the constrained natural element method (C-NEM). Int. J. Numer. Meth. Engng 60, 1451-1474.
[28] Hamdorf M, Johannsmann D. 2000. Surface-rheological measurements on glass forming polymers based on the surface tension driven decay of im- printed corrugation gratings. J. Chem. Phys. 112 4262-4270.
[29] Chou SY, Krauss PR, Renstrom PJ. 1995. Imprint of sub-25 nm via and trenches in polymers. J. Appl. Phys. Lett. 67 3114-3116.