HAL Id: hal-00091978
https://hal-insu.archives-ouvertes.fr/hal-00091978
Submitted on 16 Jul 2007HAL is a multi-disciplinary open access archive for the deposit and dissemination of sci-entific research documents, whether they are pub-lished or not. The documents may come from teaching and research institutions in France or abroad, or from public or private research centers.
L’archive ouverte pluridisciplinaire HAL, est destinée au dépôt et à la diffusion de documents scientifiques de niveau recherche, publiés ou non, émanant des établissements d’enseignement et de recherche français ou étrangers, des laboratoires publics ou privés.
Pyrocarbon optical properties in reflected light
Jean-Marie Vallerot, Xavier Bourrat
To cite this version:
Jean-Marie Vallerot, Xavier Bourrat. Pyrocarbon optical properties in reflected light. Carbon, Else-vier, 2006, 44, pp.1565-1571. �10.1016/j.carbon.2005.12.046�. �hal-00091978�
Pyrocarbon optical properties in reflected light
Jean-Marie Vallerota and Xavier Bourratb,
aUniversity Bordeaux 1, Laboratoire des composites Thermo-Structuraux, 3 allée de La
Boetie, F-33 600 Pessac, France
b ISTO CNRS-Université d’Orléans, Institut des Sciences de la Terre d’Orléans, Geosciences
BP 6759, 45067 Orléans cedex 2, France
Keywords: Pyrolytic carbon; Optical microscopy; Modeling; Optical properties
Abstract
A new accurate method is presented for measuring the extinction angle of pyrocarbons and their related anisotropy. The method permits also the extraction of the main optical
parameters. Firstly, it established that the wavelength of the measurement must be controlled. Secondly, the origin of the optical phase shift when a polarized beam is reflected by such an absorbing media is derived. Then, the physical meaning of the extinction angle is discussed on the basis of calculations in an ideal case. The optical phase shift, as well as the ordinary and extraordinary reflectance were obtained by fitting the experimental data to the theoretical model. The reflectance coefficients obtained are very close to those measured by a more common method. Finally, the extinction angle Ae and phase shift are proposed to distinguish the various families of pyrocarbons.
1. Introduction
Carbon materials are usually observed through reflection with an optical microscope, because of their high absorption coefficients in the visible wavelengths. Hence, most of the optical studies on carbon/carbon composites are using reflection on polished samples. When a
transverse cut of a single fiber with its pyrocarbon coating is observed through crossed Nicols, a Maltese’s cross appears in the pyrocarbon. By rotation of the analyser anticlockwise, the quadrant at 45° is extinguished and then becomes bright again [1]. Bourrat et al. [2] defined the extinction angle Ae as the angle value for the minimum of intensity; it is expressed in degrees. Ae depends on the anisotropy of the pyrocarbon. The extinction angle technique is a fast way to distinguish a large numbers of pyrocarbons on the basis of their optical anisotropy. However, the accuracy of the method is limited because of two main reasons. Firstly, the minima in intensity is difficult for the human eye to determine. Secondly, optical indices of graphitic materials are not constant throughout the visible range, so results will change if the illuminant is a cold (xenon) or a hot lamp (halogen).
A new experimental method using a PARISS™ Spectrophotometer coupled with a NIKON™ Eclipse polarized microscope is described, which permits an increase in the spatial resolution,
the selection of one wavelength for the measurement and eliminates human operator’s variability.
The physical meaning of this method was questioned by Oberlin [3] with calculations based on an approximation, neglecting the phase shift, which leads to a theoretical value of 16.4° at 550 nm for graphite. The experimental measurement by eye usually is more than 20°.
Calculations are presented in this work which relate much more precisely the experimental measurements and the physical phenomenon. Optical phase shift, ordinary and extraordinary reflectances can be also deduced from this procedure, and will be compared to those
determined by a more usual way. Accurate value of Ae will be given and discussed for the pyrocarbons studied. A large set of pyrocarbon samples (made with different processes) was gathered for this work.
This publication is the full paper from the proceeding of Vallerot and Bourrat at Carbon’03 [4].
2. Theoretical considerations
The formalism exposed in this part was already developed in the literature for different applications (see for example [5] and [6]). Nevertheless, it seems important to recall briefly the background as it applies in the precise case of the extinction angle procedure.
Let us consider a graphitic material concentrically deposited around a fiber. Experiments and a model are developed for polished cross-sections observed normally to the beam. In this theoretical section, we want to express the intensity of the reflecting beam in the region at 45° of the polarizer when the analyzer is un-crossed from the polarizer with a variable θ angle. The angle between the c axis and the direction of polarization, noted P, is equal to 45°. A linearly polarized beam will be reflected through the two principle directions of the material: in the basal plane and parallel to the c axis. The two reflected waves have different amplitudes and a phase shift. These two waves will interfere after projection in the plane of the analyzer (A) as shown Fig. 1.
From the Fresnel’s equations of a plane polarized wave reflected by an absorbing material, one finds the reflection factor between the incident (Ei) and the reflected (Er) beams:
where and are the complex indices of the incident and reflective media. If the
polarization is perpendicular to the c axis of graphite, if the incident media is air and if no and
ko are the ordinary coefficients of refraction and absorption, Eq. (1) leads to the ordinary
reflectance coefficient Ro and to the optical phase shift o between the incident and the
If the polarization is parallel to the c axis, one finds:
where ne is the extraordinary indice of refraction.
In fact, in the visible, the extraordinary coefficient of absorption is equal to zero. Thus, the phase shift between the ordinary and extraordinary reflected waves is equal to o. This is the
optical phase shift observed when a graphite-like material is observed under crossed Nicols.
If I0 is the amplitude of the incident beam of pulse ω, ye and yo the reflected beams in the two
directions and z1 and z2 the projections of ye and yo in the plane of the analyzer, one finds:
Finally, from Eq. (4) the amplitude I(θ) = z · z* is found to be
where Re and Ro are the extraordinary and ordinary reflectances; Io, the absolute incident
intensity; θ, the rotating angle of the analyzer from the crossed polarization position; λ, the wavelength of the measurement; and δ, the optical phase shift, between the ordinary and extraordinary reflected waves.
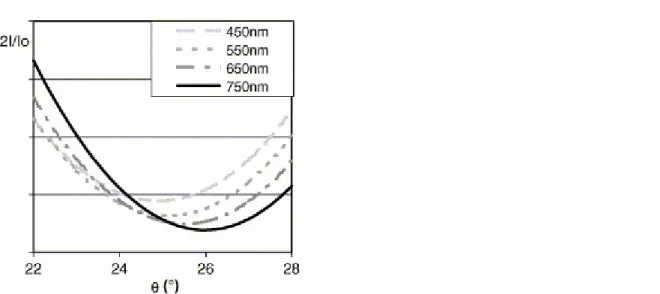
From this equation, the theoretical curve of extinction (2I/Io) can be plotted for several
wavelengths, using the optical indices of graphite measured by Greenaway et al. [7]. Focusing on the 22–28° window, the first minimum of the extinction curve, corresponding to the angle of extinction, is shifted toward higher values as the wavelength increases (Ae = 24° at 450 nm and 26° at 750 nm), Fig. 2.
The value of the extinction angle for graphite or pyrocarbons will therefore vary whether the light source is a halogen or a xenon lamp. This discrepancy has been solved using a
spectrometer mounted on the microscope, allowing the measurement of the extinction curve at 550 nm. All the curves were recorded at 550 nm, since many optical indices of graphitic materials have been measured at this wavelength, for instance by Greenaway et al. [7] and Ergun et al. [8].
An accurate value of Ae is therefore obtained after a fit of the complete curve, Ae corresponding to the first minimum of the function I = f(θ).
Other parameters, Re, Ro and can also be deduced from the extinction curve fit, the absolute
intensity Io being calibrated beforehand.
In order to prevent intensity fluctuations from the light source, Io was calibrated using an
hexagonal-SiC monocrystal orientated along the (0 0 0 1) direction before the analysis of each sample. The reflected intensity was recorded from the SiC specimen from θ = 0 (crossed polars) to θ = π with a π/36 step. The absolute intensity value Io at 550 nm was then given by
where ISiC(θ) is the intensity measured at θ, RSiC is the reflectance coefficient for SiC at
550 nm.
3. Experimental
Various carbon/carbon composites with different kinds of pyrocarbons were studied. These carbons were made by chemical vapor deposition (CVD) and thermal gradient chemical vapor infiltration industrial (TGCVD) or laboratory processes. Transverse cuts of these composites were polished with a semi-automatic polishing machine from STRUERS. The ultimate step was completed with a 1 μm diamond abrasive. Table 1 gathers the origin of each sample. Depending on their reflectance and the aspect of their Maltese cross, pyrocarbons were called rough laminar (RL), regenerative laminar (ReL), smooth laminar (SL) or dark laminar (DL), according to the works of Granoff [9] and Lieberman and Pierson [10] completed by Bourrat et al. [11].
The system used consisted of a NIKON ECLIPSE microscope mounted with a X100 objective (air), an infra-red filter, an halogen light source, and two rotating polarizer/analyzer. The photo-spectrometer is a PARISS™ system, with a Peletier cooled CCD detector. The
resolution was about 0.1 nm at the wavelength, and the analyzed area was 0.162 × 0.255 μm2. A uniform cylindrical layer of pyrocarbon deposited on an isolated fiber is examined from the cross-section of a composite. The selected area of the coating is taken at an angle of π/4 between the growth direction and the incident light polarization (P). The linearly polarized beam is reflected along the two main directions of the material, i.e., parallel, yo and
perpendicular, ye to the basal planes (Fig. 1). The two reflected waves have different
amplitude and phase shift. They both interfere after projection (ye → z1, ye → z2) onto the
Ordinary and extraordinary reflectance coefficients were determined on the transverse cut with the incident beam polarized parallel and perpendicular to the anisotropy plane. The polarization of the incident beam is north–south, so ordinary and extraordinary reflectance coefficients were measured, respectively, at θ = 90° and 0°. The experimental validation is conducted with an objective characterized by a high numerical opening. In these conditions some off axis light can enter the objective. That amount of light was neglected in the calculation.
In addition, the orientation angle of each matrix will be given. These values were obtained by transmission electron microscopy (TEM) using the selected area diffraction technique (SAD), with a 0.1 μm diameter selected on the sample [2]. The angle increases from 25° for the rough laminar up to 90° for the dark laminar pyrocarbon. This value is considered as the reference anisotropy.
4. Results
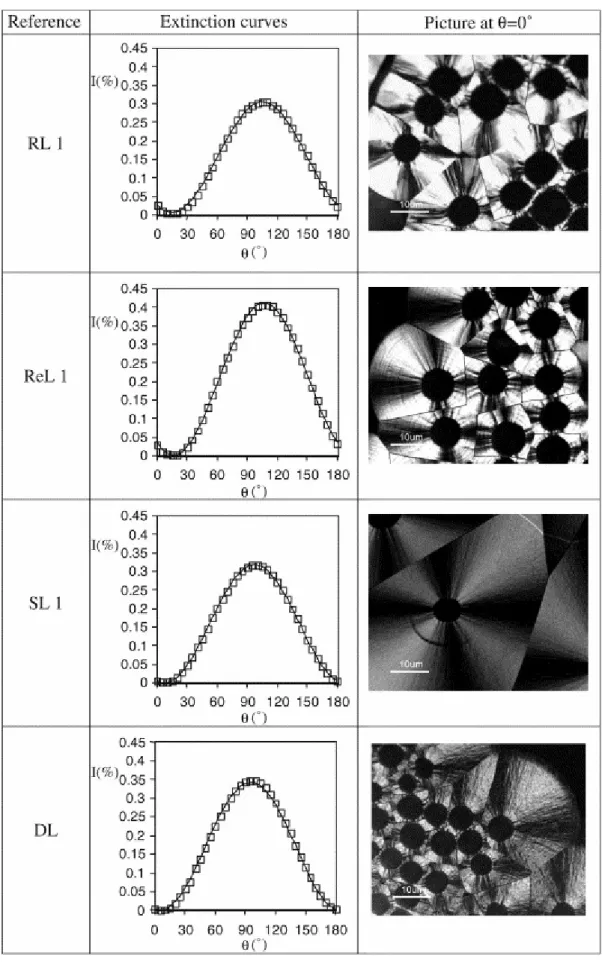
The normalized extinction curves (I(θ)/Io) at 550 nm of the various pyrocarbon materials are
reported in Fig. 3.
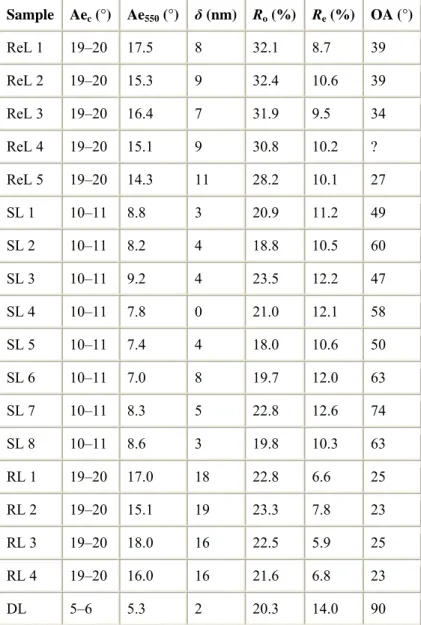
The optical parameters were determined from the fit of the I(θ)/Io functions, i.e., the
extinction angle Ae550 (°), the phase shift δ (nm), the ordinary and extraordinary reflectances
Ro and Re (%). They are listed in Table 2 together with the corresponding OA value (as
measured by SAD). All the extinction curves have a similar shape, in agreement with Eq. (5). However, the positions of the maxima and minima vary from one pyrocarbon to another, as well as the absolute intensity value (higher for ReL than for the other materials).
The extinction angles measured at 550 nm are lower than these visually assessed ones (Aec
usually reaches 20° for anisotropic materials, as shown by Bourrat et al. [2]). The calculated extinction angles increase with the wavelength because of the variation of the optical indices of graphite within the visible range (e.g., the optical indices measured by Greenaway et al. [7]). In the present case, Aec was obtained by means of an Halogen lamp, i.e., at wavelengths
higher than that used for the spectroscopic measurements. This feature indicates that the optical indices of pyrocarbons vary similarly to those of graphite throughout the visible spectrum and that the extinction angle measurement of pyrocarbons should be done at a precise wavelength.
Since the extraordinary absorption coefficient of graphite is equal to zero in the visible [7] and [8], the theoretical optical phase shift of graphite can be calculated thanks to Eq. (6) and expressed as δ, the retardation:
where λ is the wavelength, ni is the index of the medium above the sample (air, water, oil,
etc.) and no and ko are the ordinary refraction and absorption coefficients of graphite or
Optical phase shifts obtained from the extinction curves agree well with the theoretical values for graphite at 550 nm (29 nm in air, when considering the optical indices determined by Greenaway et al. [7], or 41 nm after Ergun et al. [8], see Table 3). Moreover, the experimental values are very close to the optical phase shift measured by Fitz Gerald et al. [12] in
mesophase and graphite using a Berek compensator (48 and 58 nm, respectively). On the other hand, they are significantly lower than the values (270–300 nm) given for pyrocarbons by Oberlin [3] using a λ retarder plate and the Michel-Levy standard table method usually applicable in transmission.
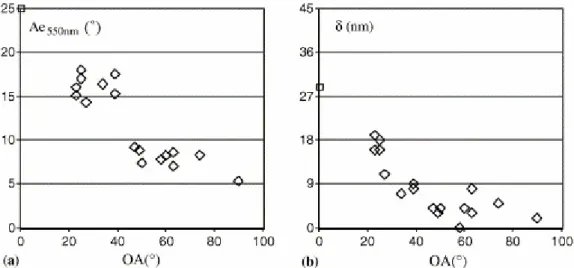
Results from Ae550, Fig. 4a, show three main groups of pyrocarbons.
• 14 < Ae550 < 19° rough and regenerative laminars from different processes all belong to the
anisotropic pyrocarbons, even if their OA values can reach almost 40°.
• 7 < Ae550 < 10 smooth laminars fulfill this condition. Their OA vary from 40° up to 80°.
• Ae550 ≈ 5° dark laminar exhibits the lowest anisotropy of all the pyrocarbons of this study.
Even if values are lower than with the classical technique (Aec) the results are in complete
agreement with previous ones from Bourrat et al. [2]. The traditional way overestimates the value of Ae, but the physical meaning is not questionable: the discrepancy is well understood. The optical phase shift (δ) is also found to vary approximately linearly with the anisotropy as measured by electron diffraction. As δ is the phase shift between the beams reflected along and perpendicular to the graphene planes, its value must decrease, as the anisotropy is
decreasing, from that for graphite down to zero for isotropic materials. This is experimentally verified in Fig. 4b.
Ordinary and extraordinary reflectance coefficients deduced from the extinction curves (Ro
e.c. and Re e.c.) are found to be equivalent to the ones measured by a classical way (Ro cl. and
Re cl.), Fig. 5.
While it must be noted that all regenerative pyrocarbons exhibit a higher ordinary reflectance coefficient, Fig. 5a, there exists no gap in the Re values, Fig. 5b. The gap in the ordinary
reflectance coefficient might explain the Ae = f(OA) step-like diagram of Fig. 4a. ReL pyrocarbons would normally be expected from their OA values, (higher than RL), to exhibit intermediate Ae values from 10° to 14°. However, their high ordinary reflectance coefficients make the extinction angle values greater than 14°. This creates a step in the Ae = f(OA) diagram which suggests that the extinction angle might not be an exclusive function of anisotropy. Complementary works on electronic properties and Raman spectroscopy on the same pyrocarbons [13] indicate that this effect could be related to a sp2+ε rehybridization effect of a great amount of carbon atoms in ReL. Ro is an objective measure for distinguishing
among rough- and regenerative-laminar microstructures that both possess a high Ae value (high anisotropy). Interestingly, rough and regenerative laminar microstructures can be differentiated by measuring the retardation which can be easily measured with a compensator attachment on a regular microscope (Fig. 6 and the discussion in the last part of this paper).
5. Discussion and conclusions
(1) An accurate method for the determination of the extinction angle of pyrocarbons is
described, which is based on the modeling and the fitting of the extinction curve. A theoretical upper limit of 24.8° for the measure is derived from the calculation of the extinction curve of graphite. This agrees with the measurement as the experimental extinction angles reach 18– 19°, taking into account the experimental limitations (e.g., the high numerical opening necessary to collect the signal).
(2) There exists a good correlation between the classical measurement with the eyes (Aec) and
the precise measure at λ = 550 nm with the extinction curve and the spectrometer:
Aec = 1.27 * Ae550. The classical way overestimates the value of Ae but the discrepancy is
well understood. So the classic measure of Ae can be now established as an accurate method with the advantage of being very rapid and obtained on any episcopic microscope equipped with a rotating analyzer.
(3) Three other parameters can be deduced from the extinction curves:
• The ordinary and extraordinary reflectance coefficients. They were found to be close to the values measured by the conventional method.
• The optical phase shift of pyrocarbons. The values obtained are consistent with the
theoretical values for graphite and also consistent with those measured on mesophase with a Berek compensator [12]. It is linearly related to the anisotropy as measured by TEM (OA). (4) Taking into account both the extinction angle, Ae, and phase shift, δ, it is possible to distinguish the main pyrocarbon families, i.e., dark laminar, smooth laminar, regenerative laminar and rough laminar as shown on the plot of Fig. 6. This plot includes all the different processes and pyrocarbons produced at low temperature known up to date. The results show that the different regenerative (ReL) and rough laminars (RL) obtained by different processes and which have a high anisotropy (high Ae) do not all have the same optical retardation δ. Two families can be well distinguished on the basis of their retardation. This is attributed to the nature of the lattice defects present in ReL and well identified by Raman spectroscopy [11] and [13]. Their nature is in line with the different growth mechanisms observed among low-temperature-pyrocarbons [14].
Acknowledgements
The authors thank Snecma Propulsion Solide and CNRS for their grant to JMV, and the ‘Conseil Régional d’Aquitaine’ for financial support for the PARISS™ system acquisition. Professor R. Judd Diefendorf from Clemson University is warmly acknowledged for his teaching us the basis of his technique and a decisive support in this project.
References
[1] Diefendorf RJ, Tokarsky WE. The relationships of structure to properties in graphite fibers Part I. US Air Force report; AFML-TR-72-133, 1972.
[2] X. Bourrat, B. Trouvat, G. Limousin, G. Vignoles and F. Doux, Pyrocarbon anisotropy as measured by electron diffraction and polarized light, J Mater Res 15 (2000), pp. 92–101. [3] A. Oberlin, Pyrocarbons, Carbon 40 (2002) (1), pp. 7–24.
[4] J.M. Vallerot and X. Bourrat, Optical anisotropy measurement of pyrocarbons. In: A. Linares-Solano and D. Cazorla-Amoros, Editors, Proc of CARBON’03 (International
Conference on Carbon) Oviedo Spain 6–10 July 2003, Grupo Espanol del Carbon Publisher
(2003) CD: ISBN 84-607-8305-7.
[5] E.N. Cameron, Ore microscopy, John Wiley Publisher (1961) [chapter 5].
[6] J. Woodrow, B.W. Mott and H.R. Hayes, Analysis of polarized light reflected from absorbing materials at normal incidence, Proc Phys Soc B 56 (1952) (8), pp. 603–615. [7] D.L. Greenaway, G. Harbeke, F. Bassani and E. Tosatti, Anisotropy of the optical constants and the band structure of graphite, Phys Rev 178 (1969) (3), pp. 1340–1348.
[8] S. Ergun, J.B. Yasinsky and J.R. Townsend, Transverse and longitudinal optical properties of graphite, Carbon 5 (1967), pp. 403–408.
[9] B. Granoff, Microstructures of carbon-felt/carbon-matrix composites, Carbon 12 (1974), pp. 681–683.
[10] M.L. Lieberman and H.O. Pierson, Effect of gas phase conditions on resultant matrix pyrocarbons, Carbon 12 (1974), pp. 233–242.
[11] X. Bourrat, A. Fillion, R. Naslain, G. Chollon and M. Brendlé, Regenerative laminar pyrocarbon, Carbon 40 (2002), pp. 2931–2945.
[12] J.D. Fitz Gerald, G.H. Taylor and G.M. Pennock, Microstructure of hydrogenated coal-tar pitches, Carbon 32 (1994), pp. 1389–1395.
[13] Vallerot JM, Bourrat X, Mouchon A, Chollon G. Quantitative structural and textural assessment of laminar pyrocarbons through Raman spectroscopy, electron diffraction and few other techniques. Carbon, in press.
[14] H. Le Poche, X. Bourrat, M.A. Dourges, G.L. Vignoles and F. Langlais, Influence of the gas phase maturation on the CVD/CVI process and the micro-texture of laminar pyrocarbon from propane. In: M. Singh et al., Editors, ACS, Westerville (OH) (2004), pp. 81–86.
Figures
Fig. 1. The incident polarized wave P is reflected in two waves along the two main directions of the graphite. These two waves will interfere onto the plane of the analyzer, rotated by an angle θ from its crossed position.
Fig. 3. Normalized extinction curves of the four main types of pyrocarbons. Experimental points (full squares) are fitted by the full-line curves. Corresponding pictures of the pyrocarbons under crossed polars are also presented.
Fig. 4. Variation (a) of the extinction angle and (b) of the optical phase shift versus the orientation angle. Values of graphite, at OA = 0°, are deduced from the optical constants of Greenaway et al.
Fig. 5. Relations between (a) the ordinary and (b) the extraordinary reflectance coefficients determined at 550 nm by means of the extinction curves (e.c.) or by the classical method (cl).
Fig. 6. Plot of the optical phase shift, δ, versus extinction angle Ae550 for the different
Tables
Table 1. : Name and production process of the samples
Sample Process ReL 1 CVD/CVI ReL 2 CVD/CVI ReL 3 CVD/CVI ReL 4 TGCVD ReL 5 CVD/CVI SL 1 CVD/CVI SL 2 CVD/CVI SL 3 CVD/CVI SL 4 CVD/CVI SL 5 CVD/CVI SL 6 CVD/CVI SL 7 CVD/CVI SL 8 CVD/CVI RL 1 CVD/CVI RL 2 CVD/CVI RL 3 CVD/CVI RL 4 CVD/CVI DL CVD/CVI
Table 2. : Ae550, δ, Ro and Re, are deduced from the extinction curves Sample Aec (°) Ae550 (°) δ (nm) Ro (%) Re (%) OA (°) ReL 1 19–20 17.5 8 32.1 8.7 39 ReL 2 19–20 15.3 9 32.4 10.6 39 ReL 3 19–20 16.4 7 31.9 9.5 34 ReL 4 19–20 15.1 9 30.8 10.2 ? ReL 5 19–20 14.3 11 28.2 10.1 27 SL 1 10–11 8.8 3 20.9 11.2 49 SL 2 10–11 8.2 4 18.8 10.5 60 SL 3 10–11 9.2 4 23.5 12.2 47 SL 4 10–11 7.8 0 21.0 12.1 58 SL 5 10–11 7.4 4 18.0 10.6 50 SL 6 10–11 7.0 8 19.7 12.0 63 SL 7 10–11 8.3 5 22.8 12.6 74 SL 8 10–11 8.6 3 19.8 10.3 63 RL 1 19–20 17.0 18 22.8 6.6 25 RL 2 19–20 15.1 19 23.3 7.8 23 RL 3 19–20 18.0 16 22.5 5.9 25 RL 4 19–20 16.0 16 21.6 6.8 23 DL 5–6 5.3 2 20.3 14.0 90
Aec is the classical extinction angle value (visually measured) and OA the orientation angle
(reference anisotropy determined by TEM-SAD).
Table 3. : Retardation δ (nm) calculated for different media in the case of graphite, using absorption coefficients given by Ergun and Greenaway
Media ni index Ergun’s indices Greenaway’s indices
Air 1 41 29
Water 1.334 59 41