HAL Id: hal-03198827
https://hal.archives-ouvertes.fr/hal-03198827
Submitted on 16 Apr 2021
HAL is a multi-disciplinary open access
archive for the deposit and dissemination of
sci-entific research documents, whether they are
pub-lished or not. The documents may come from
teaching and research institutions in France or
abroad, or from public or private research centers.
L’archive ouverte pluridisciplinaire HAL, est
destinée au dépôt et à la diffusion de documents
scientifiques de niveau recherche, publiés ou non,
émanant des établissements d’enseignement et de
recherche français ou étrangers, des laboratoires
publics ou privés.
A model of urban evolution based on innovation
diffusion
Juste Raimbault
To cite this version:
Juste Raimbault. A model of urban evolution based on innovation diffusion. The 2020 Conference on
Artificial Life, Jul 2020, Montreal, Canada. pp.500-508, �10.1162/isal_a_00283�. �hal-03198827�
A model of urban evolution based on innovation diffusion
Juste Raimbault
1,2,31Center for Advanced Spatial Analysis, University College London 2UPS CNRS 3611 ISC-PIF
3UMR CNRS 8504 G´eographie-cit´es
Abstract
The dynamics of urban systems can be understood from an evolutionary perspective, in some sense extending biological and cultural evolution. Models for systems of cities imple-menting elementary evolutionary processes remain however to be investigated. We propose here such a model for urban dynamics at the macroscopic scale, in which the diffusion of innovations between cities captures transformation processes (mutations) and transmission processes (diffusion), using two coupled spatial interaction models. Explorations of the model on synthetic systems of cities show the role of spatial interac-tion and innovainterac-tion diffusion ranges on measures of diversity and utility, and the existence of intermediate ranges yielding an optimal utility. Multi-objective optimization shows how the model produces a compromize between utility and diver-sity. This model paves the way towards more elaborated for-malizations of urban evolution.
Introduction
Urban systems are complex as they combine technical arte-facts with socio-economic dynamics at multiple temporal and spatial scales. An understanding of processes driving their dynamics is an important aspect for shaping sustainable policies, and a sustainable design and management of cities (Lobo et al., 2020). Multiple disciplines and viewpoints have proposed such insights from a complexity perspec-tive (Pumain and Raimbault, 2020), and Artificial Life ap-proaches have shown promising results to study urban sys-tems, both through conceptual contributions such as inter-preting cities through biological metaphors (Batty and Mar-shall, 2009), but also through modeling and simulation for urban growth including cellular automata and evolutionary computation (Raimbault, 2020a).
A stream of research tightly linked to ALife relates to con-cepts of Urban Evolution. These build in a sense on Cul-tural Evolution (Mesoudi, 2001), which aims at understand-ing changes in social knowledge as evolutionary processes involving replication, mutation, selection. It bears similari-ties with biological evolution but is not reducible to it, and for example uses the concept of meme as transmission units comparable to genes. Both biological and cultural evolu-tion can be linked into common frameworks and models,
implying the coupling of different timescales (Bull et al., 2000). In terms of urban studies, the concept of urban evo-lution is less formalized than cultural evoevo-lution and can be understood in multiple ways. Votsis and Haavisto (2019) use the concept of Urban DNA to characterize morphologi-cal properties of cities such as population density or the role of the road network. Similarly, Kaya and B¨olen (2017) de-scribe cities based on their morphological properties as a product of their dynamics. Wu and Silva (2011) link the parameters of a cellular automaton model of urban growth to intrinsic properties of urban regions, which should play a role in their overall evolution. D’Acci (2014) propose an ur-ban genetic code as the way agents cooperate and compete, cities emerging as dynamical equilibria from these interac-tions. In Economic Geography, the concept of co-evolution is used mostly for urban agents such as firms and stakehold-ers (Gong and Hassink, 2019). At the macroscopic scale of urban systems, Pumain (2018) proposes an evolutionary the-ory to study systems of cities as complex adaptive systems, in which interactions between cities play a crucial role. Cor-responding simulation models were proposed with differ-ent thematic focus, for example by Cottineau et al. (2015) with economic exchanges and by Raimbault (2020c) with infrastructure networks. In Urban Design, Batty (2009) in-troduce evolutionary computation to explore possible urban forms. There still however remains a lack of models which would operationalize the concept of urban evolution in a way close to its biological and cultural counterparts, i.e. captur-ing explicitly the fundamental processes of transmission and transformation within differentiating subsystems (Durham, 1991).
Besides, a central concept bridging ALife and evolution with the study of urban systems is the concept of innova-tion diffusion. Within artificially evolved systems, under-standing how innovation emerges and how it diffuses in the population is essential (Bedau et al., 2000). One aspect of open-ended evolution are mechanisms endogeneously pro-ducing novelty. The other way around, artificial societies approaches have also been pinned as a privileged entry for understanding the dynamics of innovation (Zenobia et al.,
2009). In the case of urban systems, Hagerstrand et al. (1968) had already highlighted the role of a hierarchical dif-fusion of innovation between cities in their trajectories. The aforementioned evolutionary urban theory suggests that in-novation cycles and their hierarchical diffusion is a possible explanation for the properties of urban scaling laws (Pumain et al., 2006). Paulus (2004) provides empirical support for this approach by unveiling the co-evolution between eco-nomic functions of urban areas for the French systems of cities, which are closely related to the dynamics of innova-tion. Evolutionary economics also study regional systems of innovation, how it diffuses and the potential existence of spatial spillovers (Uyarra, 2010). At the microscopic scale, several agent-based models of innovation diffusion high-light the role of social and geographical networks, both of which are embedded into urban systems (Zhang and Vorob-eychik, 2019). Daud´e (2004) proposes for example to un-derstand the diffusion of an agricultural innovation within a geographical system using an agent-based model. Thus, the diffusion of innovation is a privileged entry into urban evo-lutionary processes, as it is furthermore tightly linked with other dimensions of urban systems such as the social and economic dimensions (Sonis, 1995).
This paper proposes to tackle the issue of modeling urban evolution by using innovation diffusion processes to capture elementary evolutionary processes. We investigate thus the question to what extent simple models of urban evolution in-tegrating an urban genome can be used to simulate urban dy-namics. Our contribution relies on the following points: (i) we describe a relatively simple model for systems of cities at the macroscopic scales, based on population growth and the diffusion of innovation between cities; (ii) we system-atically explore this model on synthetic systems of cities to extract stylized facts on different indicators including global diversity and utility.
The rest of this paper is organized as follows: in the next section we give the model context and describe it formally. We then present numerical experiments, including internal statistical validation, exploration of the parameter space, and optimization using a multi-objective genetic algorithm. We finally discuss implications of our results and possible future extensions.
Urban evolution model
Rationale
The core idea of the model is to build on a concept of “Ur-ban DNA” which would capture evolution processes as in biological evolution and cultural evolution, i.e. a kind of genome that cities would be exchanging and which would undergo mutation processes. A suitable candidate is to build on the concept of meme introduced in the field of cultural evolution. However, several particularities must be stressed out when working with urban systems. First, they are multi-dimensional implying very different types of agents,
includ-ing physical and technical artefacts (e.g. infrastructures) but also social and economical structures. A comprehen-sive urban genome would include these very different di-mensions. Then, they are multi-scalar in time and space, meaning that evolution processes, if they exist, may occur at different paces and through different elementary carriers. Finally, they are embedded in the geographical space, what structures the way transmission and mutation can occur, but also can strongly change properties of underlying processes (Raimbault et al., 2019). We choose to focus on the last point, considering a model at the macroscopic scale where cities are agents and with a one-dimensional genome, but in which spatial interactions are crucial for the dynamics. More particularly, this model combines two spatial interac-tion models (Fotheringham and O’Kelly, 1989).
Several models have been proposed to simulate the dif-fusion of innovation at microscopic and mesoscopic scales (Kiesling et al., 2012). Blommestein and Nijkamp (1987) describe a model of innovation diffusion and urban dynam-ics with endogenous demand for innovations, but in which the spatial component only influences prices of innovations. Deffuant et al. (2005) give an example of an elaborated model for adoption dynamics at the microscopic level. Ef-fective channels for the diffusion of innovations are multi-ple, and can for example be urban firm linkages (Rozenblat and Pumain, 2007). Pumain and Reuillon (2017) describe a model based on innovation diffusion to explain the emer-gence of the first cities. Favaro and Pumain (2011) study an urban growth model including innovation diffusion at the scale of the urban system. Our model builds on this last framework, extending and adapting it to an urban evolution context. We keep the innovation diffusion and spatial in-teraction processes unchanged, but take a deterministic up-date of populations. The introduction of new innovations is modified to better fit the urban evolution context. Finally, the introduction of indicators to quantify model behavior re-garding different dimensions is a significant extension to the initial model.
In our model, cities are characterized by their size in terms of population. City sizes evolve following a spatial inter-action model taking into account the attractivity of cities. This attractivity is determined by how innovative cities are. Transformation processes are included as mutations, when random innovations appear in cities. Transmission processes (spatial crossover) are included by diffusing innovations be-tween cities. Finally, the existence of subsystems in which evolution can occur comes naturally with the spatial aspect of the model: different regions in space may behave and evolve differently, possibly resulting in the emergence of co-evolution niches (Holland, 2012; Raimbault, 2018c).
Model description
We now formally describe the urban evolution model. A number N of cities are located in the geographical space,
and described in time by their size Pi(t) (which
gener-ally corresponds to population). The geography is captured with a distance matrix dij between cities. We consider a
one-dimensional technological space in which innovations can be introduced, indexed by their order of apparition c. Cities are then also characterized by their innovation profile δc,i(t) ∈ [0; 1] which represents the proportion of
popula-tion having adopted innovapopula-tion c in the city i at time t. We assume exclusivity in the adoption of innovation, i.e. that we always have Pcδc,i(t) = 1. This innovation profile
corresponds to the urban genome. Each innovation has fur-thermore a utility uc > 0which will influence its diffusion
dynamics.
Model dynamics Starting from an initial configuration, the simulation model is iterated in time with the following steps at each time tick:
1. The crossover between urban genomes relies on spatial processes of innovation diffusion. This means that exist-ing innovations are propagated between cities followexist-ing a spatial interaction model given by
δc,i,t= P jp 1 uc c,j,t−1· exp (− dij dI) P c P jp 1 uc c,j,t−1· exp (− dij dI) (1)
where pc,i,t= δc,i,t· PPi(t)
kPk(t)
is the share of total popu-lation adopting c in the city i at time t; dI is the
charac-teristic distance in the spatial innovation model, for which an increase will correspond to a broader spatial diffusion. As the population share is between 0 and 1, higher util-ities will effectively diffuse faster as the exponent 1/uc
is used. In other terms, the inverse of the utility is the coefficient of population in the underlying spatial interac-tion model, and using an exponent is more relevant in that sense.
2. The sizes of cities evolve according to their performance in terms of innovation, i.e. more innovative cities are more attractive. This stage is also deterministic, follow-ing with Pi(t)− Pi(t− 1) = wI·Pj
Vij
<Vij> where wI is
a fixed growth rate, and where the interaction potential is defined by Vij =Pi(t− 1) · Pj(t− 1) (PkPk(t− 1))2 · exp − dij dG · Y c δφc,t c,i,t ! (2) where φc,t =Piδi,c,t· Pi(t− 1)/Pi,cδi,c,t· Pi(t− 1)
is the macroscopic adoption level (globally more adopted innovations will have a higher attractivity); dG is the
characteristic distance for this second spatial interaction model. This model for population dynamics was pro-posed in such a setting by (Raimbault, 2020c) without the additional innovation attractivity term.
3. Finally, mutations in the urban genome (transformation process) corresponds to the introduction of new innova-tions. Each city has an innovation activity β indepen-dent of its size, which corresponds to an intrinsic mutation rate; and will have a probability to innovate function of its size, similar to a Gibrat model (Pumain et al., 2012), as β· (Pi(t)/ maxkPk(t))αI where αIis a hierarchy
expo-nent biasing the innovation towards larger cities. The util-ity for a new innovation is drawn stochastically, following either a normal or log-normal distribution, such that (i) its average corresponds to the current mean of utilities for ex-isting innovations, and (ii) its standard deviation is a fixed parameter σU, which allows controlling the “disruptivity”
of innovations. Urban genomes are modified such that the new innovation has an initial penetration rate r0in the
in-novative city (previous innovation shares are rescaled for this city).
The urban evolution is stopped after a fixed number of steps tf. Note that other stopping criteria such as reaching
a total population, a maximal population for the largest city, or a maximal number of innovations introduced, could be included for other applications of the model.
Synthetic setup Although Raimbault (2018a) proposed to apply the model of Favaro and Pumain (2011) on real sys-tems of cities, we focus our model study here on synthetic systems of cities, in order to isolate intrinsic effects inde-pendently of geographical contingencies. Cities are located randomly in an uniform square space. City sizes follow a Zipf law with exponent α0= 1, i.e. such that Pi(0) = Pimaxα0
(Pumain et al., 2012). We do not modify this initial hier-archy in our experiments. Distances between cities dij are
computed as euclidian distances. We take N = 30 cities, Pmax= 105and tf = 50in our experiments, corresponding
to a regional or small national system of cities, on timescales of the order of a century. According to these approximates scales, we fix wI = 0.005in experiments which gives a
maximal possible growth factor of (1.005)50 = 1.28over
the whole period, in consistence with mature urban systems having relatively slow population growth (Pumain, 1982). Indicators The behavior of the model is quantified through indicators at the macroscopic scale. These should allow extracting stylized facts from the model exploration. We consider the following indicators:
• Average diversity, defined as an Herfindhal diversity in-dex over innovation shares across cities, averaged in time as D = 1 tf+ 1 tf X t=0 1 −X i,c (pc,i,t)2 (3)
Note that other diversity indices could be applied, or a similar be computed on macroscopic adoption shares or
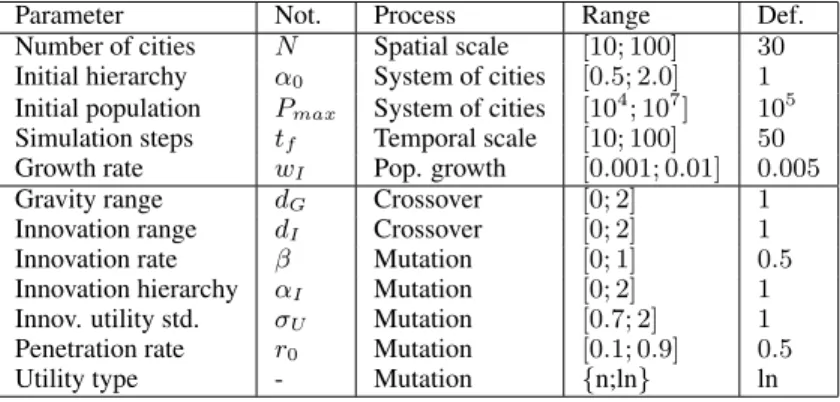
Table 1: Summary of model parameters. We first describe synthetic setup parameters which are fixed during our exper-iments, and then parameters varied during experiments. We give associated process, indicative range and default value for each parameter.
Parameter Not. Process Range Def. Number of cities N Spatial scale [10; 100] 30 Initial hierarchy α0 System of cities [0.5; 2.0] 1
Initial population Pmax System of cities [104; 107] 105
Simulation steps tf Temporal scale [10; 100] 50
Growth rate wI Pop. growth [0.001; 0.01] 0.005
Gravity range dG Crossover [0; 2] 1
Innovation range dI Crossover [0; 2] 1
Innovation rate β Mutation [0; 1] 0.5 Innovation hierarchy αI Mutation [0; 2] 1
Innov. utility std. σU Mutation [0.7; 2] 1
Penetration rate r0 Mutation [0.1; 0.9] 0.5
Utility type - Mutation {n;ln} ln
within each city, and would yield different results. This one has the advantage to combine the diversity within and across cities.
• Average utility, given by the weighted average of innova-tion utilities, averaged in time, as
U = 1 tf+ 1 tf X t=0 X i,c δc,i,tuc (4)
• Innovativity, given by the average number of innovations per city and unit of time I = max c
N·(tf+1).
• To quantify the trajectories of city populations, many indi-cators can be used (Raimbault, 2020d). We choose to sim-ply quantify the level of hierarchy of final populations. It is estimated by adjusting a rank-size law for populations, using an Ordinary Least Squares regression on logarithms of populations as a function of logarithms of ranks. This captures if the urban systems has become more unequal in terms of population balance, since the initial hierarchy is fixed.
Model parameters Parameter explored in experiments are the spatial interaction parameters dG, dI ∈ [0; 2] which
correspond to the crossover mechanism; and the innovation parameters which correspond to the mutation mechanism: innovation rate β ∈ [0; 1], innovation hierarchy αI ∈ [0; 2],
innovation utility standard deviation σU ∈ [0.7; 2] (the lower
bound is a constraint for the existence of the log-normal with log mean 0), initial penetration rate r0∈ [0.1; 0.9], and type
of innovation utility as normal or log-normal. All model pa-rameters are summarized in Table 1, with their range, default value and associated process.
Results
The model is implemented in scala and integrated into the OpenMOLE software (Reuillon et al., 2013) for numerical experiments. OpenMOLE allows embedding models in any language as black boxes, provides a transparent access to high performance computing infrastructures, and model ex-ploration and validation methods such as sensitivity anal-ysis, design of experiments, and calibration methods. Ex-periments are designed through workflows using a Domain Specific Language (Passerat-Palmbach et al., 2017).
Source code of the model and analysis, and results are available on the open git reposi-tory of the project at https://github.com/ JusteRaimbault/UrbanEvolution. Simula-tion data files are available on the dataverse repository at https://doi.org/10.7910/DVN/Q5GKZ0.
Internal validation
As the model is stochastic through the mutation process, first experiments are needed to assess the “internal validity” of the model, i.e. to what extent studied indicators are robust to noise and how much stochastic repetitions are needed to significantly distinguish between central values of distribu-tions for different parameter points. We sample thus 100 pa-rameter points using a Latin Hypercube Sampling, and run 1000 model repetitions for each point, in order to estimate the statistical properties across different points in the param-eter space.
The Sharpe ratios estimated on repetitions as sample stan-dard deviation relative to absolute sample mean have high values for all indicators (min. 3.9 and median 12.1 for di-versity; min. 3.0 and median 6.2 for innovation; min. 1.7 and median 3.6 for utility; min. 26 and median 257.3 for population hierarchy). This implies that stochastic noise is not an issue for interpreting indicator values.
We also study the distance between points averages rela-tive to their standard deviation, in order to know the signif-icance in comparing averages. This distance is defined by ∆ij = 2|µσii−µ+σjj| if µiare estimated central values (mean or
median) and σi estimated standard deviations. These
dis-tances have an average and median larger than one for all couples, and a first quartile larger than one for innovation and population hierarchy, while the first quartile is 0.5 for utility and 0.6 for diversity. The most constraining indicators in terms of statistical precision are thus utility and diversity. As in the case of normal distributions, a 95% confidence in-terval of size σ2 is achieved for n ' 64 runs, a number of
50 runs is satisfying for further experiments.
Model exploration
We then explore a grid of the parameter space consisting of 23,168 parameter points, with a finer step on spatial param-eters dGand dI, and with 50 model replications for each
pa-rameter point. We find that the type of distribution for utility
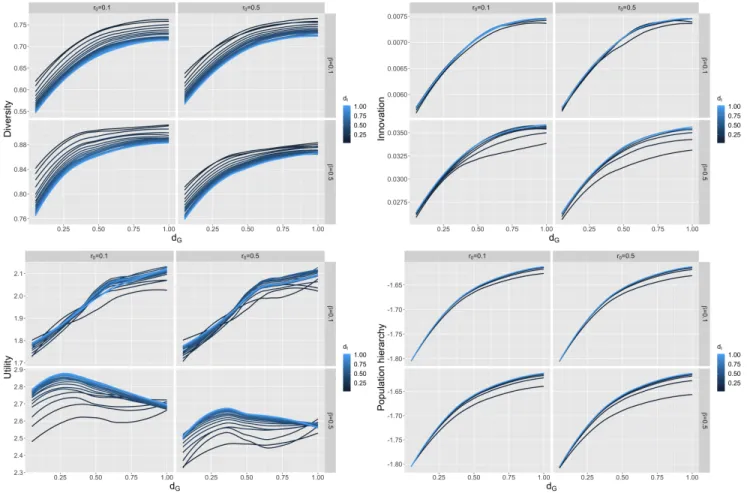
Figure 1: Values of indicators obtained with the grid model exploration. Each plot give each indicator among diversity D, utility U, innovation I and population hierarchy αP, at fixed parameters αI = 1, σU = 1and for the log-normal utility law.
Indicators are plotted as a function of gravity interaction range dG, for varying values of innovation diffusion range dI (color).
Sub-panels show varying values of mutation rate β (rows) and of early adoption rate r0(columns).
has small effects for all indicators and across most param-eter values, but particular cases are more interesting in the log-normal case, which we comment further. Similarly, the effect of innovation hierarchy αI and of innovation utility
standard deviation σU do not seem to induce strong
quali-tative differences, so we discuss model behavior obtained at αI = 1and σU = 1.
The Fig. 1 shows the behavior of indicators with remain-ing parameters varyremain-ing, namely spatial interaction param-eters dG and dI, mutation rate β and innovation adoption
r0. Regarding the behavior of diversity (top left panel of
Fig. 1), we find that it always increases for larger population growth spatial interaction distances, meaning that broader population exchanges will induce a higher diversity in in-novations, probably through the higher innovation dynamics induced. This increase is however slowed down around half of the width of the world (dG= 0.5), which is more obvious
with higher values of mutation rates for which a plateau is reached (bottom row, in particular the sub-panel for r0= 0.1
and β = 0.5): higher intrinsic innovation dampens the role
of spatial interactions. An increase of innovation interac-tion distance dI on the contrary monotonously decreases
di-versity, consistently with the idea of local innovation niches which can be overridden by competing innovations of higher utility coming from further away. Finally, mutation rate has a strong quantitative impact on total diversity as expected, while higher early adoption rate will change diversity be-havior only when mutation rates are also high.
Two indicators which behavior is less rich are innovation and population hierarchy (top right and bottom right panels of Fig. 1), which could be expected as population dynamics are deterministic and strongly related to space, while inno-vation is directly related to population. We find that these increase both with dG and dI, meaning that more
interac-tions and more diffusion will foster local innovation. Re-garding the final distribution of populations, this implies that systems where interactions are more global will be less un-equal. This is however not always the case in such urban dynamics model as explored by Raimbault (2020b). The mutation rate β here only fosters the role of small dI,
Figure 2: Correlation matrix between indicators, estimated on the full grid experiment. Confidence intervals for cor-relations estimated with the Fisher method are tiny and not distinguishable in the plot.
ing higher hierarchies and less innovations for these. The effect of initial adoption rate is small for these indicators. Note that although they appear highly correlated in this re-gion of the parameter space, they are not the indicators with the highest correlation as shown further (see Fig. 2 for a cor-relation matrix between indicators).
Finally, the indicator with a more interesting behavior is the utility (bottom left panel of Fig. 1). For low values of mutation rates, we find a piecewise linear behavior as a func-tion of dG and small effects of dI, meaning that low
inno-vation settings yield regimes where broader interactions are systematically desirable for the all system. However, when βis higher, we witness a maximum of utility as a function of dG, consistent across different values of dI and of r0. This
corresponds to an intermediate regional regime where local innovation regimes are more beneficial than a global integra-tion. This peak is the strongest when innovations diffuse at a broader range, which could be consistent with this regime being due to the emergence of regional ensembles of com-parable competitivity. Such a setting would yield a higher chance of introducing innovations with a high utility, while a globalized system would concentrate on a single dominat-ing city and be overall less performant.
We also compute the correlation matrix between indica-tors across the full grid experiment. This shows that corre-lations that one could visually extrapolate from studying a part of the parameter space as commented in Fig. 1 do not correspond to the actual correlations on the broader param-eter space. Note that local correlation matrices could be es-timated for a more thorough discussion. We show the corre-lation matrix in Fig. 2. Confidence intervals estimated with
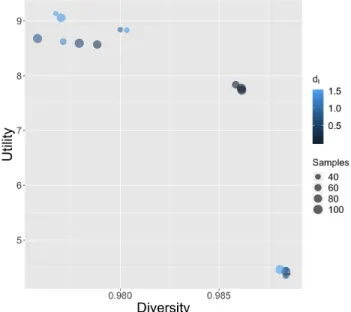
Figure 3: Pareto front for the contradictory indicator of util-ity and diversutil-ity obtained with the NSGA2 algorithm. Point color gives innovation interaction range dI while point size
gives the number of stochastic samples.
the Fisher method are of negligible width compared to cor-relation values. We find that diversity is finally the indicator with highest correlations. The correlation between innova-tion and populainnova-tion is low, meaning that the similar curves observed before are a particular case. Innovation and utility have a correlation lower than 0.5, and are thus rather inde-pendent. Regarding the effective dimension of the indicator space, a principal component analysis on normalized indi-cators gives 48% of variance on the first component, 77% of cumulated variance on the second and 91% on the third. This confirms that even if correlations exist, the behavior of indicators are rather independent.
Model optimization
The last experiment we perform is the application of a multi-objective optimization procedure to the model. More partic-ularly, one could want to optimize simultaneously the global utility but also the diversity to ensure a certain resilience in the urban system. We apply thus a bi-objective genetic al-gorithm on the model, trying to maximize simultaneously utility and diversity. The algorithm is the NSGA2 algorithm (Deb et al., 2002), which we run for 50,000 generations with a population of 200 individuals and an Island distribution scheme. The algorithm is integrated into the OpenMOLE software, and the stochastic aspect is internally tackled by using an embedding strategy, i.e. by adding the number of repetitions as an additional objective to find compromize points between the number of run needed and their statistical accuracy.
We show in Fig. 3 the obtained points, which are close to a Pareto front. We include the points with at least 20 stochastic samples. We find three regimes, the first corre-sponding to the upper points in the plot for higher utilities but lower diversities, which should correspond to the in-termediate optimal regimes identified before, and in which some kind of linear compromize between utility and diver-sity exists (but with a very flat slope for utility): increas-ing global utility is done at the cost of reducincreas-ing diversity. Within this first regime, two very different parameter set-ting coexist, one with high innovation diffusion (light blue, points with higher utility), the other in dark blue with a more local innovation diffusion. This means that reducing the span of innovation diffusion will increase diversity as one could expect. A second part of the Pareto front corre-sponds to intermediate points with lower utility but higher diversity, and is exclusively composed of local innovation parameters. The third part of the Pareto front, obtained after a sharp transition, allows increasing significantly the diver-sity compared to the first part, but at the price of a much lower utility (points on the bottom right). These points are all close to equivalent, and one may prefer to consider as a compromize the extreme points which correspond to a broad diffusion setting, but this last regime is also mixed with local innovation. Thus, local diffusion correspond to intermedi-ate compromizes, while broad diffusion corresponds to ex-tremes in the Pareto front (first and third regimes). In a nut-shell, this optimization exercise is interesting both to show how the model produces compromizes, but also how it could be used in practice for innovation policies applied to systems of cities.
Discussion
Our simple formulation of an urban genome and associ-ated evolutionary processes, implemented by the diffusion of innovation, already capture complex urban dynamics, as shown for example by the emergence of an intermediate op-timal regime corresponding to local innovation niches which diffuse far. Although much more empirical work would be needed to compare these stylized facts to real world settings, our model suggests in this particular setting that too much integration is not always optimal, what corresponds to the theoretical fact that complex systems are generally modular at different scales (Ethiraj and Levinthal, 2004). More gen-erally, regarding the implications of our results for possible formalizations and theories of urban evolution which would closely build on biological and cultural evolution by extend-ing them, we have demonstrated how a particular instance of an urban genome can be used to simulate urban dynamics, including fundamental processes needed to effectively have evolution. To what extent this approach relates to existing approaches of urban evolution which use other definitions remains to be investigated.
Several extensions and applications would be possible to
this first model exploration. First, the innovation space in our model remained unidimensional. (Hidalgo et al., 2007) show in terms of industrial production by countries that these industrial spaces are highly dimensional in terms of product produced and interdependencies between countries and types of production, increasing the path-dependency in economic trajectories. The investigation of patent data from a semantic viewpoint also shows the highly dimen-sional nature of technological innovation (Raimbault et al., 2016; Bergeaud et al., 2017). A direct extension of our model would consist in having a matrix genome instead of a vector one. Innovations would occur across several dimen-sions which can correspond to industrial or technological domains, but also social and cultural innovation and inno-vations in terms of infrastructures which condition the way systems of cities evolve (Raimbault, 2018b). Each dimen-sion should have particular innovation rules depending on its nature, and dependencies across dimensions could be in-troduced, implementing the possible emergence of techno-logical co-evolution niches beside the spatial co-evolution niches.
Second, applying the model to real systems of cities, both in terms of initial parametrization and of empirical laws for innovation processes, would allow bringing this approach closer to possible policy applications. Raimbault (2018a) and later Raimbault et al. (2020) benchmarked several mod-els of urban growth based on interactions between cities, and integrated the model of Favaro and Pumain (2011) on which this work was based. It however only included ac-curate initial populations and distance matrix, but no em-pirical data on innovation waves which were also syntheti-cally constructed. One important aspect of this application to real systems of cities is thus a test of the performance of this model in predicting possible population trajectories for systems of cities. Several obstacles however remain for a more complete application of the innovation diffusion ur-ban evolution model. Harmonized datasets with consistent definition of urban entities, in particular which can be com-pared between different urban systems and long time scales, are crucial to study the dynamics of urban systems as done for example by Pumain et al. (2015). Innovation measures are not included in such datasets, and existing innovation proxys are limited in time and space, as for example the US Patent Office database for which inventors have been local-ized (Morrison et al., 2017). Then, how to link innovation proxy measures with model processes, in other words how to parametrize or calibrate the model on real data, remains an open question. Finally, how various urban systems with very different histories and at different stages of develop-ment would fit model assumptions, in particular the fact that innovation waves partly drive growth rates of cities, remains to be empirically investigated (Pumain et al., 2009).
Finally, our approach was rather restricted in the sense that even a broad geographical range is taken into account,
a single ontological scale is included in the model, i.e. the macroscopic scale since cities are the basic agents. One can expect processes of innovation diffusion to behave differ-ently at the microscopic scale or at intermediate scales of companies or innovation clusters Audretsch and Feldman (2004). Other types of agents and processes may be more significant than spatial interaction at this finer scales, for ex-ample with a diffusion through social networks (Zhang and Vorobeychik, 2019). Similarly, a single temporal scale was included, although two dynamics of spatial interaction and innovation diffusion are effectively combined. A multi-scale approach of urban evolution would be necessary to fully ac-count for the complexity of these systems. Raimbault (2019) introduced a multi-scalar model for population growth with upward and downward strong feedbacks between the meso-scopic scale (urban form) and the macromeso-scopic scale (spatial interaction model). Adapting this approach in the case of urban evolution through innovation diffusion would be an interesting potential development.
Conclusion
We have introduced a simple model of urban evolution in-tegrating effectively the evolutionary processes of transmis-sion, transformation and evolving sub-systems, through in-novation diffusion and spatial interactions. Model explo-ration yield complex behavior while multi-objective opti-mization shows the potentiality for the model to produce compromizes between utility and diversity in the system of cities. This work is thus a first step towards more elaborated models of urban evolution.
Acknowledgements
Results obtained in this paper were computed on the vo.complex-system.eu virtual organization of the European Grid Infrastructure ( http://www.egi.eu ). We thank the Eu-ropean Grid Infrastructure and its supporting National Grid Initiatives (France-Grilles in particular) for providing the technical support and infrastructure. This work was funded by the Urban Dynamics Lab grant EPSRC EP/M023583/1.
References
Audretsch, D. B. and Feldman, M. P. (2004). Knowledge spillovers and the geography of innovation. In Handbook of regional and urban economics, volume 4, pages 2713–2739. Elsevier. Batty, M. (2009). A digital breeder for designing cities.
Architec-tural Design, 79(4):46–49.
Batty, M. and Marshall, S. (2009). Centenary paper: The evolu-tion of cities: Geddes, abercrombie and the new physicalism. Town Planning Review, 80(6):551–574.
Bedau, M. A., McCaskill, J. S., Packard, N. H., Rasmussen, S., Adami, C., Green, D. G., Ikegami, T., Kaneko, K., and Ray, T. S. (2000). Open problems in artificial life. Artificial life, 6(4):363–376.
Bergeaud, A., Potiron, Y., and Raimbault, J. (2017). Classi-fying patents based on their semantic content. PloS one, 12(4):e0176310.
Blommestein, H. and Nijkamp, P. (1987). Adoption and diffusion of innovations and the evolution of spatial systems. In Eco-nomic Evolution and Structural Adjustment, pages 368–380. Springer.
Bull, L., Holland, O., and Blackmore, S. (2000). On meme–gene coevolution. Artificial life, 6(3):227–235.
Cottineau, C., Reuillon, R., Chapron, P., Rey-Coyrehourcq, S., and Pumain, D. (2015). A modular modelling framework for hy-potheses testing in the simulation of urbanisation. Systems, 3(4):348–377.
D’Acci, L. (2014). Urban dna for cities evolutions. cities as physi-cal expression of dynamic equilibriums between competitive and cooperative forces. arXiv preprint arXiv:1408.2874. Daud´e, E. (2004). Apports de la simulation multi-agents `a l´etude
des processus de diffusion. Cybergeo: European Journal of Geography.
Deb, K., Pratap, A., Agarwal, S., and Meyarivan, T. (2002). A fast and elitist multiobjective genetic algorithm: Nsga-ii. IEEE transactions on evolutionary computation, 6(2):182–197. Deffuant, G., Huet, S., and Amblard, F. (2005). An
individual-based model of innovation diffusion mixing social value and individual benefit. American Journal of Sociology, 110(4):1041–1069.
Durham, W. H. (1991). Coevolution: Genes, culture, and human diversity. Stanford University Press.
Ethiraj, S. K. and Levinthal, D. (2004). Modularity and innovation in complex systems. Management science, 50(2):159–173. Favaro, J.-M. and Pumain, D. (2011). Gibrat revisited: An urban
growth model incorporating spatial interaction and innova-tion cycles. Geographical Analysis, 43(3):261–286. Fotheringham, A. S. and O’Kelly, M. E. (1989). Spatial interaction
models: formulations and applications, volume 1. Kluwer Academic Publishers Dordrecht.
Gong, H. and Hassink, R. (2019). Co-evolution in contemporary economic geography: Towards a theoretical framework. Re-gional Studies, 53(9):1344–1355.
Hagerstrand, T. et al. (1968). Innovation diffusion as a spatial pro-cess. Innovation diffusion as a spatial propro-cess.
Hidalgo, C. A., Klinger, B., Barab´asi, A.-L., and Hausmann, R. (2007). The product space conditions the development of na-tions. Science, 317(5837):482–487.
Holland, J. H. (2012). Signals and boundaries: Building blocks for complex adaptive systems. Mit Press.
Kaya, H. S. and B¨olen, F. (2017). Urban dna: morphogenetic anal-ysis of urban pattern.
Kiesling, E., G¨unther, M., Stummer, C., and Wakolbinger, L. M. (2012). Agent-based simulation of innovation diffusion: a review. Central European Journal of Operations Research, 20(2):183–230.
Lobo, J., Alberti, M., Allen-Dumas, M., Arcaute, E., Barthelemy, M., Bojorquez Tapia, L. A., Brail, S., Bettencourt, L., Beukes, A., Chen, W.-Q., et al. (2020). Urban science: Inte-grated theory from the first cities to sustainable metropolises. Mesoudi, A. (2001). Cultural evolution. eLS, pages 1–8.
Morrison, G., Riccaboni, M., and Pammolli, F. (2017). Dis-ambiguation of patent inventors and assignees using high-resolution geolocation data. Scientific data, 4:170064. Passerat-Palmbach, J., Reuillon, R., Leclaire, M., Makropoulos,
A., Robinson, E. C., Parisot, S., and Rueckert, D. (2017). Re-producible large-scale neuroimaging studies with the open-mole workflow management system. Frontiers in neuroinfor-matics, 11:21.
Paulus, F. (2004). Co-´evolution dans un syst`eme de villes: ´evolution des fonctions ´economiques des aires urbaines franc¸aises de 1962 `a 1999.
Pumain, D. (1982). La dynamique des villes. Economica. Pumain, D. (2018). An evolutionary theory of urban systems. In
In-ternational and transnational perspectives on urban systems, pages 3–18. Springer.
Pumain, D. et al. (2012). Une th´eorie g´eographique pour la loi de zipf. R´egion et d´eveloppement, 36(31-54):125–150. Pumain, D., Paulus, F., and Vacchiani-Marcuzzo, C. (2009).
In-novation cycles and urban dynamics. In Complexity per-spectives in innovation and social change, pages 237–260. Springer.
Pumain, D., Paulus, F., Vacchiani-Marcuzzo, C., and Lobo, J. (2006). An evolutionary theory for interpreting urban scal-ing laws. Cybergeo: European Journal of Geography. Pumain, D. and Raimbault, J. (2020). Conclusion: Perspectives
on urban theories. In Theories and Models of Urbanization, pages 303–330. Springer.
Pumain, D. and Reuillon, R. (2017). The simpoplocal model. In Urban Dynamics and Simulation Models, pages 21–35. Springer.
Pumain, D., Swerts, E., Cottineau, C., Vacchiani-Marcuzzo, C., Ignazzi, C. A., Bretagnolle, A., Delisle, F., Cura, R., Lizzi, L., and Baffi, S. (2015). Multilevel comparison of large urban systems. Cybergeo: European Journal of Geography. Raimbault, J. (2018a). A systematic comparison of interaction
models for systems of cities. In Conference on Complex Sys-tems 2018, Thessaloniki, Greece.
Raimbault, J. (2018b). Caract´erisation et mod´elisation de la co-´evolution des r´eseaux de transport et des territoires. PhD thesis, Universit´e Paris 7 Denis Diderot.
Raimbault, J. (2018c). Co-evolution and morphogenetic systems. arXiv preprint arXiv:1803.11457.
Raimbault, J. (2019). A multi-scalar model for system of cities. In Conference on Complex Systems 2019, Singapore, Singapore. Raimbault, J. (2020a). Cities as they could be: Artificial life and
urban systems. arXiv preprint arXiv:2002.12926.
Raimbault, J. (2020b). Hierarchy and co-evolution processes in urban systems. arXiv preprint arXiv:2001.11989.
Raimbault, J. (2020c). Indirect evidence of network effects in a system of cities. Environment and Planning B: Urban Ana-lytics and City Science, 47(1):138–155.
Raimbault, J. (2020d). Unveiling co-evolutionary patterns in sys-tems of cities: a systematic exploration of the simpopnet model. In Theories and Models of Urbanization, pages 261– 278. Springer.
Raimbault, J., Bergeaud, A., and Potiron, Y. (2016). Investigat-ing patterns of technological innovation. In Conference on Complex Systems 2016.
Raimbault, J., Cottineau, C., Le Texier, M., Le Nechet, F., and Reuillon, R. (2019). Space matters: Extending sensitivity analysis to initial spatial conditions in geosimulation mod-els. Journal of Artificial Societies and Social Simulation, 22(4):10.
Raimbault, J., Denis, E., and Pumain, D. (2020). Empowering Urban Governance through Urban Science: Multi-scale Dy-namics of Urban Systems Worldwide. arXiv e-prints, page arXiv:2005.10007.
Reuillon, R., Leclaire, M., and Rey-Coyrehourcq, S. (2013). Open-mole, a workflow engine specifically tailored for the dis-tributed exploration of simulation models. Future Generation Computer Systems, 29(8):1981–1990.
Rozenblat, C. and Pumain, D. (2007). Firm linkages, innovation and the evolution of urban systems. Cities in globalization: Practices, policies, theories, pages 130–156.
Sonis, M. (1995). A territorial socio-ecological approach to in-novation diffusion, schumpeterian competition and dynamic choice. In Technological Change, Economic Development and Space, pages 34–74. Springer.
Uyarra, E. (2010). What is evolutionary about regional systems of innovation? implications for regional policy. Journal of evolutionary economics, 20(1):115.
Votsis, A. and Haavisto, R. (2019). Urban dna and sustainable cities: A multi-city comparison. Frontiers in Environmental Science, 7:4.
Wu, N. and Silva, E. A. (2011). Urban dna: exploring the biologi-cal metaphor of urban evolution with dg-abc model. In Pro-ceedings The 14th AGILE International Conference on Geo-graphic Information Science. Utrecht University.
Zenobia, B., Weber, C., and Daim, T. (2009). Artificial markets: A review and assessment of a new venue for innovation re-search. Technovation, 29(5):338–350.
Zhang, H. and Vorobeychik, Y. (2019). Empirically grounded agent-based models of innovation diffusion: a critical review. Artificial Intelligence Review, pages 1–35.