HAL Id: hal-01515956
https://hal.inria.fr/hal-01515956
Submitted on 28 Apr 2017
HAL is a multi-disciplinary open access
archive for the deposit and dissemination of
sci-entific research documents, whether they are
pub-lished or not. The documents may come from
teaching and research institutions in France or
abroad, or from public or private research centers.
L’archive ouverte pluridisciplinaire HAL, est
destinée au dépôt et à la diffusion de documents
scientifiques de niveau recherche, publiés ou non,
émanant des établissements d’enseignement et de
recherche français ou étrangers, des laboratoires
publics ou privés.
User Assisted Separation of Repeating Patterns in Time
and Frequency using Magnitude Projections
Derry Fitzgerald, Zafar Rafii, Antoine Liutkus
To cite this version:
Derry Fitzgerald, Zafar Rafii, Antoine Liutkus. User Assisted Separation of Repeating Patterns
in Time and Frequency using Magnitude Projections. 42nd International Conference on Acoustics,
Speech and Signal Processing (ICASSP), Mar 2017, New Orleans, United States. �hal-01515956�
USER ASSISTED SEPARATION OF REPEATING PATTERNS IN TIME AND FREQUENCY
USING MAGNITUDE PROJECTIONS
Derry FitzGerald
1Zafar Rafii
2Antoine Liutkus
31
School of Music, Cork Institute of Technology, Cork, Ireland
2Gracenote, Applied Research, Emeryville, CA 94608 USA
3
Inria, Villiers-L`es-Nancy, 54600 France
ABSTRACT
In this paper, we propose a simple user-assisted method for the re-covery of repeating patterns in time and frequency which can occur in audio mixtures. Here, the user selects a region in a log-frequency spectrogram from which they seek to recover the underlying pattern, such as a repeating chord masked by a cough. Cross-correlation is then performed between the selected region and the spectrogram, re-vealing similar regions. The most similar region is then selected and a variant on the PROJET algorithm, termed PROJET-MAG, is used to extract the common time-frequency components from the two re-gions, as well as extracting the components which are not common. The results obtained are compared to another user-assisted method based on REPET, and PROJET-MAG is demonstrated to give im-proved results over this baseline.
Index Terms— Constant Q Transform, normalised 2-D cross-correlation, PROJET, audio source separation
1. INTRODUCTION
In recent years there has been an increased focus on the incorpora-tion of user assistance to improve the results obtained from sound source separation algorithms. Potential applications for such sys-tems include noise reduction, audio restoration, remixing, and ex-tracting parts for use in new music. A number of these systems utilise guide tracks [1, 2], or score-based assistance [3, 4], while others allow users to edit spectrograms and/or pitch-based repre-sentations. These representations are typically obtained via Non-negative Matrix Factorization or via pitch detection algorithms [5– 8]. A limitation of these systems is that they often require time-consuming manual annotations which interfere with the underlying creative function of the separation tools.
An alternate approach to the concept of user-assistance was taken in [9]. The technique used was based on methods which leveraged repeating structure in time-frequency representations of audio signals to perform sound source separation [10–13]. The input signal was transformed to a log-frequency magnitude spectrogram via a Constant Q transform [14, 15], and the user then chose the spectrogram region from which they wished to extract the repeating structure which has been obscured by an interfering sound source. Cross-correlation was then performed between the chosen region and the spectrogram to identify sections of the spectrogram which contained the same repeating structure. The most similar regions were then chosen and the element-wise median was taken across
This work was partly supported by the research programme KAMoulox (ANR-15-CE38-0003-01), funded by ANR, the French State agency for re-search.
these regions to yield an estimate of the underlying repeating struc-ture. From this, a mask was created for the original region and the modified signal was then recovered via inversion to the time-domain. In contrast to the annotation-based approaches, this technique simply required the user to select the region of interest and the sys-tem then determined what the repeating pattern was. It required minimal interaction from the user, but was still capable of giving good quality results. It is this work we take as the basis for our proposed system, but instead of using a median-based method to es-timate the repeating structure, we propose a novel projection-based separation method, based on an extension of the PROJET algorithm [16, 17]. The PROJET algorithm was recently proposed as a method for demixing multichannel mixture signals into their constituent spa-tial objects. It assumed that each spaspa-tial object in a mixture was ob-tained from the superposition of many contributions from different directions and inter-channel delays. PROJET then used linear pro-jections of the mixture channels to estimate the model parameters and recover estimates of the underlying spatial objects. Here, instead of projecting on mixture channels, we will be projecting between the user selected magnitude spectrogram region, and the closest match-ing magnitude spectrogram region identified by cross-correlation. We term this new projection-based algorithm PROJET-MAG.
The rest of the paper is laid out as follows. In Section 2, we present an overview of the system. In Section 3 we describe the PROJET-MAG algorithm. In Section 4, we describe a few applica-tions of the system, and in Section 5, we conclude this article.
2. SYSTEM
The initial stage in the interface is to take the chosen recording and transform it into a spectrogram. This is done using a Constant Q Transform [14, 15] due to the logarithmic frequency resolution, which matches that of Western music scales. This also ensures that changes in the pitch of a given instrument can be approximately rep-resented via frequency translations.
Here we utilize the CQT toolbox1 which includes an inverse transform that gives an efficient reconstruction [18]. The parame-ters used for calculating the CQT are a number of 24 frequency bins per octave, a minimum frequency of 27.50 Hz (equivalent to the note A0), and the maximum frequency is set to half of the sample rate.
Once the log-frequency spectrogram has been calculated, it is displayed to the user. The user then has to select the region from which they want to recover the repeating pattern. The selected region is then cross-correlated with the spectrogram to identify the most similar region in time and frequency where the underlying pattern
repeats. This is in contrast to the multiple regions required in [9]. This was done using normalised 2D cross-correlation, which is typ-ically used to find repeating templates in image processing applica-tions [19, 20]. This is calculated using:
C(i, j) = P
x,y
(S(i−1+x, j−1+y)−Si,j)(R(x, y)−R)
(P
x,y
(S(i−1+x, j−1+y)−Si,j)2P x,y
(R(x, y)−R)2)12
• S is the log-spectrogram
• Si,jis the mean of S over the surrounding region with size of R
• R is the selected region and R is the mean of R • i = 1 . . . n, n is the number of frequency channels in S • j = 1 . . . m, m is the number of time frames in S • x = 1 . . . h, h is the frequency height in R • y = 1 . . . w, w is the time width in R
(1)
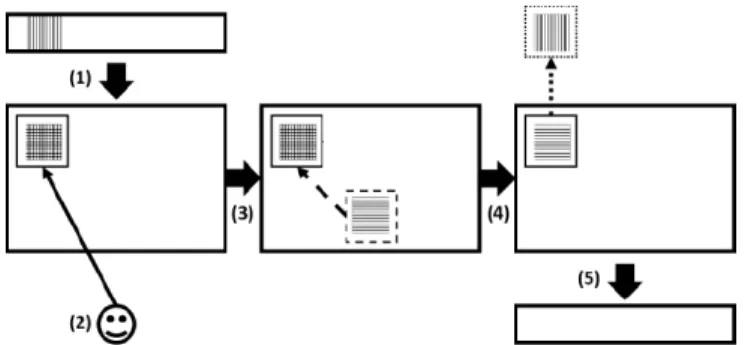
To avoid capturing nearby repetitions of the pattern, a minimum difference in time and/or frequency is set, and peaks which are closer than these minimum distances are discarded. After this, the spectro-gram region with the highest correlation to the user-chosen region is selected. Then the PROJET-MAG algorithm is run on the two se-lected spectrogram regions to recover the common repeated pattern. This is explained in detail in Section 3. The phase of the original CQT is applied to the recovered spectrogram estimate of the repeat-ing pattern and the signal is inverted to the time-domain, with the interfering source removed. A system overview is shown in figure 1.
Fig. 1. Overview of the system. (1) A signal with an undesired ele-ment is transformed into a log-frequency spectrogram. (2) The user selects the region of the undesired element in the spectrogram. (3) The selected region is cross-correlated with the spectrogram to iden-tify the most similar region where the underlying pattern repeats. (4) The identified regions are projected against each other to recover the common repeating pattern. (5) The filtered spectrogram is inverted back to the time-domain with the undesired element removed.
3. PROJET-MAG
The original PROJET algorithm was designed to work on multichan-nel signals. In this scenario described in this paper, we do not have a stereo signal to process but instead have two related spectrogram excerpts of a mono signal. To this end, we vectorise the spectrogram excerpts and form a matrix X of size (F × T ) × 2 where F is the number of frequency bins in the chosen region and T is the number of time frames in the region, and where X(:, 1) contains the user
chosen spectrogram excerpt and X(:, 2) contains the spectrogram excerpt which correlates highest with the user-chosen excerpt. We then proceed to treat X as a pseudo-stereo multichannel spectrogram which contains J = 3 point sources:
X = Sθ (2)
where S is a matrix of size (F × T ) × 3, where S(:, 1) contains elements in the mixture spectrogram which occur only in the user-chosen excerpt, S(:, 2) contains the repeating pattern which is com-mon to both spectrogram excerpts, and S(:, 3) contains elements which occur only in the correlated spectrogram region. We further assume that the repeating pattern is of equal amplitude in both spec-trogram excerpts. θ is then a known mixing matrix of size 3 × 2, where the jth row of θ is a mixing(panning) vector for the jth source: θ = [cos φ, sin φ] (3) with φ = [0, π/4, π/2]. We then define a projection matrix R of size 3 × 2 where
R = [sin φ, − cos φ] (4) with φ = [0, π/4, π/2]. This means that the corresponding rows of θ and R are orthogonal to each other. We then project X using R to yield the projection matrix C:
C = XR > (5)
where |·| denotes taking the absolute value and ·> denotes matrix transpose. We now assume that the underlying source spectrograms are distributed according to an α-stable distribution with α = 1, which implies additivity of magnitude spectrograms. This has been shown to be a valid approximation for musical audio signals [21]. This then yields the following approximation:
C ≈ ˆC = SK (6) where K = θR> . In effect, we have now formulated the prob-lem of estimating the underlying source spectrograms as a standard non-negative matrix factorization problem [22], where one of the matrices (K) is known. We chose the generalized Kullback-Leibler (KL) divergence, given by dKL(a | b) = a logab − a + b as the
optimizing cost function as it has been demonstrated to give good performance in the case where α = 1. We iteratively estimate S in the standard manner by initialising randomly to positive values and using the following update equation:
S = S ⊗VK
>
OK> (7)
where V = C/ ˆC, O is an all-ones matrix the same size as C, ⊗ denotes element-wise multiplication, with divisions element-wise.
The repeating pattern can then be recovered by the use of gener-alized Wiener filtering from:
Cr= C ⊗
S(:, 2) ∗ K(2, :) ˆ
C (8)
where Cr denotes the estimate of the projected repeating source,
S(:, 2) denotes the second column of S and K(2, :) is the second row of K. To recover the actual unprojected spectrogram estimate of the repeating pattern, we simply note that, due to the construction of the projection matrix R, the third column of C is equal to the first column of X. We therefore take the third column of Cras our
estimate of the repeating pattern and reshape it to a matrix of size F × T . The phase of the original CQT spectrogram region is then applied to this estimate and we replace the original values with our new estimate before inversion to the time domain.
4. APPLICATIONS
As the system proposed is interactive, we will demonstrate a num-ber of real-world applications of the system, as well as performance measures (the audio examples can be found online2). As the
sys-tem aims to perform the same tasks as those in [9], we use this repetition-based method as a baseline against which to measure the performance of our algorithm. It should also be noted that 1000 iter-ations of the update equation was used for estimating the repeating pattern in all examples presented. In all cases, the minimum time difference between similar regions was set at 1 second, as this had been observed to give good performance when performing REPET-SIM [11] and no minimum frequency distance was used.
4.1. Recovering a Melody obscured by a Cough
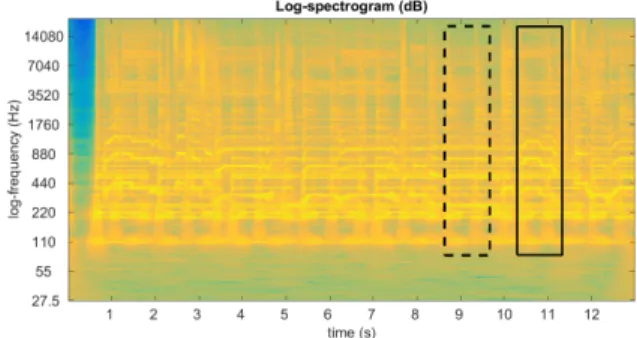
Figure 2 contains the log-spectrogram of a piano melody where a cough masks the first chord. The user-selected region is marked by a solid line, while the most similar region identified by the system is marked by a dashed line.
Fig. 2. Log-spectrogram of a melody with a cough masking the first notes. The user selected the region of the cough (solid line) and the system identified the most similar region where the underlying notes repeats (dashed line).
The log-spectrogram of the same melody with the first chord re-covered is then shown in figure 3. The system rere-covered the common elements between the two regions and used this to filter the cough from the user-selected region. The whole process only takes a cou-ple of seconds, with most of the time taken by the iterative updates.
The separation performance for the recovered chord and ex-tracted cough (in dB) are shown in Table 1 for the baseline method, denoted REP and the proposed method, denoted PM. The evalua-tion metrics used were those from the BSS Eval toolbox3 namely,
Source-to-Distortion Ratio (SDR) a measure of overall separation performance, Source-to-Interference Ratio (SIR), a measure of the interference due to other sources in the separated signal, and Source-to-Artifacts Ratio (SAR) a measure of the presence of artifacts due to the separation and resynthesis process [23]. In all cases, these metrics are only measured on the user-modified sections of the signals. The values for both REP and PM are both high, which implies good separation performance, but those from the proposed PROJET-MAG approach are considerably higher than those of the REPET-based approach, particularly for both SDR and SIR, while being comparable for SAR. This is evinced by listening to the audio
2http://www.zafarrafii.com/repet.html
3http://bass-db.gforge.inria.fr/bss_eval/
Fig. 3. Log-spectrogram of the melody with the first note recov-ered. The system recovered the repeating elements between the two regions in 2 and filtered the cough from the selected region.
examples where the cough is effectively inaudible in the PROJET-MAG algorithm while sound quality is also higher. The audio files were obtained from Freesound4.
SDR SIR SAR recovered notes (REP) 8.73 13.63 13.60 extracted cough (REP) 5.91 6.55 11.90 recovered notes (PM) 11.85 16.94 14.99 extracted cough (PM) 8.90 12.76 11.40
Table 1. Separation performance for the recovered note, and the ex-tracted cough for baseline (REP) and PROJET-MAG (PM) (in dB).
4.2. Recovering an Accompaniment Masked by Vocals
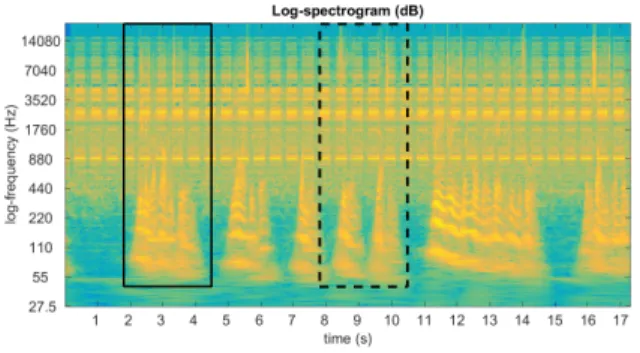
Figure 4 shows the log-spectrogram of a song excerpt with female vocals obscuring the accompaniment. A region (solid line) was se-lected by the user and the most similar region where the accompani-ment repeats is then identified by the system (dashed lines).
Fig. 4. Log-spectrogram of a song with vocals obscuring an accom-paniment. The user selected the region (solid line) and the system identified the most similar region where the underlying accompani-ment repeats (dashed lines).
Figure 5 shows the log-spectrogram of the same song excerpt of the accompaniment recovered. The system recovered the common pattern between the two excerpts and filtered out the vocals from the selected region.
Fig. 5. Log-spectrogram of the song with the first measure of the accompaniment recovered. The system recovered the repeating ele-ments between the two regions in 4 and removed the vocals
Table 2 shows the separation performance for the recovered accompaniment, and the extracted vocals (in dB). The audio files were obtained from SiSEC5. Again, it can be seen that the proposed
SDR SIR SAR recovered accompaniment (REP) 5.11 5.79 13.76 extracted vocal (REP) 6.66 19.83 10.98 recovered accompaniment (PM) 7.52 9.44 11.78 extracted vocal (PM) 9.08 15.03 12.60
Table 2. Separation performance for the recovered accompaniment, and the extracted vocals (in dB).
method outperforms the baseline in terms of SDR and SIR, while achieving comparable results for SAR.
4.3. Extracting Speech Masked by a Noise
Figure 6 shows the log-spectrogram of a male speaker masked by an alarm noise. The user selected a region of speech (solid line) and the system identified the most similar region where the alarm noise repeats (dashed lines).
Fig. 6. Log-spectrogram of speech masking a noise. The user se-lected a region of speech (solid line) and the system identified the most similar region where the alarm noise repeats (dashed lines).
The log-spectrogram of the extracted male speech is then shown in Figure 7 shows the log-spectrogram of the same male speech with the chosen sentence extracted after the system identified the most
5https://sisec.wiki.irisa.fr/tiki-index.php
similar section. In this case, we recover the non-repeating speech as opposed to the repeating noise pattern.
Fig. 7. Log-spectrogram of the first sentence of the speech extracted. The system filtered out the repeating pattern once it had been ex-tracted from the two similar regions
Table 3 shows the separation performance for the extracted speech, and the filtered noise (in dB). The audio files were down-loaded from Freesound. The proposed method again outperforms
SDR SIR SAR recovered accompaniment (REP) 5.98 15.17 7.77 extracted vocal (REP) 9.71 10.77 15.78 recovered accompaniment (PM) 6.43 12.4 7.38
extracted vocal (PM) 10.17 12.95 13.36
Table 3. Separation performance measures for the extracted speech, and the filtered noise (in dB).
the baseline method in terms of SDR, demonstrating the proposed method offers improved performance over the baseline method.
5. CONCLUSION
In this paper we have proposed a simple user-assisted system for the recovery of repeating patterns in time and frequency. Recovery of these repeating patterns is done through the use of a novel projection-based algorithm for the separation of common information between magnitude spectrograms, which we term PROJET-MAG. We have demonstrated the effectiveness of the system through the use of a number of real-world applications such as recovering a melody masked by a cough and an accompaniment masked by vocals. We also show that that the algorithm has improved separation perfor-mance over a baseline repetition-based separation algorithm.
In the future, we will extend the work to cover multichannel recordings, as opposed to the single-channel set-up demonstrated here. We would further aim to develop a standalone user interface for end-users to rapidly and easily manipulate existing audio record-ings. We also wish to extend the work to deal with multiple neigh-bours instead of a single one. Finally we aim to extend this work to recovering multiple repeating patterns within the same region.
6. REFERENCES
[1] Paris Smaragdis and Gautham J. Mysore, “Separation by “humming”: User-guided sound extraction from monophonic mixtures,” in IEEE Workshop on Applications of Signal Pro-cessing to Audio and Acoustics, New Paltz, NY, USA, October 18-21 2009.
[2] Derry FitzGerald, “User assisted separation using tensor fac-torisations,” in 20th European Signal Processing Conference (EUSIPCO), Bucharest, Romania, 2012.
[3] Sebastian Ewert, Bryan Pardo, Meinard M¨uller, and Mark D Plumbley, “Score-informed source separation for musical au-dio recordings: An overview,” IEEE Signal Processing Maga-zine, vol. 31, no. 3, pp. 116–124, 2014.
[4] Joachim Ganseman, Paul Scheunders, and Simon Dixon, “Im-proving plca-based score-informed source separation with in-vertible constant-q transforms,” in 20th European Signal Pro-cessing Conference (EUSIPCO 2016), Bucharest, Romania, 2012.
[5] Jean-Louis Durrieu and Jean-Philippe Thiran, “Musical audio source separation based on user-selected f0 track,” in Latent Variable Analysis and Signal Separation, Fabian Theis, An-drzej Cichocki, Arie Yeredor, and Michael Zibulevsky, Eds., vol. 7191 of Lecture Notes in Computer Science, pp. 438–445. Springer Berlin Heidelberg, 2012.
[6] Augustin Lef`evre, Francis Bach, and C´edric F´evotte, “Semi-supervised NMF with time-frequency annotations for single-channel source separation,” in 13th International Society for Music Information Retrieval, Porto, Portugal, October 8-12 2012.
[7] Benoit Fuentes, Roland Badeau, and Gael Richard, “Blind harmonic adaptive decomposition applied to supervised source separation,” in Proc. of EUSIPCO, Bucharest, Romania, Au-gust 2012, pp. 2654–2658.
[8] Nicholas J. Bryan, Gautham J. Mysore, and Ge Wang, “ISSE: An interactive source separation editor,” in ACM Confer-ence on Human Factors in Computing Systems, Toronto, ON, Canada, April 26-May 1 2014, pp. 257–266.
[9] Zafar Rafii, Antoine Liutkus, and Bryan Pardo, “A simple user interface system for recovering patterns repeating in time and frequency in mixtures of sounds,” in 40th International Con-ference on Acoustics, Speech and Signal Processing, Brisbane, Australia, April 19-24 2015.
[10] Zafar Rafii and Bryan Pardo, “REpeating Pattern Extraction Technique (REPET): A simple method for music/voice sepa-ration,” IEEE Transactions on Audio, Speech, and Language Processing, vol. 21, no. 1, pp. 71–82, January 2013.
[11] Zafar Rafii and Bryan Pardo, “Music/voice separation using the similarity matrix,” in 13th International Society for Music Information Retrieval, Porto, Portugal, October 8-12 2012. [12] Derry FitzGerald, “Vocal separation using nearest neighbours
and median filtering,” in 23nd IET Irish Signals and Systems Conference, Maynooth, Ireland, June 28-29 2012.
[13] Derry FitzGerald, Antoine Liutkus, Zafar Rafii, Bryan Pardo, and Laurent Daudet, “Harmonic/percussive separation using kernel additive modelling,” in 25th IET Irish Signals and Sys-tems Conference, Limerick, Ireland, June 26-27 2014.
[14] Judith C. Brown, “Calculation of a constant Q spectral trans-form,” Journal of the Acoustical Society of America, vol. 89, no. 1, pp. 425–434, January 1991.
[15] Judith C. Brown and Miller S. Puckette, “An efficient algo-rithm for the calculation of a constant Q transform,” Journal of the Acoustical Society of America, vol. 92, no. 5, pp. 2698– 2701, November 1992.
[16] Derry Fitzgerald, Antoine Liutkus, and Roland Badeau, “PRO-JET - Spatial Audio Separation Using Projections,” in 41st In-ternational Conference on Acoustics, Speech and Signal Pro-cessing (ICASSP), Shanghai, China, 2016.
[17] Derry Fitzgerald, Antoine Liutkus, and Roland Badeau, “Projection-based demixing of spatial audio,” IEEE Transac-tions on Audio, Speech and Language Processing, May 2016. [18] Christian Sch¨orkhuber, Anssi Klapuri, Nicki Holighaus, and
Monika D”orfler, “A Matlab toolbox for efficient perfect recon-struction time-frequency transforms with log-frequency reso-lution,” in AES 53rd International Conference on Semantic Audio, London, UK, January 27-29 2014.
[19] Robert M. Haralick and Linda G. Shapiro, Computer and Robot Vision, vol. 2, pp. 316–317, Addison-Wesley, 1992. [20] J. P. Lewis, “Fast template matching,” in Vision Interface,
Quebec City, QC, Canada, May 15-19 1995, pp. 120–123. [21] Antoine Liutkus and Roland Badeau, “Generalized Wiener
fil-tering with fractional power spectrograms,” in 40th Interna-tional Conference on Acoustics, Speech and Signal Processing (ICASSP), Brisbane, Australia, 2015, IEEE.
[22] Daniel D. Lee and H. Sebastian Seung, “Algorithms for non-negative matrix factorization,” in Neural Information Process-ing Systems, Denver, CO, USA, November 27- December 02 2000.
[23] Emmanuel Vincent, R´emi Gribonval, and Cedric F´evotte, “Performance measurement in blind audio source separation,” IEEE Transactions on Audio, Speech and Language Process-ing, vol. 14, no. 4, pp. 1462–1469, July 2006.