Coolhunting and Coolfarming
Harnessing the Power of Collaborative Innovation Networks using Social Network Analysis
by
Rohan Kulkarni
Bachelor of Engineering in Electronics and Communication (2005) Visveswaraiah Technological University, Belgaum, India
Master of Science in Electrical Engineering (2006) State University of New York at Stony Brook, Stony Brook, NY
Submitted to the System Design and Management Program in Partial Fulfillment of the Requirements for the Degree of
Master of Science in Engineering and Management
at the MASSACHUSETTG OF TECHNOLOGY T
Massachusetts Institute of Technology
June 2014
JUN 2
6201
© 2014 Rohan Kulkarni
LIBRARIES
All rights reserved
The author hereby grants to MIT permission to reproduce and to distribute publicly paper and electronic copies of this thesis document in whole or in part in any medium now known or hereafter
created.
Signature redacted
Signature of Author:
Rohan Kulkarni System Design and Management Program
May 1 3h, 2014
Certified by:
Signature
redacted
Dr. Peter A. Gloor Thesis Supervisor
Research Scientisy Cent Tssenr Ms
Accepted by:
Signature redacted__
' ricl Hale Director, System Design and Management Program
Coolhunting and Coolfarming
Harnessing the Power of Collaborative Innovation Networks using Social Network Analysis
by
Rohan Kulkarni
Submitted to the System Design and Management Program
on May 13 h, 2014 in Partial Fulfillment of the Requirements for the Degree of
Master of Science in Engineering and Management
Abstract
Email, Instant Messaging, Voice Over IP (VOIP) and other means of online communication have become so ubiquitous today that we rarely take a moment to acknowledge how the internet has changed and redefined the ways in which we communicate and collaborate with fellow human beings. The internet has empowered us to collaborate with others in ways that were not possible till just a few years ago. As we communicate and interact with each other and form relationships, we weave intricate Social Networks that can be analyzed and exhibit communication patterns that can be quantified.
In this thesis I have applied Social Network Analysis based techniques that constitute Coolhunting (Gloor & Cooper, 2007) to analyze E-Mail and WebEx communications of sales professionals of a large technology company. I have quantified communication patterns and computed metrics of social network prominence such as degree and betweenness centralities using Condor, a Social Network Analysis and Coolhunting software. Several significant correlations between the success of sales professionals and these quantified communication patterns and centrality measures were found.
The communication patterns and centralities of the sales professionals exhibited several traits of Collaborative Innovation Networks or COINs (Gloor, 2006). I have assessed the implications of these communication patterns and correlations and applied the concept of Coolfarming (Gloor, 2011 a) to make recommendations to the technology company on how it could leverage the power of these COINs to their advantage.
Key Terms: Collaborative Innovation Networks (COINs), Coolhunting, Coolfarming, Social
Network Analysis, Condor, E-Mail, WebEx
Thesis Supervisor: Dr. Peter A. Gloor
Dedicated to
My Grandfather, Late Mr. Ramchandra P. Gudi,
The best Engineer and Entrepreneur I have ever known and aspire to be like And
My Parents, Mrs. Alaka and Dr. Ajit D. Kulkarni, My constant source of inspiration to keep on growing
Acknowledgements
I would like to start by expressing my sincere gratitude towards Dr. Peter A. Gloor, my thesis
supervisor, for introducing me to the fascinating world of Swarm Creativity and Social Network Analysis and giving me this incredible opportunity to work with him on my thesis. It has been a privilege and pleasure to work with Dr. Gloor. As a true Coolfarmer Dr. Gloor was available in person, over the phone and over E-Mail to promptly answer my questions and to brainstorm on ideas at every stage of my thesis.
I would also like to thank Dr. Gloor and Galaxy Advisors for letting me work on data from
one of their live engagements with a large company. I would like to thank Kevin Zogg, the lead developer of Condor at Galaxy Advisors, for resolving any questions I had about using Condor for the analysis performed during the course of this thesis.
I would like to thank Mr. Patrick Hale, director of the System Design and Management
Program at MIT, for giving me the opportunity to be a part of the amazing SDM community and advising me on my coursework and extracurricular engagements during my two and a half years at MIT.
I offer my sincerest gratitude to Dr. Samik Sengupta and Mr. Alex Potapov, my managers at
Synopsys Inc., for their unconditional support of my decision to return to school and pursue my education while still working fulltime at Synopsys with an extremely flexible schedule.
I would be remiss if I did not also express my gratitude to the entire MIT community
especially the SDM staff, my professors and my classmates for making my experience at MIT as enriching as it has been.
I save the lion's share of my gratitude for the most important person behind all that I have
been able to accomplish during my time at MIT. I thank my wife, Aditi, for not only putting with my crazy schedules for the last two and a half years but also for encouraging me to apply to the SDM program at MIT in the first place. I doubt I would have taken the bold decision to step out of my comfort zone and pursue a program as challenging and as demanding as SDM without her support before and throughout the course of the program. What seemed like an uphill battle at the beginning turned into a beautiful adventure that I will remember for the rest of my life.
Table of Contents
A b stra ct ... 3
A cknow ledgem ents... 7
List of Tables ... 11
List of Figures ... 13
Chapter 1: Introduction... 15
M otivation for the Thesis ... 15
Innovation and Collaboration...16
A n Overview of Social N etw ork Analysis ... 19
Chapter 2: Collaborative Innovation N etw orks (COIN s) ... 23
W hat is Sw arm Creativity? ... . . . 23
Chapter 3: Coolhunting and Coolfarm ing ... 27
A D eep-D ive into Coolhunting ... 27
A D eep-D ive into Coolfarm ing ... 31
Chapter 4: Coolhunting E-Mail and WebEx Communications ... 37
The D ata ... 37
Research Objectives ... 40
Research o s ... 42
Results of Coolhunting on E-M ail archives ... 44
Results of Coolhunting on W ebEx archives ... 51
Chapter 5: Coolfarming through Knowledge Flow Optimization ... 57
D iscussion on Correlations found in E-M ail analysis... 58
D iscussion on Correlations found in W ebEx analysis ... 61
Chapter 6: Conclusion... 67
Privacy Concerns... 68
Lim itations of the Analysis ... 68
Future W ork ... 69
List of Tables
Table 1 Average Attainments of Sales Professionals by Country ... 39
Table 2 Average Attainments of Sales Professionals by Primary Technology ... 39
Table 3 E-Mail: Correlations of Attainment with Network Metrics by Country ... 46
Table 4 Email: Correlations of Attainment with Network Metrics by Technology ... 47
Table 5 Correlations of Attainment with Network Metrics by Job Title... 49
Table 6 E-Mail: Correlations of Attainment with Network Metrics by Technology in United S tate s ... 5 0 Table 7 WebEx: Correlations of Attainment with Network Metrics by Country... 53
Table 8 WebEx: Correlations of Attainment with Network Metrics by Technology... 54
Table 9 WebEx: Correlations of Attainment with Network Metrics by Technology in United S tate s ... 5 5 Table 10 WebEx Usage among Sales Professionals... 64
List of Figures
Figure 1 Betweenness Centralities of Obama and Romney on Twitter in Ohio (Kulkarni, 2 0 12 )... 2 9 Figure 2 Betweenness Centralities of Obama and Romney on Twitter in Florida (Kulkarni,
2 0 12 ) ... 29
Figure 3 Coolfarming Framework (Gloor, et al., 2012) ... 31
Figure 4 Knowledge Flow Optimization (Gloor, et al., 2012)... 34
Figure 5 Geographical Distribution of Sales Professionals ... 38
Figure 6 Primary Technology/Product sold by Sales Professionals ... 38
Figure 7 Static Network of E-Mail Communication... 44
Figure 8 Contribution Index of actors in the E-Mail Network ... 45
Figure 9 Static Network of WebEx Communication... 51
Chapter 1: Introduction
Motivation for the Thesis
In fall of 2012 I took a course offered by Dr. Peter A. Gloor at the Sloan School of Management called Collaborative Innovation Networks (COINs). The course introduced me to the fundamentals of COINs and Coolhunting. It was a hands-on course and I was able to quickly start using Condor, a Social Network Analysis and Coolhunting software, to do cool things such as analyzing the social network embedded in my personal email network and analyzing data from online social networking sites such as Twitter to spot trends and make interesting predictions. The 2012 US Presidential race was in full swing at that time, which provided the right kind of fuel for predictive analysis using social networking sites and other online data. Using Condor I analyzed Twitter data on the days after the presidential and vice presidential debates to see what people liked, disliked and remembered from the debates. My further analysis of Twitter data using Condor one day before Election Day pointed towards Barack Obama victories in the states of Ohio and Florida, the two swing states whose loss would dramatically reduce Mitt Romney's chances of getting into the White House. Needless to say, I was elated after the actual results were announced. Barack Obama had won both Ohio and Florida. I will discuss some of these interesting findings later on as I dive deeper into Coolhunting and Social Network Analysis.
As part of the COINs course I was also working on a project with a team of 6 other students spread across four universities. Not only were we studying about COINs in class, but were also working as one. During the course of the semester we periodically analyzed the social network and the communication patterns of our own team. The findings of these analyses
were very insightful and helped us work better together. I was so fascinated by how effective Coolhunting using Social Network Analysis was that I was eager to apply the techniques to communication data at a much larger scale.
When I approached Dr. Gloor few months ago about possible thesis options in the areas that I had worked on during the course, particularly Social Network Analysis, he suggested applying the techniques to the communications archives of a large technology company to explain and improve success of Sales Professionals. Applying what I had learned through small projects to a real life scenario was a fabulous opportunity that I readily grabbed.
Innovation and Collaboration
It goes without saying that innovation is the key to continued success for almost all companies. Companies that fail to either innovate or successfully take innovative ideas to the market run out of business eventually. Research In Motion (now called Blackberry), the maker of the once ubiquitous Blackberry smartphones, is struggling to survive as it continues to lose market share to newer and cooler products such as the Apple iPhone and smart phones based on Google's Android operating system. Even Microsoft, with its massive resources and manpower is finding it difficult to make a dent in the smart phone market with its Windows based smartphones. There are several theories and frameworks that explain why companies tend to be more or less innovative than others. Clayton Christensen, in his magnum opus, Innovator's Dilemma (Christensen, 1997), writes about how successful companies
established companies fail to keep up with "disruptive" technologies while continuing to serve their largest customers through incremental improvements in their existing products.
We also see around us companies that are extremely innovative such as Google, Facebook, Apple and 3M among others. Innovation seems to be part of the culture in some of these companies. How does one make innovation part of their company culture? In this thesis I present the frameworks of Coolhunting (Gloor & Cooper, 2007) and Coolfarming (Gloor, 2011 a) which provide concrete guidelines for harnessing the collaborative power of groups of individuals to help drive innovation across organizations or self-organized groups.
Effective collaboration between individuals of a group is a powerful force that can drive innovation. Collaboration as an important factor in innovation has been widely studied. David Bicknell (Bicknell, 2009) highlights globally spread out teams and the organizations' necessity for faster responses to marketplace changes as the driving forces behind the prioritization of collaboration between the organizations' employees. Bicknell goes on to present the research of Computer Weekly which found that 70% of the respondents believe faster innovation to be a benefit of collaboration. The research also found that about a fifth of the respondents believe sharing of ideas, lower costs and time and better information diffusion to be the key benefits of collaborative tools that help drive innovation (Bicknell,
2009). Bill McCreary (McCreary, 2009) shows that collaboration over the web enables faster
design cycles and improves results and thus helps innovation. McCreary further predicted a growth in online collaboration tools that would help drive innovation and improve execution. We clearly see this trend today with the advent of collaborative technologies such a Google Docs and Dropbox.
The internet has empowered us to collaborate with others in ways that were not possible earlier. It has enabled globally distributed team to collaborate easily and effectively and enabled better sharing of knowledge within and across organizations. If leveraged to the fullest, collaboration over the web can be quite beneficial for a company. McCreary (McCreary, 2009) says that the web has enabled companies to include larger numbers of intelligent individuals in globally distributed teams. Building on the work of Zhang and Lowry (Zhang & Lowry, 2008), Fedorowicz, et al (Fedorowicz, et al., 2008) posit that collaboration is driving creativity and innovation among globally distributed teams of knowledge workers. They go on to emphasize the need of advanced web collaboration technologies for improving the effectiveness of globally distributed teams. According to Frangois et al (Frangois, et al., 2002), internet helps in the faster diffusion of information resulting in faster innovation and its subsequent marketing.
The role of the web in aiding collaboration and the role of collaboration in driving innovation are both well-established ideas. In this thesis I will explore the ideas of Swarm Creativity and Collaborative Innovation Networks (COINs) (Gloor, 2006) that help us understand how people collaborate over the web and what kind of communication patterns are indicative of better collaboration and hence innovation and creativity. I will apply the methods for detecting hidden COINs, called Coolhunting (Gloor & Cooper, 2007), to the communication archives of sales professionals of a large technology company. Based on the results of Coolhunting I will then make recommendations to the company on how to leverage the power of these COINs using the framework called Coolfarming (Gloor, 2011 a).
Coolhunting and Coolfarming are techniques based on Social Network Analysis (Gloor & Cooper, 2007). An overview of Social Network Analysis at this stage will help us better understand Coolhunting and Coolfarming which form the backbone of this thesis.
An Overview of Social Network Analysis
It is widely believed that the term "Social Network" was first used by John Barnes in 1954 (Wasserman & Faust, 1994). Social Network Analysis (SNA) has always been an interdisciplinary research area. According to Wasserman and Faust, researchers from fields such as anthropology, sociology and social psychology were at the forefront of early research in the field of SNA. Social Network Analysis is a powerful tool that helps explain complex aspects of society that are otherwise difficult to understand simply by looking at individuals. For instance, Bernard S. Cohn, an anthropologist, uses social network theory to explain how a country as diverse and as large as India remains united in spite of social, religious and political differences between its citizens (Cohn, 1987).
Wasserman and Faust (1994) describe Social Network analysis as a study of relationships between individuals and groups as opposed to the study of the individuals themselves, which is more common in traditional social science. The structures of such relationships and the ways in which they change over time are central to Social Network Analysis (Wasserman & Faust, 1994). In this thesis, the relationship between individuals that we will be looking at is the one between the sender and the receiver of an electronic message, either an E-Mail or a WebEx meeting invite or acceptance.
In traditional social network analysis, social networks were constructed using surveys and questionnaires directed towards individuals to determine their relationships with other individuals (Garton, et al., 1997). Garton, et al highlight the limitations of such an approach due to fact that the social networks thus created may be biased since they rely heavily on the recollection of the participating individuals. Online communication archives provide more precise representations of relationships between actors. Wellman, et al. (Wellman, et al.,
1996), use the term "computer-supported social networks (CSSNs)" to describe such social
networks embedded within computer mediated communications such as E-Mail. It has been found that the relationships formed in CSSNs are not merely the reflection of the real-world, but also show unique features endemic to the online world (Wellman, et al., 1996). This makes social network analysis of computer mediated communications an interesting add-on to traditional social network analysis. It can reveal a lot about how computer mediated communication has changed the way people collaborate and work together.
Social Network Analysis has a mathematical backbone that helps researchers and analysts quantify and measure the structures of the relationships and the uniqueness of the positions of individuals in the network. Wasserman and Faust's book on Social Network Analysis explains the mathematical fundamentals of SNA. For those new Social Network Analysis, I will describe some of the SNA jargon that will be used repeatedly in this thesis. The explanations provided here are derived from the Wasserman and Faust book (Wasserman & Faust, 1994).
" Actors: These are the social entities such as individuals, organizations or companies
that form one half of the social network to be analyzed. The other half is the relationships between these actors.
" Relation: A relation between actors is the set of ties of a particular type. In the social
networks embedded within E-Mail and WebEx communication archives, a relation between two actors is formed when one of them sends an E-Mail or a WebEx meeting invite or acceptance to the other.
" Centrality and Prestige: One of the key elements of Social Network Analysis is to
figure out which actors are important and which are not based on the relationships and their structure in the network. Wasserman and Faust use the word "Prominence" to describe the importance of an actor. They define "centrality" as a measure of prominence computed using non-directional relationships and "prestige" as a measure of prominence computed using directional relationships. Both these measures tell very different stories about an actor's prominence. Imagine looking at Bill Gates' connections on LinkedIn. You can assume to a large extent that the people connected to Bill Gates are prominent. Now imagine if you could split the connections into those that sent Bill Gates an invite to connect and those that received an invitation from Bill Gates to connect. This tells a whole different story. Knowing who sent whom an invite tells a lot more about an actor's prominence than does the mere connection. A measure of prominence based on simply being connected to Bill Gates would be a centrality and a measure based on who invited whom would be prestige. In this thesis I will only be looking at various measures of centrality.
" Degree Centrality: This is a measure of how many other actors does one actor
directly have relationships with. Degree centrality is a local measure and only looks at an actor's direct connections.
" Betweenness Centrality: This is a more global measure compared to degree
centrality. It takes into account more than just the direct connections of an actor. In communication networks such as E-Mail and WebEx, betweenness centrality is a measure of an actor's ability to influence how and whether information flows in the network by virtue of his or her position. Consider the shortest paths connecting every pair of actors in the social network. Mathematically then, betweenness centrality of an actor is the sum of the probabilities that that actor happens to be on the shortest path connecting any pair of actors other than himself. Intuitively, actors have high betweenness centralities if they have relationships with two or more groups of actors who otherwise would have been disconnected from each other.
Throughout this thesis I will be using degree and betweenness centralities as the measures of prominence in the E-Mail and WebEx communication networks. In addition to degree and betweenness centralities, I will also be looking at changes in these measures over time and some other custom social network metrics designed specifically for such communication networks called Contribution Index and Average Response Time. I will talk more about these in subsequent chapters.
Chapter 2: Collaborative Innovation Networks (COINs)
In his book Swarm Creativity (Gloor, 2006), Gloor defines Collaborative Innovation Networks (COINs) as follows:
"A COIN is a cyberteam of self-motivated people with a collective vision, enabled by the Web to collaborate in achieving a common goal by sharing ideas, information, and work"
What is Swarm Creativity?
Gloor goes on to posit that COINs have amazing potential for innovation and form some of the most efficient innovation machines. Gloor describes the process of innovation unleashed
by COINs as "Swarm Creativity". He uses the term "swarm" to differentiate the apparent
chaos that may be seen in COINs from that seen in crowds. Crowds do not have a clear direction, but swarms, similar to those of bees or -ants, work towards a common goal. Building on the work of Eric Bonabeau who first applied the term "swarming" outside the world of arthropods, the other aspect of swarm creativity the Gloor talks about is the collective intelligence of the swarm which is much greater than that of any single individual (Gloor, 2006). In his writings Gloor repeatedly uses the analogy of a swarm of bees trying to find a new site for their hive to describe the workings of a COIN. Gloor highlights the following crucial characteristics of COINs (Gloor, 2006):
" Innovation and creativity in COINs is driven by collaborative efforts of the members " Members of a COIN collaborate over a common vision and end goal
" There exists a stringent code of ethics for the said collaboration
" Communication within the COIN happens through "direct-contact networks" and not
through traditional organizational hierarchies
" Members of COINs openly share their ideas with other members leading to a
proliferation of ideas and democratization of idea selection for further pursuance.
Gloor explains the inner workings of COINs with the help of several examples. One of them is the team behind the development of the World Wide Web. Although the ideas of the Web and hypertext were presented by multiple researchers several decades ago, Tim Berners-Lee was the one who was responsible for taking the ideas from inception to what we know today as the World Wide Web (Gloor, 2006). According to Gloor the presentation by Tim Berners-Lee and Robert Cailliau at a San Antonio conference and the subsequent release of the "Mosaic" browser by Marc Andreesen of the National Center for Supercomputing Applications (NCSA) proved to be the point of inflection when the development of the Web really took off. Gloor points out how a self-motivated team of web developers from across the Finland, Austria, Germany, France and California started developing servers and web browsers that eventually led to the creation of the World Wide Web. These groups of developers, according to Gloor, exhibited several characteristics of COINs.
Another example of a COIN that I have come across during my readings on innovation is the team behind the design of the Alpha Chip at Digital Equipment Corporation (DEC). Ralph Katz (Katz, 2004) vividly describes how a team of self-motivated designers got together to design a RISC processor, called Alpha, when its predecessor was cancelled in favor of an
Designer of the chip, was instrumental in convincing the management at DEC to let the Alpha chip project continue in spite of wide spread skepticism about it. Dobberpuhl's team, determined to make their mark and prove everyone wrong, self-organized with the sole purpose of designing the industry's fastest RISC processor (Katz, 2004). The story narrated
by Katz in the book highlighted the following aspects of the Alpha chip team that I could
directly relate to the key characteristics of COINs:
" The team was composed of self-motivated engineers and designers. " The team had a shared vision.
" The team built on DEC's flexible structure where projects and ideas were selected
democratically.
" The team did not believe in centralized leadership.
" The team believed in collaborating freely and solving problems creatively.
Collaboration was achieved through meetings that encouraged open sharing of ideas and constructive feedback from peers.
" The team collaborated with other teams in the company such as the computer-aided
design team for tools and expertize that the Alpha chip team did not possess. In these collaborations also the Alpha team defied traditional hierarchies and pursued direct collaboration with the other teams.
These are all classic characteristics of COINs (Gloor, 2006). The product that emerged from this collaboration, the Alpha Chip, was widely regarded as a breakthrough product in the microprocessor industry (Katz, 2004).
The power of Swarm Creativity and COINs is easily visible through these examples. In addition to driving innovation COINs present other benefits to organizations. Just a few of them are listed here (Gloor, 2006).
* COINs help companies to react faster to changing market conditions and technologies
" COINs help bring outside knowledge into the company
" COINs can be more effective than their competition in finding new business
opportunities
" COINs help in curtailing costs and enabling shorter times to market
* COINs help in identifying individuals with deep knowledge and expertise
" COINs help members in building their networks and thus optimizing the sharing of
important business information
* COIN members tend to become experts in their fields and grow faster in the organization
Chapter 3: Coolhunting and Coolfarming
Having understood what swarm creativity is and how effective COINs are, a natural question comes to mind: How does one harness the power of these COINs and instill swarm creativity throughout an organization? This is where the techniques and frameworks of Coolhunting and Coolfarming come into the picture. Coolhunting is a set of techniques based on Social Network Analysis that are used to detect trends and trendsetters in the marketplace and to stimulate innovation within an organization by identifying COINs (Gloor & Cooper, 2007). Coolfarming on the other hand is a framework for taking ideas from conception to reality by unleashing Swarm Creativity (Gloor, 2011 a). It involves nurturing of existing COINs within an organization (Gloor, et al., 2012).
A Deep-Dive into Coolhunting
The origin of the use of the word "cool" with a positive connotation dates back to right after the World War II when jazz musicians started using it to describe something that was outstanding (Gloor & Cooper, 2007). In the context of Coolhunting, Gloor and Cooper define cool not only as an adjective for things that are associated with fun, but also things/trends that "make the world a better place" (Gloor & Cooper, 2007). They define Coolhunting as a set of techniques for finding not only cool products and trends, but also people who work together as innovative groups. Finding such groups of innovative people is the aspect of Coolhunting that helps us detect COINs in large organizations.
Cooper and Gloor describe two distinct applications of Coolhunting. The first one deals with looking outwards and detecting trends and cool products in the marketplace and the second one deals with looking inwards and harnessing the power of COINs that exist within the organization (Gloor & Cooper, 2007).
The outward looking Coolhunting is collectively referred to as "Web Coolhunting" (Gloor,
2007). In his paper Gloor describes techniques of Web Coolhunting to determine which
brand names or famous personalities people like most (Gloor, 2007). Gloor demonstrates the use of the tool TeCFlow, which later became Condor, to mine the web including blogs and Wikipedia to measure Social Network centralities such as betweenness and to visualize linked networks on the web. These metrics and structures were then used to determine how popular a particular brand or celebrity was. Web Coolhunting can also be applied to the analysis of data on social networking sites such as Twitter for performing predictive analysis such as predicting stock markets (Zhang, et al., 2010).
As part of the COINs course that I took under Dr. Gloor in 2012, I used Condor to perform Web Coolhunting on Twitter and Blogs as a basis predicting the results of the Presidential Election. My analysis using Condor one day before Election Day pointed towards Barack Obama victories in the states of Ohio and Florida, the two swing states whose loss would dramatically reduce Mitt Romney's chances of getting into the White House. Figure 1 and Figure 2 show the social networks and betweenness centralities of the words Obama and Romney in Tweets in Ohio and Florida respectively. Obama had higher betweenness centralities in both the states. Needless to say, I was elated after the actual results were
Coolhunting is available at http://socialnetworkdata.blogspot.com/2012/1 1/florida-and-ohio-deciding-factors-in.html (Kulkami, 2012).
Figure 1 Betweenness Centralities of Obama and Romney on Twitter in Ohio (Kulkarni, 2012)
The inward looking Coolhunting deals with analyzing social networks within an organization to uncover relationships between individuals, quantify communication patterns and compute social network prominence metrics such as degree and betweenness centralities. This generally involves automated analysis of e-mail archives, chat sessions, phone conversations, etc. (Gloor, 2007). Over the years Dr. Gloor has undertaken several projects involving organizational network analysis using e-mail and other communication archives and found communication patterns that are indicative of various traits of the group such as creativity, execution effectiveness and leadership. For instance Kidane and Gloor (Kidane & Gloor,
2007) show that oscillation in betweenness centrality implies higher levels of creativity and
stability in betweenness centrality implies execution excellence. In another analysis of E-mail archives of 42 consultants Hybbeneth, Gloor and Brunnberg (Hybbeneth, et al., 2013) found lower oscillation in betweenness centralities, which was indicative of lower creativity and higher execution excellence. Yet another project showed how excess email was detrimental to job satisfaction (Merten & Gloor, 2009).
As is evident from prior Coolhunting projects, Social Network Analysis of organizational communication archives can reveal a lot about how people communicate and how creative they are. It is a window into finding COINs within an organization.
A Deep-Dive into Coolfarming
If one side of the coin is Coolhunting, the other is Coolfarming. Whereas Coolhunting
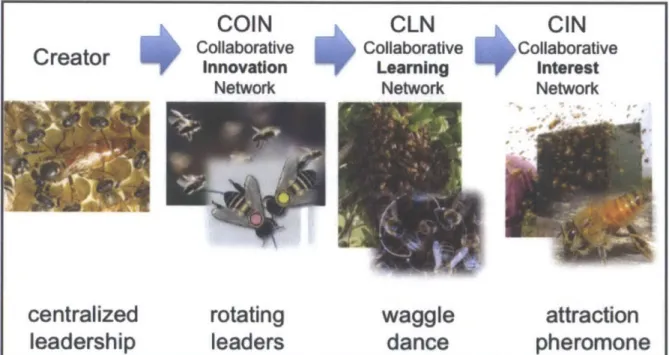
pertains to detecting cool trends and COINs, Coolfarming pertains to taking new ideas and making them big and creating and nurturing COINs to unleash Swarm Creativity (Gloor, 2011 a). There are two applications of Coolfarming. First is taking ideas from conception to reality using the Creator, Collaborative Innovation Network (COIN), Collaborative Learning Network (CLN) and Collaborative Interest Network (CIN) framework (Gloor, 2011a). Second is nurturing existing COINs using Knowledge Flow Optimization (Gloor, et al., 2012). Let us look at each one in detail.
We have already seen the power of COINs. Coolfarming helps us unleash this power to take new ideas and make them big using the framework described in Figure 3.
COIN
Collaborative Innovation NetworkCLN
Collaborative Learning NetworkCIN
Collaborative interest Networkcentralized
leadership
rotating
waggle
leaders
dance
attraction
pheromone
Figure 3 Cooltairming Framework (Gloor, et al., 2012)Gloor draws an analogy between Coolfarming of new ideas and the process of finding a new location for a hive by bees. The Coolfarming process is comprised of the following four stages that an idea goes through before becoming big (Gloor, 2011 a).
1. Creator
2. Collaborative Innovation Network (COIN)
3. Collaborative Learning Network (CLN)
4. Collaborative Interest Network (CIN)
Gloor recommends following these four stages for taking an idea from inception to reality. It is clear that simply coming up with an idea does not guarantee that it will turn into something worthwhile. Gloor points out how different the levels of success were for Eduard-Leon Scott de Martinville and Thomas Alva Edison in spite of both having come up with revolutionary ideas (Gloor, 2011 a). Gloor believes Edison had what it took to be a Creator and a Coolfarmer. A good Coolfarmer, Gloor says, possesses "social intelligence", which lets him/her recruit peers who are passionate about the new idea and are willing to work on it with a shared vision. This group of peers that grabs onto to the creator's vision forms the second stage of Coolfarming, the Collaborative Innovation Network (Gloor, 2011 a). We have already seen how powerful COINs are when it comes to innovation. After a product emerges from the idea as a result of the COIN's swarm creativity, the COIN members recruit people close to them such as family members and friends to try out the product. This forms the next stage of Coolfarming called Collaborative Learning Network (CLN) (Gloor, 2011 a). Gloor says that the CLN is the network of early adopters that form a source of feedback to the
Collaborative Interest Network (CIN), which comprises of large numbers of users that love the product and help push it beyond the "tipping point" and ensure that it becomes a success (Gloor, 2011 a). According to Gloor the CIN gets created through word of mouth and may consist of thousands of individuals that help spread the product throughout the marketplace at large.
In the swarm of bees' analogy, Gloor, Margolis, Seid and Dellal describe the Coolfarming process as follows (Gloor, et al., 2012). The queen bee acts as the creator who wishes to start a new hive. She recruits other bees that also believe in the idea of starting a new hive. The swarm then picks out experienced bees to vet different locations for the new hive. These bees form the COIN and Coolhunt for new locations. They work together and exhibit rotating leadership as they vote on the suitability of each other's hive locations. The next step of Coolfarming involves the COIN bees convincing each other and the rest of the bees to pick one of the locations. This process creates the CLN. The higher the intensity of a bee's waggle dance the stronger is her pitch for the location she has picked. Finally, after a suitable location has been voted for and picked, the rest of the bees, which form the CIN follow the
COIN to the new hive location with the help of a scent called the attraction pheromone that
the COIN bees have already used to identify the new location.
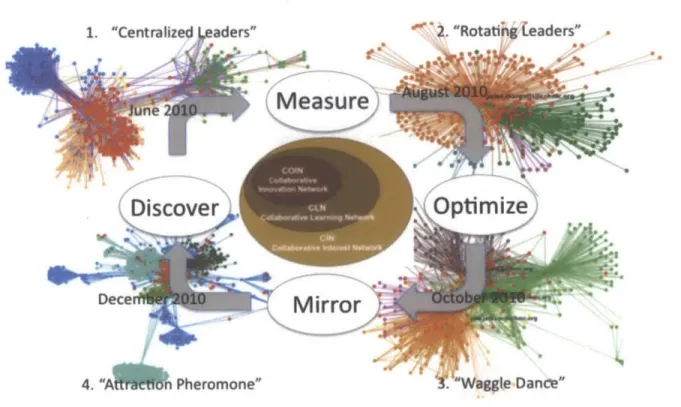
The second aspect of Coolfarming involves nurturing of COINs through a process called Knowledge Flow Optimization (Gloor, et al., 2012). Figure 4 shows the Knowledge Flow Optimization process superimposed on the Coolfarming stages in the C3N Coolfarming project (Gloor, et al., 2012).
1. "Centralized aders" ne
Measure
Discover
2. "Rotating leaders"Optimize
6:'
Mirror
4. "A^ .n Pheromone" l "Waggle Dance"
Figure 4 Know'ledge Flow Optimization (Gloor, et al.. 2012)
The following steps together represent the Knowledge Flow Optimization process (Gloor, et al., 2012).
1) Discover
The goal of this step is to create a Social Network of people in the organization that can be analyzed (Gloor, et al., 2012). Since social networks are nothing but representations of relationships between actors (Wasserman & Faust, 1994), a variety of relationships can be used to construct such a network. If sending and receiving electronic messages is the relationship, as is the case in point for this thesis, then the E-Mail and WebEx archives form the Social Networks to be analyzed.
2) Measure
The goal of this step is to analyze the social network(s) defined in the discover step and quantify social network metrics (Gloor, et al., 2012). Social network metrics include centrality measurements and any other metrics specific to the particular social network such as Contribution Index for E-Mail and WebEx, which I will discuss in detail as we go forward. This step also involves using these metrics to understand which metrics and patterns are correlated with success, innovation or execution and identify influential actors in the network that may not be easily identifiable otherwise (Gloor, et al., 2012).
3) Optimize
Having measured and analyzed the social network, the insights so gathered are used in this step to optimize the network in such a way as to nurture existing COINs and create new ones (Gloor, et al., 2012). It can be seen from several of Dr. Gloor's papers that communication patterns that determine success vary quite a bit from organization to organization and from application to application. The specific communication patterns that work for the current application are promoted by optimizing the social network using various techniques including getting rid of bottlenecks that arise from members who are burdened with more than their fair share of work, rewarding high performing experts and so on. (Gloor, et al., 2012)
4) Mirror
In this final step, the results of the social network analysis and the communication patterns associated with better performance, creativity or anything else that the business strategy demands are shared with the individuals in the social network so that they can adapt their communication patterns accordingly (Gloor, et al., 2012). Communication patterns can be periodically measured and "mirrored" back to the individuals on an on-going basis so that they can fine-tune their communication to become more effective in their roles. (Gloor, et al., 2012)
Having understood the techniques and frameworks of Coolhunting and Coolfarming we can now move on to the application of these to the communication archives of a large technology company. In the next two chapters I will be using Condor to perform Coolhunting on the communication archives and using the Knowledge Flow Optimization framework to Coolfarm the COINs in the sales team of the company.
Chapter 4: Coolhunting E-Mail and WebEx Communications
In this thesis I have performed Coolhunting using Condor on the E-Mail and WebEx communication archives of a large technology company. The company is a Fortune 500 technology company that operates in diverse technology markets with a wide range of hardware and software products. The name of the company shall remain confidential throughout the thesis.
The Data
Under a non-disclosure agreement (NDA) with Galaxy Advisors, a company founded by Dr. Gloor, I was provided access to anonymized meta-data of E-Mail and WebEx communications that took place in the company in March of 2013. The NDA restricts me from sharing the name of the company and the actual data, but permits me to share the results of the research for academic purposes. The E-Mail data consisted of communications in the last 2 weeks of March 2013. WebEx data consisted of meeting invites and acceptances during the entire month of March 2013.
In addition to the communication archives I was provided with the metric used by the company to gauge the success of their Sales Professionals. The metric is called "Attainment", which is a normalized measure of how well a sales professional performed during a given period in relation to his/her sales targets. The data consisted of Attainment values for 600 sales professionals. The 600 Sales Professionals worked in various geographical regions and sold a wide range of products.
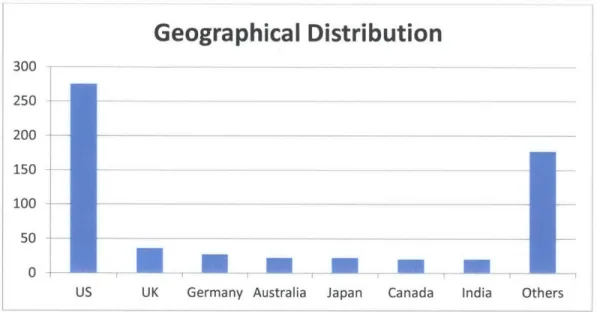
Following charts show the geographical distribution and products/technology that the sales professionals worked on selling.
Geographical Distribution
300 250 200 150 100 50 US- s -Um J C d nus UK Germany Australia Japan Canada India Others
Figure 5 Geographical Distribution of Sales Professionals
Primary Technology
450 400 --350 300 250 200 --150 100 50 0The Attainment values of the sales professionals showed a wide range with some sales professionals performing considerably better than others. Following tables show the most and least successful sales professionals by country and primary technology. I am providing average attainment values for only those countries and technologies that have a large enough representation for performing statistical analysis.
Table I Average Attainments of Sales Profissionals by Country
Country Average Attainment ProfeSals
Germany 102.24 21 United States 97.79 275 UK 93.23 27 India 91.11 15 France 86.72 13 Japan 84.86 12 Australia 77.47 19
Table 2 Average Attainments of Sales Proqessionals by Primaty Technology
# of Sales
Technology Average Attainment Professionals
Contact Center 92.88 40
Collaboration 91.88 397
Video 76.95 60
Research Objectives
As highlighted in Chapter 3, Coolhunting projects from the past have revealed several communication patterns that are indicative of qualities such as execution excellence and swarm creativity among teams. Kidane and Gloor (Kidane & Gloor, 2007) have shown that oscillation in communication patterns, an indicator of rotating leadership, implies higher levels of creativity and stability in communication patterns, an indicator of centralized leadership, implies execution excellence. Kidane and Gloor also posit that groups that alternate between stable and oscillating communication patterns perform better. In another analysis of E-mail archives of 42 consultants Hybbeneth, Gloor and Brunnberg (Hybbeneth, et al., 2013) have found similar results that show less oscillation in betweenness centralities was indicative of lower creativity and higher execution excellence. In another Coolhunting project targeted towards determining correlations between job satisfaction and E-Mail usage, Merten and Gloor (Merten & Gloor, 2009) have shown that excess email was detrimental to
job satisfaction. Merten and Gloor also found that responsiveness to E-Mails was possibly
indicative of a team's satisfaction levels. In yet another Coolhunting project, Brunnberg, Gloor and Giacomelli (Brunnberg, et al., 2013) found that responsiveness to emails was indicative of better customer satisfaction.
A lot of research has also been done on different modes of communication used by groups
and how they affect collaboration and trust among team members. A common theme in the comparison between face-to-face communication and computer mediated communication is the lack of "richness" in computer mediated communication. Ehsan, Mirza and Ahmad (Ehsan, et al., 2008) describe the Medium-Richness Theory (MRT) first proposed by Daft and Lengel in 1986. According to the theory, the richness of the communication medium determines the quality of information exchange over the medium (Ehsan, et al., 2008). According to the authors, MRT measures richness based on a medium's ability to convey elements of a person's personality and the medium's ability to enable a quick feedback mechanism between the users. In this Coolhunting endeavor, I have analyzed two forms of online communication: E-Mail and WebEx. WebEx is a communication platform that offers
capabilities such as voice communication, video communication and document sharing (WebEx, n.d.).
Based on prior research findings in both Coolhunting and computer mediated communication, I set forth the following hypotheses to be validated through the social network analysis of E-Mail and WebEx communication archives.
Hypothesis 1: The more the communication patterns oscillate between centralized and
rotating leadership, better is the sales success.
Hypothesis 2: The fewer E-Mails sales professionals receive the better is their sales success Hypothesis 3: The faster sales professionals respond to their E-Mails, the better is their sales
success.
Hypothesis 4: WebEx is a more effective collaboration platform than E-Mail for doing
Research Methods
Coolhunting was performed using Condor which is a software developed by Dr. Gloor and Yan Zhao (Gloor, et al., 2012), and the communication patterns and social network metrics of the sales professionals were calculated. Once quantified these metrics were used as explanatory variables in the correlation analysis with the independent variable, Attainment.
For feasibility of analysis in terms of computing power and time required, the E-Mail communication network was pruned to contain the 600 sales professionals and 3000 top actors by communication frequency. Similarly the WebEx network was pruned to contain the
600 Sales professionals and 5000 top actors by communication frequency. Hybbeneth,
Brunnberg and Gloor (Hybbeneth, et al., 2013) indicate that such sampling is still more or less indicative of the true underlying social network structure.
Condor is a powerful Coolhunting tool and lets us measure the following metrics among other things:
" Betweenness Centrality: as defined in Chapter 1 " Degree Centrality: as defined in Chapter 1
" Contribution Index: This is a measure of how many messages an actor sends in
relation to those he/she receives. The value ranges from -1 to +1. 0 indicates a
perfectly balanced communication patterns, i.e. the actor sends the same number of messages as he/she receives. -1 indicates that the actor only receives messages, but doesn't send any. +1 indicates the exact opposite, i.e. the actor only sends messages,
" Oscillation Frequency of Betweenness Centrality: This metric indicates how an
actor's Betweenness centrality changes over time.
* Oscillation Frequency of Contribution Index: This metric indicates how an actor's
Contribution Index changes over time.
" Average # of pings before an actor responds: This metric give the average number
of messages an actor needs to receive from another actor before he/she responds to that actor. It is a measure of an actor's responsiveness.
" Average Response Time: This is another measure of an actor's responsiveness. It is
the absolute time elapsed between an actor receiving a message and he/she responding to it.
" Average number of messages an actor receives from other actors: This is a
measure of the quantity of email received by an actor from each of the other actors in his/her immediate network
These metrics formed the set of explanatory variables used in the correlation analysis with the independent variable, Attainment.
Correlation analysis was done using SPSS statistical computing software from IBM. Pearson Coefficients and two-tailed significance values were computed for correlations of Attainment with each of the explanatory variables. Correlations were considered significant for p-values <=0.05.
Results of Coolhunting on E-Mail archives
Figure 7 shows the E-Mail communication network of the 600 sales professionals along with
3000 top actors by communication frequency generated by Condor. The blue dots represent
the sales professionals and the red dots represent other actors including other employees of the company and possibly actors outside the company.
Condor was used to measure the social network metrics and communication patterns as described in the Research Methods section earlier. The following image shows the Contribution Index of all the actors in the network.
U U a U U U 0
a Contribution Index of actors
Figure 8 Contribution Index of actors in the E-Mail Network
The Correlation analysis of the network and communication metrics generated using Condor with the Attainment values yielded several interesting observations. Table 3 shows the significant correlations between Attainment and various metrics for sales professionals from different countries.
45
11 11 11 - .1. I I ... I ... .... .. I ... I - -- ...
Correlations of Attainment with Network Metrics by Countrv
Pearson Significance Number of
Country Metrc Coefficient (p-value)
Actors (N)
Canada Average # of -0.449 0.047 20
Messages
Germany Average # of -0.364 0.062 27
Messages
Germany Average Response -0.419 0.029 27
Time (ART)
Contribution
India Oscillation -0.473 0.035 20
Frequency
Japan Degree Centrality -0.438 0.042 22
United States Contribution -0.135 0.026 275
Index
United States Average # of -0.128 0.034 275
Pings
The correlations show that:
* Canadian and German sales professionals did better when they received fewer emails, as seen from the negative correlation with Average # of Messages. The correlation for Canada was very significant (p=0.047) and that for Germany was moderately significant (p=0.062).
* American and German sales professionals did better with they responded quicker to
* American sales professionals did better when they received more email than they sent as seen from the weak yet significant negative correlation with contribution index. * Indian sales professionals did better when their contribution index was stable, as seen
from the significant negative correlation with oscillation frequency of contribution index.
* Japanese sales professionals did better when they had fewer connections as seen from the negative correlation with degree centrality.
Table 4 shows the correlations of Attainment with various network metrics across different technologies that the sales professionals were selling.
Table 4 Email: Correlations of Attainment with Network Metricsby Technology
Technology Metric Pearson Significance Number of
Coefficient (p-value) Actors (N)
Collaboration Betweenness Oscillation Frequency 0.123 0.014 397
Contact Center Contribution Oscillation Frequency -0.383 0.015 40
Workspace Betweenness Centrality 0.305 0.003 94
Workspace Degree 0.414 0.000 94
The correlations show that:
* Sales Professionals in Collaboration did better when their betweenness centrality, a measure of prominence, changed over time as seen from the positive correlation with oscillation in betweenness centrality.
" Sales Professionals in Contact Center did better when their contribution index was
stable, as seen from the significant negative correlation with oscillation frequency of contribution index.
" Sales Professionals in Workspace did better when they were in influential network
positions, connected with a lot of people and sent a lot of email as seen from strong and significant positive correlations with Betweenness Centrality, Degree Centrality and Contribution Index.
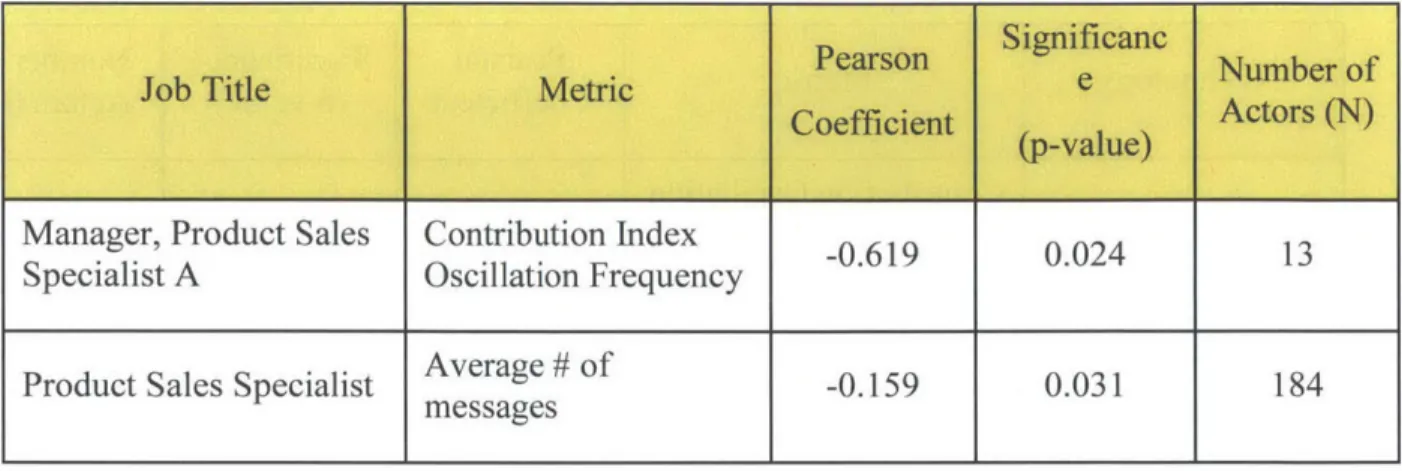
Table 5 shows the significant correlations of Attainment with various network metrics when the sales professionals were grouped by their job titles. The correlations show that,
" Managers did better when their contribution index was more stable as is seen from the
negative and significant correlation with oscillation frequency of contribution index.
Table 5 Correlations ofAttainment with Network Metrics bhy Job Title
Since United States had the largest representation (275 sales professionals) in the group of
600, I ran correlations across different technologies within the United States. Table 6 shows
the significant correlations across different technologies in the United States.
The findings were similar to what was seen for worldwide sales professionals in Workspace, and Contact Center. In addition,
* Sales professionals in Collaboration did better when their contribution index changed frequently as seen from the positive correlation with oscillation frequency of contribution index. In other words they did better when they switched between sending more emails than they received and vice versa.
* Sales professionals in Video did better when they received a lot of email as seen from the positive correlation with average number of messages. This was not observed in worldwide analysis of sales professionals in Video.
Pearson Significa Number of
Job Title MetriceNubro
Coefficient Actors (N)
(p-value)
Manager, Product Sales Contribution Index -0.619 0.024 13
Specialist A Oscillation Frequency
Product Sales Specialist Average # of -0.159 0.031 184
Table 6 E-Mail: Correlations of Attainment with Network Metrics by Technology in United States
Pearson Significance Number of
Technology Metric Coefficient (p-value) Actors (N)
Collaboration Contribution Oscillation 0.145 0.067 159
Frequency
Contact Center Contribution Oscillation -0.472 0.013 27
Frequency
Video Average # of Messages 0.446 0.049 20
Workspace Betweenness Centrality 0.296 0.018 64
Workspace Degree Centrality 0.409 0.001 64
Results of Coolhunting on WebEx archives
Figure 9 shows the WebEx communication network of the 600 sales professionals along with
5000 top actors by communication frequency generated by Condor. The blue dots represent
the sales professionals and the red dots represent other actors including other employees of the company and possibly actors outside the company. It should be noted that the communication network on WebEx is quite sparse compared to the E-Mail network seen earlier. However, this isn't a surprise since E-Mail is still the most widely used form of computer mediated communication.
Figure 9 Static Network of WebEx Communication
Condor was used to measure the social network metrics and communication patterns as described in the Research Methods section earlier.
Figure 10 shows the Contribution Index of all the actors in the network.
Figure 10 Contribution Index of actors in the WebEx Network
The Correlation analysis of the network and communication metrics generated using Condor with the Attainment values yielded several interesting observations for the WebEx communication archives as well. Table 7 shows the significant correlations between Attainment and various metrics for sales professionals from different countries. The correlations show that:
* Sales Professionals from Canada, Germany and United States did better when they communicated with more people over WebEx as is seen from the positive and significant correlations with Degree Centrality. Germany's correlation was moderate
" Sales Professionals from Canada, Germany and United States also did better when
their contribution index changed a lot as is seen from the positive and significant correlations with Oscillation Frequency of Contribution Index. In other words they did better when they switched between sending more invites than they received and vice versa. Germany's correlation was moderate to not significant (p=0.084).
* Sales Professionals from United States and France did better when they hosted more WebEx meetings than they attended as is seen from the positive and significant correlations with Contribution Index.
Table 7 WebEx: Correlations ofAttainment with Network Metrics by Country
Country Metric Pearson Significance Number of
Coefficient (p-value) Actors (N)
Canada Degree Centrality 0.518 0.019 20
Canada Contribution Oscillation 0.577 0.008 20
Frequency
Germany Degree Centrality 0.366 0.072 25
Germany Contribution Oscillation 0.353 0.084 25
Frequency
United States Degree Centrality 0.223 0.000 254
United States Contribution Oscillation 0.194 0.002 254
Frequency
United States Contribution Index 0.123 0.05 254
Table 8 shows the significant correlations of Attainment with various network metrics from WebEx communications drilled down by Technology. Consistent with what was seen in the analysis drilled down by country, these correlations show that:
* Sales Professionals in Collaboration and Video groups did better when they communicated with more people over WebEx as is seen from the positive and significant correlations with Degree Centrality. Video's correlation was almost very significant (p=0.056).
* Sales Professionals in Collaboration and Video groups also did better when their contribution index changed a lot as is seen from the positive and significant correlations with Oscillation Frequency of Contribution Index.
Table 8 WebEx: Correlations ofAttainment with Network Metrics by Technologv
Pearson Significance Number of
Technology Metric Coefficient (p-value) Actors (N)
Collaboration Degree Centrality 0.145 0.004 386
Collaboration Contribution Oscillation 0.120 0.018 386
Frequency
Video Degree Centrality 0.245 0.056 61
Video Contribution Oscillation 0.294 0.021 61
Frequency
down by technology for United States. The findings are consistent with earlier findings for WebEx.
* Sales Professionals in Collaboration and Video groups did better when they communicated with more people over WebEx as is seen from the positive and significant correlations with Degree Centrality. Collaboration's correlation was moderate to not significant (p=0.077).
* Sales Professionals in Collaboration and Video groups also did better when their contribution index changed over time as is seen from the positive and significant correlations with Oscillation Frequency of Contribution Index.
* Sales Professionals in Video group did better when they hosted more WebEx meetings than they attended as is seen from the positive correlation with Contribution Index. The correlation is moderately significant (p=0.069).
Table 9 WebEx: Correlations o *Attainment with Network Metrics by Technology in United States
Technology Metric Pearson Significance Number of
Coefficient (p-value) Actors (N)
Collaboration Degree Centrality 0.189 0.017 158
Collaboration Contribution Oscillation 0.141 0.077 158
Frequency
Video Degree Centrality 0.456 0.05 19
Video Contribution Oscillation 0.604 0.006 19
Frequency
In the preceding sections we have seen several interesting and significant correlations between Attainment and the network metrics computed by Condor. In the next chapter I will attempt to interpret these correlations based on previous research and apply the Knowledge Flow Optimization framework of Coolfarming to make recommendations to the company on how they could leverage Swarm Creativity to their advantage.