HAL Id: hal-01731502
https://hal.archives-ouvertes.fr/hal-01731502
Submitted on 14 Mar 2018
HAL is a multi-disciplinary open access
archive for the deposit and dissemination of
sci-entific research documents, whether they are
pub-lished or not. The documents may come from
teaching and research institutions in France or
abroad, or from public or private research centers.
L’archive ouverte pluridisciplinaire HAL, est
destinée au dépôt et à la diffusion de documents
scientifiques de niveau recherche, publiés ou non,
émanant des établissements d’enseignement et de
recherche français ou étrangers, des laboratoires
publics ou privés.
Crowded spot estimator for urban cellular networks
Sahar Hoteit, Stefano Secci, Marco Premoli
To cite this version:
Sahar Hoteit, Stefano Secci, Marco Premoli. Crowded spot estimator for urban cellular networks.
Annals of Telecommunications - annales des télécommunications, Springer, 2017, 72 (11-12),
pp.743-754. �10.1007/s12243-017-0591-6�. �hal-01731502�
(will be inserted by the editor)
Crowded Spot Estimator for Urban Cellular
Networks
Sahar Hoteit · Stefano Secci · Marco Premoli
Received: date / Accepted: date
Abstract The real-time detection of crowded spots in access networks is con-sidered nowadays a necessary step in the evolution of mobile cellular networks as it can be of great benefit for many use-cases. On the one hand, a dynamic positioning of contents and computing resources in the most crowded regions can lower connection latency and data loss and can allow us to have a seam-less service provided for the users, without performance degradation across the network. On the other hand, a dynamic resource allocation among access points taking into account their loads can enhance the user’s quality of ser-vice and indeed network performances. In this context, using real mobile data traces from a cellular network operator in France, provided us with a tempo-ral and spatial analysis of user content consumption habits in different French Metropolitan areas (Paris, Lyon and Nice). Furthermore, we put to use a real-time crowded spot estimator computed using two user mobility metrics, using a linear regression approach. Evaluating our estimator against more than one million user databases from a major French network operator, it appears to be an excellent crowd detection solution of cellular and backhauling network management. We show that its error count definitely decreases with the cell load, and it becomes very small for reasonable crowded spot load reaching
S. Hoteit
Ecole d’ingénieurs du numérique ISEP
10 rue de Vanves, 92130 Issy les Moulineaux, France Tel.: +33 (0) 1 49 54 52 49
E-mail: [email protected] S. Secci
Sorbonne Universities, UPMC Univ. Paris 06, UMR 7606, LIP6 F-75005, Paris, France
Tel.: +33 (0) 1 44 27 36 78 E-mail: [email protected] M. Premoli
Università di Milano, Milan, Italy E-mail: [email protected]
upper thresholds. We also show that our crowded spot estimator is time and city-independent as it shows a stable behavior for different times of the day and for different cities with different topographies. Furthermore, compared to another crowded spot estimator from the literature, we show that our pro-posed estimator offers more suitable and accurate results in terms of crowded spot estimation for the three selected areas.
Keywords Mobile Data · Crowded Spot Estimation · Radius of Gyration
1 Introduction
As a matter of fact, we are witnessing the by-passing of a second decennial milestone in the evolution of telecommunications since the arrival of commer-cial Internet in 1992. After data traffic overcoming voice traffic in the begin-ning of the current century, we are noticing nowadays the increase of mobile data traffic at a very rapid pace. According to Cisco, mobile data traffic is expected to grow two times faster than global IP fixed traffic from 2016 to 2021 [2]. Besides, according to Mediametrie Institute [3], more than 31% of French mobile users use a smartphone, and about 71% of them connect to the Internet on a daily basis. The advent of smartphones, tablets and Internet keys, with generous processing and memory capacity, is shifting the network engineering attention from core networks and wireline local loops to the mo-bile cellular network. At present, techniques typically implemented in wireline network engineering are being considered for cellular access and backhauling networks. On the one hand, content delivery networks and caching protocols could go down close to backhauling gateways and base stations. On the other hand, Cloud servers could approach the user at mini data-centers connected to backhauling elements. The aim is to offload the transport network when it is congested and to improve the user’s quality of experience reducing the access latency.
In order to better characterize these phenomena, in this paper we analyze user content consumption habits from the Orange cellular network in different city topographies: Paris, a large metropolitan area; Lyon a large business city with a lower population density than Paris, and Nice, the fifth most populated city in France, located on the Mediterranean coast, with a coastline topology rather than a circular one as in Paris and Lyon and a population density close to the Paris one. Moreover, we propose a real-time methodology to estimate crowded spots, based on compact and easy-to-compute user mobility metrics. Our estimator is based on linear regression of parameters computed over users’ centroids and radius of gyration. We detail the performance of our estimator as a function of cell load and different regressions. We show that as a cell load estimator it has an error on median inferior to 8% for the three regions, the error is decreasing with the cell load and for crowded spot identification the load estimation and identification errors are very small. We also show that the estimator is robust and gives promising results for different time windows and as a function of the volume of data and the sample regression
window. Moreover, our estimator is time and city-independent as it shows stable behavior for different times of the day and for different cities with different topographies. Furthermore, we compare our proposed estimator to another one from the literature and we show that the former out-performs the latter in terms of crowded spot estimation accuracy.
The paper is organized as follows. Section 2 synthetically presents the dataset. Section 3 presents content consumption maps and analyzes them from a spatial distribution perspective. Section 4 presents the crowded spot estima-tion issue and the estimator that we propose. Secestima-tion 5 presents the estimaestima-tion results for Paris, Lyon and Nice Metropolitan areas for Orange network data as well as the results of comparison between our estimator and another one from the literature. Section 6 summarizes our work.
2 Dataset Description
The dataset used in our study consists of network probe’s data, generated each time a mobile device uses wireless mobile network for Internet data exchange (not for voice calls and texts, i.e., what is commonly referred to as “mobile Internet” service). The network probe data exploited in the study provide information on the protocol used for communication. Data is individual, so all user identifiers were irreversibly anonymized before the analysis to protect user’s privacy. The probe collects data with six minute interval sessions, assign-ing the session to the cell identifier of the last used antenna. Data is recorded on a per-user basis and covers about 1 million mobile phone users from Paris, Lyon and Nice regions (we study the mobility of around 650,000 users in Paris; 250,000 in Lyon and 100,000 in Nice). We decompose the considered regions into Voronoi cells based on tower positions, each cell being composed of a few antennas able to host up to roughly 1,200 users at the same time.
3 Content Consumption Temporal and Spatial Distributions
In this section, we synthetically characterize content consumptions, as a func-tion of time and place in Paris, Lyon and Nice region respectively. We consider datasets of two different days:
– A “normal day” with standard content consumption activity (Tuesday, De-cember 10th, 2013). We note that any other day with no special event
occurring can also be chosen instead.
– A “special day” where a particular content consumption is expected (New Year’s Eve on Tuesday, December 31st, 2013). We chose this day because,
according to the mobile network operators [4] [5], the New Year’s Eve is considered as the day with the highest cellular network load where a huge number of people use their mobile phones for sending their wishes to their friends and family.
(a) Normal day in Paris (b) Special day in Paris
(c) Normal day in Lyon (d) Special day in Lyon
(e) Normal day in Nice (f) Special day in Nice
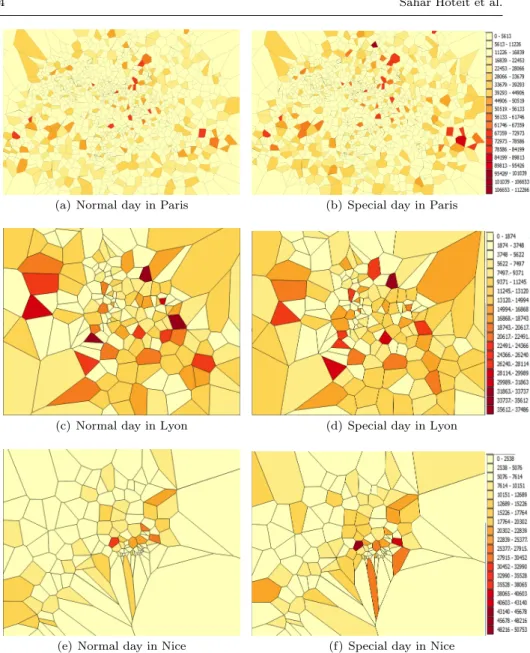
Fig. 1 Traffic volume distribution in different days and different cities.
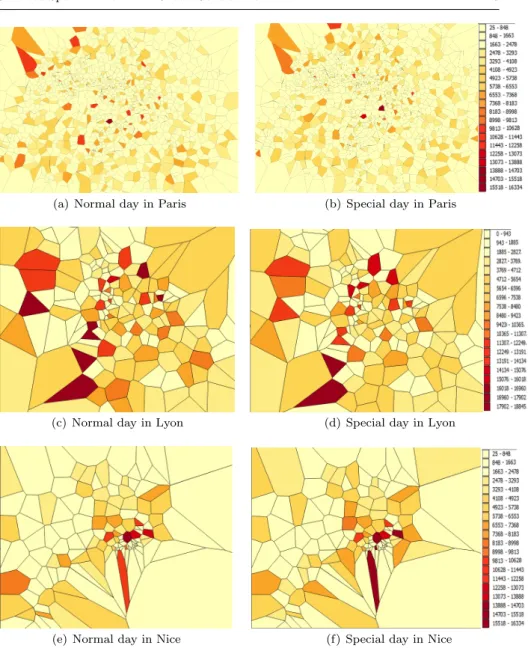
Looking for differences in users’ behavior in normal and special days is a key research question. Figure 1 shows the traffic volume (i.e., in bytes) for the different cells in each of the three regions during both normal and special days while Figure 2 shows user volume defined as the number of users attached to each cell in the considered regions during both days. The descriptions of the figures range from the less dense cells, represented by the clear yellow colour to the most dense cells, represented in the maps by the dark red colour.
(a) Normal day in Paris (b) Special day in Paris
(c) Normal day in Lyon (d) Special day in Lyon
(e) Normal day in Nice (f) Special day in Nice
Fig. 2 User volume distribution for different days and different cities.
We can notice from these two figures that:
– The number of cells is not the same in all regions (i.e., Paris has the highest number of cells since it has the highest population density).
– In the same region and on the same day, a few number of cells are clearly more crowded (i.e., those represented by the dark red colour in the maps) than others presenting a large number of users and a large traffic volume;
the reason is that they clearly cover identifiable content consumption spots. They are likely, to be the public spaces where people gather together. – The crowded spots (i.e., the dark red cells in the maps) are clearly not
the same in the two considered days. While in the normal working day, the loaded cells seem to be the places where companies and businesses are located, the touristic places are the most loaded ones in terms of traffic and user volume during the New Year’s Eve.
– The crowded spots are not necessarily those with high spatial areas, these sizes are not the same in all the cases. We notice some small crowded spots in Paris region while others are bigger in the Lyon region for example. There are therefore important differences in the geographical localization of content consumption spots. As noticed, their locations change as a function of time and the occurrence of a special event. Moreover, a detailed study in [6] shows that a large majority of the traffic volume is related to bulk transfer and web-related services whose content could be partially cached or whose Cloud server could be located close to the crowded spots to well manage the cloud and the content offloading. Users could indeed be better served if the delivery facility was located closely to the crowded spots. The backhauling network performance could also benefit from traffic offloading and traffic engineering techniques aware of user mobility and content consumption point deflections (e.g., adjusting link auto-bandwidth, path reservations and traffic offloading via D2D communications [7]).
4 Estimation of Crowded Spots
As explained in Section 2, the data used in our study is derived from network management tickets and generated in real-time as the user uses cellular net-work services. For that, it appears technically feasible to implement a crowded spot estimation technique indicating where the traffic load is going to increase closely.
4.1 Related Work
A limited amount of work exists in the literature on the estimation of crowded spots and rendez-vous points in access networks. E.g., in [8] vehicular data is exploited to determine accident-risk points. Authors in [9] propose a frame-work that discovers regions of different functions in a city using both human mobility among regions and points of interests located in a region. Many other works, such as [10], [11], [12] and [13], while assuming the availability of mobil-ity information, focus on user-profile aware QoS provisioning, load balancing and network signaling improvement techniques. Traffic load forecasting has also been investigated from an analytical and mathematical modeling perspec-tive. For example, authors in [14] show how under certain conditions periodic
Notation Explanation
i ithuser
I Set of all users
ni(t) Number of locations recorded for user i until
time t.
ricm(t) Center of mass (centroid) of the locations
recorded until time t for user i ri
j(t) jthlocation recorded for user i
ri
g(t) Radius of gyration of the locations recorded
until time t for user i m[ri
g(t), ricm, Ck, i, t] Spatial mapping counter
Ck kthcell in the network
RT W Regression Time Window
ˆ
e(Ck, t) Estimation of the number of users visiting cell Ck
until time t.
n(Ck, t) Real number of users visiting cell Ckuntil time t.
CST Crowd Selection Threshold
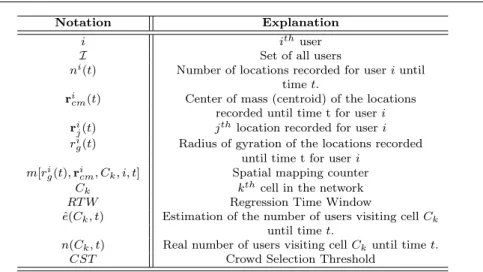
Table 1 Summary of the general notation
sinusoidal functions can be used as cellular traffic profile. These approaches seem to fail to meet the traffic load estimation requirement of our work, as it is not possible to extrapolate an estimator from the proposed models. In the same context of modeling the spatial cell density of a mobile network, authors in [15] propose a stochastic model to compute the probability of staying in a given location for a given period of time as well as the probability of moving from a given location to another one, using a random waypoint-based mo-bility pattern. Also, relevant works targeting momo-bility pattern detection from real cellular network data have been studied e.g., [16] [17] [18]. In particu-lar, authors in [17] categorize users with respect to their radius of gyration, allowing them to define a circle, centered at user’s centroid, around which a user is expected to geographically move. Using the radius of gyration as a mobility metric, authors in [19] show that cell load can be estimated using a trajectory-based estimation technique that consists of determining the best interpolation method suitable for each user category (i.e., computed using the mobility metric). They show that, for sedentary and peri-urban users, the lin-ear interpolation is the best one for joining user’s samples between consecutive connections to the mobile phone network while the cubic interpolation fits the urban users and the commuters well. In this paper, instead of relying on user’s trajectory for cell load estimation, we investigate other options not dependent on the trajectory but rather on the characterization of users’ territory. We also compare both estimation techniques (i.e., trajectory and territory-bases esti-mation techniques) together to show the advantages of the one over the other. A summary of the notation used throughout this paper is shown in Table 1.
4.2 Territory-based Crowded Spot Estimator
Given a user i ∈ I who has been located at ni(t) locations until time t, its centroid ricm(t) can be computed as the center of mass location of all previous
sampled positions. ricm(t) = 1 ni(t) ni(t) X j=1 rij(t) (1)
The radius of gyration can then be computed for each user as the deviation of the sampled positions with respect to the centroid position. It is given as follows: rgi(t) = v u u t 1 ni(t) ni(t) X j=1 ri j(t) − ricm(t) 2 (2)
It is worth mentioning that these two metrics have been introduced in [17] to characterize the users’ behavior, but they were not used to estimate the crowded spots as proposed in our paper.
Aiming at defining an adequate and implementable crowded spot estimator for cellular network management, we adopt as estimation parameters the cen-troid and the radius of gyration to account for the user’s spatial coverage. The motivation behind such adoption is that previous research studies [20] have shown a strong repetitive tendency in human mobility (i.e., people repetitively visit the same areas) Because of this reason, these two parameters, basically, do no change much over time for each user and hence can be used for esti-mating the user’s mobility patterns in the future.1These two parameters, the
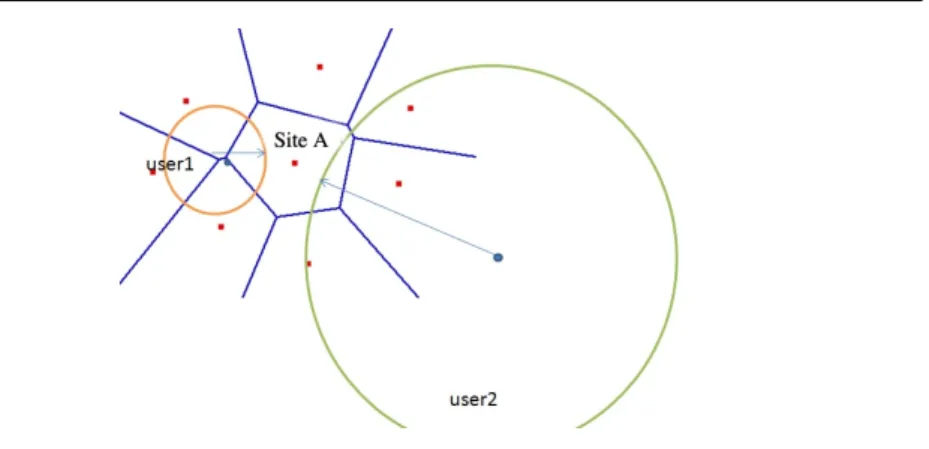
centroid and the radius of gyration, define a ‘territory’ of each user by the area covered by a circle centered at its centroid with a radius equal to the radius of gyration. Our proposed estimator takes into account the non-negligible in-tersections of different users’ territories to estimate the cellular user density. For example, in Fig. 3, based on the centroid and the radius of gyration of the two users, it is reasonable to account for the possibility that the two users pass by site A. The efficiency of the estimator should be evaluated towards its capability of estimating crowded spots rather than lightly loaded cells.
For each user i given by its territory (i.e., circle with ri
cm(t) as a center and
with ri
g(t) as a radius) and each cell Ck, we define a spatial mapping counter
m[ri g(t), ricm, Ck, i, t] given as follows: m[rgi(t), ricm, Ck, i, t] =
1, if the territory of i covers at least 10% of the area of Ck
0, in other cases
1 We note that in order to compute precisely the centroid and the radius of gyration of
the users, we need sufficient location information of each one of them. This is not an issue nowadays as most of users are smartphones holders with persistent Internet connectivity (i.e., a lot of samplings can be obtained for each one of them).
Fig. 3 Illustration of the user’s territory
It is worth mentioning that other thresholds (other than 10%) could cer-tainly be considered, depending also on the way the environment is designed architecturally. The aim of this threshold is to avoid the small overlaps since not all the cells covered by one user’s radius will be visited in a reasonable manner.
Such a spatial mapping counter is the core metric of our estimator. Simply counting the number of intersections significantly covering a given cell would certainly lead to an over counting that needs to be appropriately scaled. A simple scaling could be, e.g., to divide it by the average number of users per cell during the past measurements, yet this does not prevent us from having high deviations. We propose to scale it by the scale factor that would generate a null estimation error count in an arbitrary instant t−RT W in the recent past, with a regression time window (RT W ) adequately set. Then, as an estimator of the number of users visiting cell Ck, we propose:
ˆ e(Ck, t) = n(Ck, t − RT W )Pi∈Im[r i g(t), ricm, Ck, i, t] P i∈Im[rig(t − RT W ), ricm, Ck, i, t − RT W ] (3) It uses therefore a linear regression over past measurements to weight the spatial mapping counter adequately. Intuitively, the smaller RT W is, the more accurate the estimation, i.e., the closer ˆe(Ck, t) is to the unknown n(Ck, t) that
represents the real number of users per cell Ck. However, RT W should be big
enough to allow the network management system to retrieve the real number of users in cell Ck at time t − RT W , i.e., n(Ck, t − RT W ). Depending on
network management tickets, session duration, network latency and network size, this parameter RTW could range from a few dozens of minutes to a few hours.
5 Estimator Evaluation
We evaluate our estimator using the available network management dataset of OrangeâĂŹs French cellular network for New YearâĂŹs Eve, by computing the
Fig. 4 CDF of the radius of gyration in different cities
centroid and the radius of gyration of all users passing by the three regions: Paris, Lyon and Nice. It is worth mentioning that we have further checked the accuracy of our estimator and verified the correctness of the results in the normal day but we show in the paper those of the special days only. We set a RTW to 1 hour, which is quite a pessimistic value (in practice, in carrier grade networks, it could even be set to a few minutes, hence allowing a higher accuracy; later we show the influence of varying the RTW on the estimator’s performance). We consider the user position samples from the whole day in the computation of users’ centroids and radius of gyration.
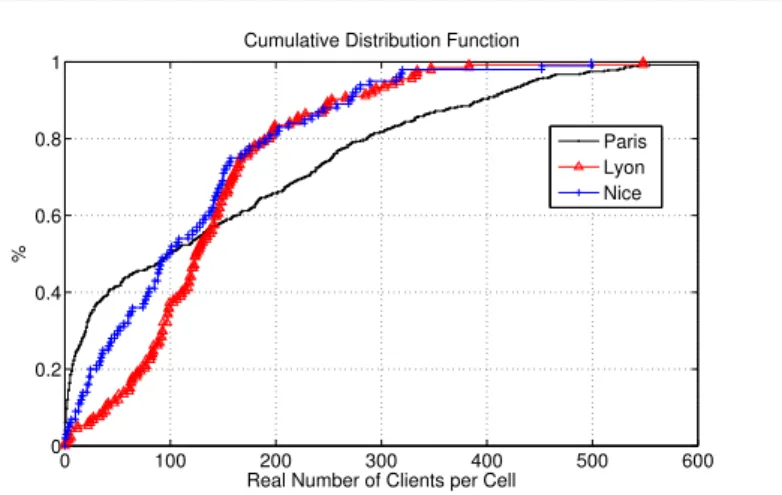
In order to qualify the dataset, Fig. 4 reports the CDFs of the users’ radius of gyration in the three cities, and Fig. 5 shows the CDF of the real number of users per cell in the considered day. We can appreciate that the radius of gyration adequately represents the user mobility habits and is city-dependent as it increases with the city’s geographical area (i.e., Parisian users show higher radius of gyration since the area of Paris city is larger than the other two regions; Paris: 105.4 km2, Nice: 71.92 km2 and Lyon: 47.95 km2). Moreover, the cells are more loaded in Paris than Lyon and Nice (i.e., approximately 20% of the cells in Paris have more than 300 users while only about 8% in Nice and Lyon). This is interpreted by the high density of users in Paris with respect to the other two regions. It is worth noting that the distance between two neighboring cells is typically a few hundred meters.
5.1 Crowded Spot Estimation Accuracy
In this section, we evaluate the accuracy of the territory-based crowded spot estimator in terms of load estimation and identification errors.
0 100 200 300 400 500 600 0 0.2 0.4 0.6 0.8 1
Real Number of Clients per Cell
%
Cumulative Distribution Function
Paris Lyon Nice
Fig. 5 CDF of the real number of customers per cell in different cities
5.1.1 Load Estimation Error
To qualify, quantitatively, the accuracy of the proposed crowded spot detection method, we analyze the load estimation error of each cell in the three selected regions. The estimation error of one cell is defined by the difference between the real and the estimated number of users of that cell. A statistical distribution plot of the obtained errors for the different cells may be useful here to better evaluate the performance of our proposed estimator. Figure 6 depicts the CDFs of the load estimation error of all cells in the three considered cities for different possible load thresholds beyond which the cell is considered as a crowded spot; from now on we refer to this threshold as Crowd Selection Threshold (CST).
The CDFs show that including all cells, and for all the considered regions, the median estimation error is lower than 8%. Including only cells having a CST of 70% (i.e., having a load higher than the load of 70% of the cells), the median estimation error is always inferior to 7%. With stricter definitions of CST (90% percentile), the median estimation error becomes inferior to 6%. It is worth stressing that the estimator’s performances seem to be city-independent because it shows similar results in different regions.
Figure 7 represents the log-log scatter representations of the estimation error as a function of the real number of users per cell for each region. We can observe that, for all regions, the estimation error is high for low-loaded cells and it decreases more than linearly as the real cell load increases, which is as argued, very desirable behavior.
5.1.2 Identification Error
To further check the accuracy of the proposed method, we evaluate type I and II errors in crowded spot identifications, i.e., false positive (a cell is identified as a crowded spot when it is not) and false negative (a cell is not identified as a crowded spot when it is a crowded spot) errors, respectively. We choose
(a) Paris (b) Lyon
(c) Nice
Fig. 6 Distribution of load estimation error (in %) for the three regions
three different CST values: 50th, 70th, and 90th percentiles. We plot for each CST value the false positive and false negative ratios evaluated by directly counting from the complete dataset against those obtained through our pro-posed method. Fig. 8 shows the results: the identification error is clearly less than 9% for all different regions and the false negative is always lower than the false positive values meaning that our estimator is more precise in identifying the real crowded cells but has a little bit of a higher error in considering the non-crowded cells as crowded ones.
A stricter definition of crowded spots, i.e., a higher CST value, does not provide a common effect on errors Type I and Type II for all cities. This behavior could be derived from the different characteristics of data in each city: the total number of users, the density of the users, the number and location of the users’ gathering spaces and the presence of clusters of neighboring cells with similar load. In the latter case, for us the most probable, according to the chosen CST value a cluster may be split resulting in an identification error. It is worth mentioning that the results of Fig. 8 do not contradict those obtained in Figure 6 as the latter shows the statistical distribution of the difference between the real and the estimated load for all the cells in the regions while
(a) Paris (b) Lyon
(c) Nice
Fig. 7 Scatter of the estimation error as a function of real cell load in the three regions
(a) False Positive - Paris (b) False Positive - Lyon (c) False Positive - Nice
(d) False Negative - Paris (e) False Negative - Lyon (f) False Negative - Nice
the former counts only the number of times our estimator makes a wrong statement on the type of a cell, whether it is crowded or not.
In our opinion, these are extremely encouraging results. Our estimator permits us to reach an excellent level of accuracy. It can be used to feed a network management policy aiming at taking a decision when detecting a crowded spot (e.g., link auto-bandwidth bounds setting in mobile backhaul-ing, adaptive content-delivery-network redirections, adaptive virtual machine migrations, etc.). For operational consideration, we however need to qualify its scalability.
5.2 Implementation Complexity
Our estimator (3) is of a rather simple and intuitive nature. Certainly, a more complex estimator, e.g., weighted by a user-cell crossing probability computed using other mobility information, might be defined to reach lower errors and can be left for future work, yet the estimator computation complexity has to be as low as possible, and the utility of having a more precise estimator is a matter of discussion since the accuracy of (3) is already extremely high.
With our estimator, for each new user position, Equations (1) and (2) could be updated handling only a limited arbitrary number N of last positions, then Equation (3) can be updated. Hence, all these operations have a O(N ∗ Im(t))
time complexity, Im(t) ⊂ I being the subset of users moving and sampled in
the sampling interval (t − RT W, t).
As already mentioned, the regression time window RTW should be chosen so that it is sufficiently higher than the computation time of the estimator. However, from a more practical perspective, in very high mobility environ-ments, the above complexity could become quadratic, which may raise scal-ability concerns. Scalscal-ability concerns could also rise from the volume of the data to mine in order to extract estimator’s metrics. The larger the sample temporal window is, the larger the data volume is and the higher the com-putation complexity is. Hence the last questions we want to answer are: does the crowded spot detection accuracy decrease with time? What happens at different times of the day? In order to answer these questions, we tested our estimator in the same period interval (between 3 pm of December 31, 2013 till 11 am of the January 1, 2014) in the three selected regions.
Figure 9 shows our evaluation results with a RTW of 1 hour and a step of 1 hour starting by 3 pm for the three considered regions. For example, when performing the crowded spot estimation at 9 pm, we exploit the data collected from 3 pm to 9 pm. These results highlight two important aspects: firstly, the accuracy of our estimator is time-independent and thus mobility-independent because it shows a constant behavior at different times of the day. Another important aspect is that the percentage of crowded spots decreases when the overall user mobility decreases, and vice versa. As a matter of fact, the maximum percentage is obtained at midnight (19% for Paris, 17% for Lyon and 15% for Nice) when people are likely to gather to celebrate New Year’s
(a) Paris (b) Lyon
(c) Nice
Fig. 9 Crowded spot estimator accuracy and percentage of crowded spots as a function of time in different regions.
Eve, then this ratio decreases when people start to split up and return back to their home locations. Hence, we can conclude that the percentage of crowded spots is mobility-dependent.
As a last analysis, we look at the influence of the regression time window on the accuracy of the estimator. For simplicity, and in order to minimize the computation time, we select 5% of the most active users in the regions and we compute the estimation error by varying the RTW as shown in Figure 10.
We clearly notice that the estimator’s accuracy increases with smaller RTW (i.e., in Paris for example, the median error is 18% when RTW=1 hour, 12% for RTW=48 min and less than 5% with a RTW=12 min; we have similar results also for the other two regions).
5.3 Comparison between Trajectory-based Estimator and Territory-based Estimator
The trajectory-based estimator evaluated in [19] has shown quite small load estimation errors that are relatively close to those obtained through the
es-(a) Paris (b) Lyon
(c) Nice
Fig. 10 CDF of the load estimation error for different RTWs.
timator we propose in this paper (i.e., territory-based estimator). However, the advantages of the proposed estimator over the other are still not straight-forward. In this section, we conduct a comparative study of the behavior of both estimators: Trajectory-based and Territory-based crowd estimators. Fig-ure 11 shows the probability density function of the load estimation error for both estimators and for different CST values (i.e., 70% and 90%). It is easy to notice that the trajectory-based estimator has the highest load estimation errors, for both values of CST, with respect to the territory-based one (i.e., for the trajectory-based estimator, some cells have an estimation level higher than 30% while for the territory-based estimator, all cells have an error level lower than 30%).
So, as a conclusion, we can affirm that the territory-based estimator seems more suitable and more accurate in determining the load of crowded spots than the trajectory-based estimator.
0 10 20 30 40 50 60 70
Load Estimation Error
0 0.02 0.04 0.06 0.08 0.1
0.12 Probability Density Function
Trajectory Based Territory Based
(a) CST =70th Perc
0 10 20 30 40 50
Load Estimation Error
0 0.02 0.04 0.06 0.08 0.1 0.12 0.14 0.16
0.18 Probability Density Function
Trajectory Based Territory Based
(b) CST= 90th Perc
Fig. 11 Probability density function of the load estimation error for both estimators and for different CSTs.
6 Conclusion
An important issue in mobile access network management is to find scalable and effective ways to offload the backhauling and core network as a function of user mobility and consumption patterns. The motivation is the arising weight mobile Internet traffic taken over legacy wireline access traffic in today’s In-ternet Service Provider networks. Different offloading techniques are currently studied which could be classified as traffic offloading (e.g., Wifi offloading [21], and femtocell offloading [22]), content offloading (e.g., ICN [23]) and Cloud (computation) offloading (e.g., CloudLet [24] [25]). In this scope, the contri-bution of this paper is twofold.
Firstly, working on real network probe data from the Orange cellular net-work of three different French metropolitan areas, we show how content con-sumption spots spatially move as a function of the occurrence of special events. Secondly, motivated by the experimental findings, we propose a crowded spot estimation technique based on two compact and easy-to-compute user mobility metrics, i.e. the user’s centroid and radius of gyration, and relying on linear regression. The technique basically consists of measuring the cell in-tersections between users’ geographical ‘territories’ defined by users’ centroids and radius of gyration, weighting it by a regression factor while accounting for the gap between estimated and real numbers in the recent past. Results on real data show that the error of our estimator exponentially decreases with the cell load, and that the crowded spot identification presents a small estima-tion error. We also stress our estimator for more challenging condiestima-tions with a smaller regression window and at different times of the day. We show that the estimation accuracy remains very high and it is time-independent (it shows a stable behavior at different times of the day) and it is also space-independent (it behaves similarly for cities with very different topographies). Furthermore, we prove that there is a correlation between the number of crowded spots and users’ mobility. Finally, compared to another crowded spot estimator from the
literature, we show that our proposed estimator grants more accurate estima-tions of the most crowded spots in a region.
Acknowledgements The authors would like to thank Dr. Cezary Ziemlicki and Dr. Zbig-niew Smoreda from Orange Labs for providing the data used for the experiments and Prof. Guy Pujolle from LIP6 for his useful comments. This work was partially supported by the ANR ABCD project (Grant No: ANR-13-INFR-005), and by the EU FP7 IRSES Mobile-Cloud Project (Grant No. 612212).
References
1. S. Hoteit, S. Secci, G. Pujolle, V. Hoa La, C. Ziemlicki and Z. Smoreda, “Mobility-Aware Estimation of Content Consumption Hotspots for Urban Cellular Networks”, in Proc. of 2014 IEEE/IFIP Network Operations and Management Symposium (NOMS 2014), 5-9 May 2014, Krakow, Poland.
2. Cisco, “Cisco Visual Networking Index: Global Mobile Data Traffic Forecast
2016-2021”, White paper, http://www.cisco.com/c/en/us/solutions/collateral/
service-provider/visual-networking-index-vni/mobile-white-paper-c11-520862. html, 2017.
3. “L’audience de l’Internet mobile en France”, Mediametrie, http://www.mediametrie.fr/ internet/communiques/telecharger.php?f=e8c0653fea13f91bf3c48159f7c24f78, 2011. 4. “Mobile networks braced for ‘busiest ever’ New Year surge”, BBC News, http://www.
bbc.com/news/technology-20876983, 2012.
5. “SMS et appels du Nouvel An, comment les opérateurs s’organisent ”, Huffingtonpost http://www.huffingtonpost.fr/sylvain-peysieux/sms-et-appels-du-nouvel-an_b_ 8899184.html, 2016.
6. S. Hoteit, S. Secci, G. Pujolle, Z. He, C. Ziemlicki, Z. Smoreda and C. Ratti, “Content Consumption Cartography of the Paris Urban Region using Cellular Probe Data”, in Proc. of ACM URBANE 2012, CoNext Workshop, Nice, France, 2012.
7. X Bao, Y Lin, U. Lee, I. Rimac, R.R. Choudhury, “DataSpotting: Exploiting naturally clustered mobile devices to offload cellular traffic”, in Proc. of IEEE INFOCOM, Turin, 2013.
8. TK. Anderson, “Kernel density estimation and K-means clustering to profile road accident hotspots”, Accident Analysis and Prevention, Vol. 41, No. 3, 2009
9. J. Yuan, Y. Zheng, and X. Xie, “Discovering regions of different functions in a city
using human mobility and POIs.”, In Proc. of the 18th ACM SIGKDD Conference on Knowledge Discovery and Data Mining, New York 2012.
10. H. Zang and J. Bolot, “Mining call and mobility data to improve paging efficiency in cellular networks”, in Proc. of ACM Int. Conf. on Mobile Computing and Networking (ACM MOBICOM), New York, USA, 2007
11. K. Seada, “Rendezvous regions: a scalable architecture for service location and data-centric storage in large-scale wireless networks”, in Proc. of 2004 Parallel and Distributed Processing Symposium.
12. S.K. Das, S.K.S. Jayaram, “A novel load balancing scheme for the tele-traffic hot spot problem in cellular networks”, Wireless Networks, Vol. 4, No. 4, 2004.
13. D. Ghosal, B. Mukherjee, “Exploiting user profiles to support differentiated services in next-generation wireless networks ”, IEEE Networks, Vol. 18, No. 5, 2004.
14. E. Oh and B. Krishnamachari, “Energy Savings through Dynamic Base Station Switch-ing in Cellular Wireless Access Networks”, In Proc. of IEEE Globecom 2010.
15. B. Nunes and K. Obraczka, “Modeling Spatial Node Density in Waypoint Mobility”, in Proc. of International Conference on Mobile Ad-hoc and Sensor Systems, MASS, Las Vegas, NV, USA, 2012.
16. F. Calabrese et al., “The Geography of Taste: Analyzing Cell-Phone Mobility and Social Events”, In Proc. of IEEE PerComp 2010.
17. M. Gonzalez, CA . Hidalgo, Al. Barabasi, “Understanding individual human mobility patterns”, Nature 458, pp. 238-238, 2008.
18. H. Hohwald, E. Frias-Martinez, and N. Oliver, “User modeling for telecommunication applications: Experiences and practical implications”, in Proc. UMAP, pp. 327-338, 2010. 19. S. Hoteit, S. Secci, S. Sobolevsky, C. Ratti and G. Pujolle, “Estimating Human Trajec-tories and Hotspots through Mobile Phone Data”, Elsevier Computer Networks, Vol. 4, pp. 296-307, 2014.
20. E. Mucceli A.C. Viana, C. Sarraute, J. Brea, I. Alvarez-Hamelin “On the regularity of human mobility”, Pervasive and Mobile computing (PMC) Journal, Elsevier, Vol. 33, pp. 73-90, December 2016.
21. K. Lee , J. Lee, Y. Yi, I. Rhee, S. Chong “Mobile Data Offloading: How Much Can Wi-Fi Deliver?”, IEEE/ACM Transactions on Networking, Vol. 21, No. 2, April 2013. 22. D. Calin, H. Claussen and H. Uzunalioglu, “On femto deployment architectures and
macrocell offloading benefits in joint macro-femto deployments”, IEEE Communications Magazine, Vol. 48, no. 1, pp. 26-32, 2010.
23. A. Detti, M. Pomposini, N. Blefari-Melazzi, S. Salsano and A. Bragagnini, “Offloading cellular networks with Information-Centric Networking: The case of video streaming”, In Proc. of the Int. Symp. on a World of Wireless, Mobile and Multimedia Networks (WoWMoM), IEEE, San Francisco, CA, USA, 1-3, 2012.
24. M. Satyanarayanan, P. Bahl, R. Caceres, and N. Davies. “The Case for VM-based
Cloudlets in Mobile Computing”, IEEE Pervasive Computing, 8(4), 2009.
25. Lei Jiao, Roy Friedman, Xiaoming Fu, Stefano Secci, Zbigniew Smoreda,
Hannes Tschofenig, “Challenges and Opportunities for Cloud-based Computation
Of-floading for Mobile Devices”, in Proc. of Future Network and Mobile Summit 2013, 3-5 July, 2013, Lisbon, Portugal.