READ THESE TERMS AND CONDITIONS CAREFULLY BEFORE USING THIS WEBSITE.
https://nrc-publications.canada.ca/eng/copyright
Vous avez des questions? Nous pouvons vous aider. Pour communiquer directement avec un auteur, consultez la
première page de la revue dans laquelle son article a été publié afin de trouver ses coordonnées. Si vous n’arrivez pas à les repérer, communiquez avec nous à [email protected].
Questions? Contact the NRC Publications Archive team at
[email protected]. If you wish to email the authors directly, please see the first page of the publication for their contact information.
NRC Publications Archive
Archives des publications du CNRC
This publication could be one of several versions: author’s original, accepted manuscript or the publisher’s version. / La version de cette publication peut être l’une des suivantes : la version prépublication de l’auteur, la version acceptée du manuscrit ou la version de l’éditeur.
Access and use of this website and the material on it are subject to the Terms and Conditions set forth at
Bringing A Construction Site Into The Lab: A Context-Relevant
Lab-Based Evaluation Of A Multimodal Mobile Application
Lumsden, Joanna; Kondratova, Irina; Langton, Nathan
https://publications-cnrc.canada.ca/fra/droits
L’accès à ce site Web et l’utilisation de son contenu sont assujettis aux conditions présentées dans le site LISEZ CES CONDITIONS ATTENTIVEMENT AVANT D’UTILISER CE SITE WEB.
NRC Publications Record / Notice d'Archives des publications de CNRC:
https://nrc-publications.canada.ca/eng/view/object/?id=9ffabeca-01fe-4379-9b50-d956429877d0 https://publications-cnrc.canada.ca/fra/voir/objet/?id=9ffabeca-01fe-4379-9b50-d956429877d0
National Research Council Canada Institute for Information Technology Conseil national de recherches Canada Institut de technologie de l'information
Bringing a Construction Site Into the Lab: A
Context-Relevant Lab-Based Evaluation of a
Multimodal Mobile Application *
Lumsden, J., Kondratova, I., and Langton, N.
June 2006
* published in the Proceedings of the 1st
International Workshop on Multimodal and Pervasive Services (MAPS’2006). Lyon, France. June 29, 2006. NRC 48554.
Copyright 2006 by
National Research Council of Canada
Permission is granted to quote short excerpts and to reproduce figures and tables from this report, provided that the source of such material is fully acknowledged.
Abstract—Mobile technology has not yet achieved widespread acceptance in the Architectural, Engineering, and Construction (AEC) industry. This paper presents work that is part of an ongoing research project focusing on the development of multimodal mobile applications for use in the AEC industry. This paper focuses specifically on a context-relevant lab-based evaluation of two input modalities – stylus and soft-keyboard v. speech-based input – for use with a mobile data collection application for concrete test technicians. The manner in which the evaluation was conducted as well as the results obtained are discussed in detail.
Index Terms—Human Factors, Evaluation, Mobile Technology, Multimodal Interfaces.
I. INTRODUCTION
obile technology has not yet achieved widespread acceptance in the Architectural, Engineering, and Construction (AEC) industry [1]. The realization of widespread adoption of mobile technologies within the AEC industry will require further investigation into the industry-specific usability of the technologies, as well as their applicability within realistic AEC usage scenarios. Existing research in this field has, for example, attempted to address the issue of varying usage scenarios by ‘mapping’ actors, roles, and processes on the construction site into the functional requirements for mobile technology [2]. Similarly, focusing on the usability aspects of mobile technology for data collection and communication, Bürgy and Garrett [3] have investigated ‘situation-aware’ mobile computing for mobile construction applications. These are just two examples of an emerging research focus on the use of mobile technologies in the construction industry; the field requires substantial further research effort to ensure the successful adoption of mobile
Manuscript received April 21, 2006.
Joanna Lumsden is with the National Research Council of Canada, IIT e-Business, 46 Dineen Drive, Fredericton, New Brunswick, Canada, E3B 9W4 (phone: 506-444-0382; fax: 506-444-6114; e-mail: [email protected]).
Irina Kondratova is with the National Research Council of Canada, IIT e-Business, 46 Dineen Drive, Fredericton, New Brunswick, Canada, E3B 9W4 (phone: 506-444-0489; fax: 506-444-6114; e-mail: [email protected]).
technologies in an industry which would potentially realize enormous benefit from the efficiency enhancement and associated cost savings possible via such technologies.
The combination of small screen size and predominant use of stylus-based interaction on mobile devices presents an inconvenience for mobile AEC workers, especially when their hands are otherwise engaged using field equipment or instruments. Furthermore, it does not permit due cognizance of the physical, and often danger laden, environment in which they are situated. Consequently, speech processing is becoming one of the key technologies for expanding the use of handheld devices by mobile workers [4]. Furthermore, designers are starting to combine the ‘eyes-free’ and potentially ‘hands-free’ benefits of speech input with the de facto stylus and soft-keyboard input techniques to develop multimodal interfaces [5]. This type of interface not only allows for potentially faster and more efficient communication with mobile devices, but it also supports the use of different input modalities based on user preference and/or on the usage context, making it potentially well suited to the diversity of the AEC industry and its members. Multimodal interfaces of this nature are also sympathetic to the need for AEC users to be able to choose the most appropriate interaction modalities at any given point in time, based on changing environmental conditions (e.g., lighting, noise, and physical distractions) and/or task context.
The research presented in this paper is part of an ongoing investigation into how we might provide mobile data collection facilities to the AEC industry in a way that is applicable to, and usable by, industry members. Specifically, to investigate the effectiveness of multimodal technology for mobile data collection in the AEC industry, we have developed a prototype mobile application to allow concrete testing technicians to record quality control data on-site. This paper briefly outlines this application and then discusses, in detail, the design, process, and results of a context-relevant lab-based evaluation we conducted to determine and compare the effectiveness of the different input modalities used.
Nathan Langton was with the National Research Council of Canada at time this paper was written.
Bringing A Construction Site Into The Lab: A
Context-Relevant Lab-Based Evaluation Of A
Multimodal Mobile Application
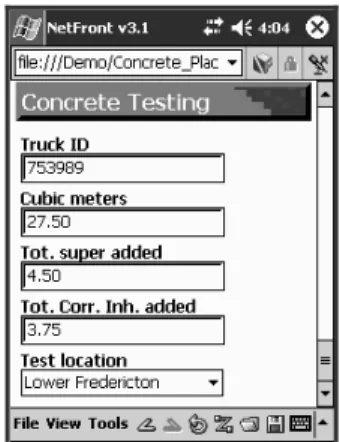
Joanna Lumsden, Irina Kondratova, and Nathan LangtonFig. 1. Screen dump from the MFDE application.
II. MULTIMODAL DATA COLLECTION
As mentioned above, our current research in the area of mobile data collection for the AEC industry focuses on multimodal field data collection for concrete test results. As part of this research, we have developed a prototype multimodal field data entry (MFDE) application to run on a Pocket PC utilizing the multimodal NetFront 3.1 web browser and a fat wireless client with an embedded IBM ViaVoice speech recognition engine. An embedded relational database (IBM DB2 everyplace) is used for local data storage on the mobile device. Fig. 1 illustrates part of the application interface; detailed information on the multimodal technology that was used to develop this application prototype can be found elsewhere [6].
The MFDE prototype adopts multimodal interaction techniques to facilitate efficient data input. Specifically, it permits the use of voice input in addition to the use of the standard stylus and soft-keyboard. Sections 3 and 4 describe the experimental design and procedure we adopted in order to perform a comprehensive, context-relevant, mobile usability evaluation of the MFDE prototype. Section 5 discusses the results we obtained.
III. BRINGINGTHECONSTRUCTIONSITEINTOTHELAB
Mobile, lab-based studies have proven to be a viable means by which to assess the usability of mobile technologies under controlled experimental conditions [7]. To meaningfully assess the suitability of the technologies for a given usage scenario it is, however, essential that the lab set-up adequately reflect the intended context of use of the technology. This section briefly discusses the design of a lab-based mobile evaluation of the MFDE prototype, wherein an abstract representation of the actual context of use is utilized to maximize the relevance of the results returned (for more detail, please refer to [8]).
The purpose of our evaluation was to (a) determine and compare the effectiveness and usability of the two different input options and (b) to determine which of the two options is preferred by users in relation to the application’s intended con-text of use. To appropriately reflect the anticipated
context of use within our study design, we had to consider the key elements of a construction site that would potentially influence a test technician’s ability to use one or both of the input techniques. We determined these to be: (a) the typical extent of mobility of a technician while using the application; (b) the auditory environmental distractions surrounding a technician; and (c) the visual or physical environmental distractions surrounding a technician – that is, the need for a technician to be cognizant of his or her physical safety when on-site.
To reflect the extent of a technician’s work practice mobility, we simply required our experimental participants to walk to various points in our lab space and, at each point, enter provided data into the MFDE application.
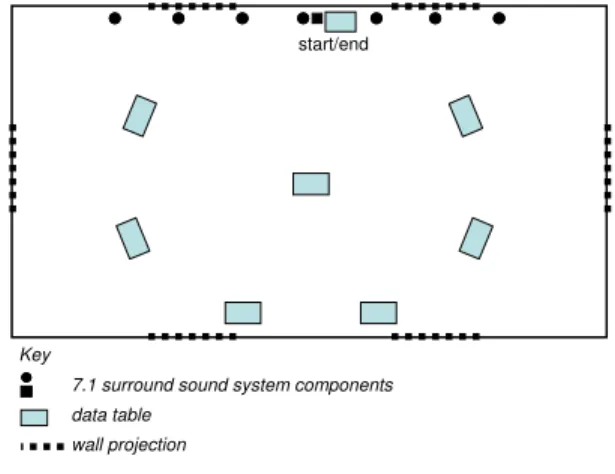
Environmental noise on a typical construction site ranges from 70dB to 100 dB [9]. To integrate noise distractions from realistic construction noise into our experiment, we used a 7.1 surround sound system in our lab to play construction noises within the aforementioned range while the experimental participants were performing data entry tasks. Participants were required to wear industrial hearing protectors during the study which not only mitigated the risks to our participants, but was also representative of the situation on a construction site where a test technician would be required to wear hearing protection.
When designing our experiment, we had to reflect the requirement that a technician needs to be aware of his surroundings while using the application. To do this, we used a series of 6 ceiling mounted projectors in the lab to project photographic images around the 4 walls of the lab space. These images included a series of ‘safe’ construction site photographs (that is, with no heavy equipment) and one ‘danger’ photograph (which included heavy equipment); the images were displayed in a pre-set sequence with randomized location and duration such that all projectors were simultaneously projecting photographs but only one was projecting the ‘danger’ photograph at any point in time. While using the application to enter data, participants were required to be conscious of the images being projected around them and to maintain a mental tally of the number of ‘danger’ photographs of which they were aware.
Thus, using a combination of simultaneous passive, active, and interfering distractions [10] affecting both the auditory and visual senses, together with a mobile task set-up, it was possible to abstract key relevant elements of a construction site and meaningfully represent them within our lab environment; that is, we ‘brought’ the construction site into the lab to achieve a context-relevant evaluation of our MFDE application.
IV. EXPERIMENTALDESIGN&PROCESS
Running on an HP 4700 series iPAQ, we used an abridged version of the full MFDE application for our experiments; that is, we focused on a subset of 7 of the actual fields in the
MFDE forms, including one or more of each of the different field types. This allowed us to compare the two input techniques for each data entry type.
Fig. 2. Physical lab set-up.
Participants were asked to walk between tables in our lab space (see Fig. 2) to enter data into each of the fields in the abridged MFDE form. Each table in the lab was labeled ac-cording to one of the 7 fields in the form. The order in which participants visited the seven tables reflected the sequential order of the fields on the form. Each table displayed instructions to participants regarding the precise data they were to enter into the corresponding field in their form. Participants were instructed not to correct any erroneous or omitted fields in order to simplify our measure of accuracy (we felt this was necessary given the disparity of the two input techniques being assessed).
During the experiment, a range of measures was taken to assess the usability and effectiveness of the two input techniques. Per participant, we measured time to complete the MFDE form, error rates (per data type and across all fields), and subjective workload (using the NASA TLX scales [11]). Using a similar scale to the NASA TLX rating scales, we also recorded participants’ preference for input modality, both in general and per data entry type, after they had used both input techniques. Finally, as previously mentioned, as participants were completing the sequence of data entry tasks, they were exposed to construction level noise as well as projections of ‘safe’ and ‘danger’ images; they were required to be cognizant of the number of ‘danger’ images they believed they saw and to report that tally to the evaluator once they had completed their form.
A fully counterbalanced, between-groups design was used for this experiment. Each participant was required to complete an MFDE form twice, once with each input technique. By counterbalancing the order in which the participants used the two input techniques, we mitigated against learning effects. Although the MFDE forms used in each of the two sessions contained the same data fields, the order in which the fields were presented – and hence the path participants were required to walk between tables in the lab – and the precise data elements to be entered were different between the two sessions to further mitigate against learning
effects. The order in which the two MFDE forms were used remained fixed across all participants with the two sets of data elements being balanced as far as possible in terms of complexity; this was done to eliminate any potential bias that may have arisen due to some data elements being perceived as ‘easier’ than others. Before each session (speech-based or stylus-based), participants were trained in the use of the input technique they were about to use. They were then given, using a sample 4 field form, an opportunity to practice with the input technique under conditions similar to the actual test conditions (as previously described).
We wanted to determine noise thresholds at which the speech-based input did and did not work. We therefore divided the participants into 3 groups – A, B, and C – for each of the following noise ranges respectively: 70 dB – 80 dB; 80 dB – 90 dB; and 90 dB – 100 dB. Members of each group participated in the experiment in exactly the same way, the only difference being the noise levels under which they worked.
Eighteen people participated in our experiment: 10 males and 8 females with ages ranging from 18 to 45. One third of our participants were civil engineers, the rest had a diverse range of backgrounds. Eleven participants had previously used a handheld device but, of those, most had only used such technology on a handful of occasions. Only two participants had ever used a speech-based interface before; in both instances, use was limited to a very small number of occasions.
As a consequence of the awkwardness of the small screen size of the handheld device combined with participants’ mobility, we hypothesized that participants would be slower to complete their data entry tasks using the stylus and soft-keyboard than using speech. Conversely, we also hypothesized that, due to the interfering noise distractions, the entry precision rate returned would be higher for the stylus and soft-keyboard than for the speech-based input. Additionally, we anticipated that the ‘eyes-free’ nature of the speech-based input would permit participants to be more cognizant of their surroundings; as such we hypothesized that the speech-based input would return better participant distraction awareness rates. As a consequence of the intricacies of using the stylus and soft-keyboard combined with the requirement to be aware of their surroundings, we hypothesized that participants would return higher overall workload levels for the stylus-based input. We made no hypothesis as to participant preference since we felt it was probably a very fine balance between the intricacy/accuracy pairing of the stylus and soft-keyboard and the pairing of ease of use and potential for misrecognition under the noise distractions of the speech-based input. For the same reasons, we made no hypotheses as to the appropriateness of the two input techniques for each of the data entry types.
wall projection Key
7.1 surround sound system components
start/end
V. RESULTS&DISCUSSION
A two factor ANOVA showed that both noise level (F2,30=10.42, p<0.001) and input type (F1,30=44.74, p<0.001)
had a significant effect on average task time. Participants in Group A (70 dB – 80 dB) took an average of 134.9 seconds to complete their data entry tasks. Tukey HSD tests showed that this was significantly longer (p=0.0003) than the participants in both Group B (80 dB – 90 dB) who had an average task time of 105.8 seconds and Group C (90 dB – 100 dB) (p=0.0156) who took 115.7 seconds on average to complete their forms. The difference between the average task times for Groups B and C was not statistically significant. This result is somewhat surprising given we had anticipated that the higher the noise level the harder it would be to interact with the device using speech. To determine why the quietest condition was the only condition to exert a significant detrimental effect on task time will require further investigation, but at the level of conjecture we anticipate that perhaps participants did not feel as hassled to complete the task when the noise around them was less, and so took their time.
A significant difference in average task time across all groups for speech-based input (101.1 seconds) compared to stylus-based input (136.5 seconds) would seem to support our hypothesis that the intricacies of entering data using the stylus and soft-keyboard elongated the time necessary to complete the data entry tasks. This collective finding is mirrored on a per group basis but is only significant for Group A (p=0.0028) and Group C (p=0.0018).
Across the data as a whole, a two factor ANOVA did not return any significant effect of noise level or input type on participants’ awareness of ‘danger’ images. We noticed that, irrespective of the sequence in which they used the two input techniques, during the experiment participants were more inclined to be observant during their second session as they ‘settled’ into the experimental process. We therefore isolated the awareness results for participants’ second sessions only. Analysis of these results showed that input type did have a significant effect on participants’ cognizance of their surroundings (F1,12=6.27, p=0.028). On average, participants
using the stylus and soft-keyboard reported seeing 90% of ‘danger’ images compared to 120% reported by participants using speech. Obviously, in the latter case, participants reported seeing more ‘danger’ images than were actually projected. On the basis of comments from participants, and our observation of them performing their tasks, we discovered that the speech interface allowed participants to look up from the device more often than was possible when using the stylus. On some of these occasions, participants looked up twice during the same projection of a ‘danger’ image and thus registered seeing it twice in the same location but were unable (according to their comments) to determine if the image had moved away and returned to the location in question or had remained in situ since their last glance. To be ‘on the safe side’ when this happened, participants generally counted the image twice. Despite this ‘glitch’, the findings would at least
suggest that the speech-based interaction permitted greater awareness of physical environment than the stylus-based interaction.
Fig. 3. Average data entry precision rates according to input style and experimental group.
Consider, now, the entry precision rates achieved by participants using the two different input techniques. We used a simple measure of entry precision – that is, the ratio of data fields that were completed correctly relative to the total number of fields. A two factor ANOVA showed that both noise
level (F2,30=6.06, p=0.006) and input type (F1,30=87.27,
p<0.001) had a significant effect on entry precision. Furthermore, the combination of noise level and input type was also found to significantly affect the precision rates (F2,30=8.53, p=0.001).
Across all groups, participants achieved an average precision rate of 93.7% using the stylus and only 57.1% using speech to complete their forms. Tukey HSD tests revealed that the within-group differences for Groups B and C shown in Fig. 3 are significant (p<0.0001 in both cases). There was no such difference within Group A. Tukey HSD tests also revealed that, in terms of the group averages shown in Fig. 3, Group A’s performance was significantly better than both Group B’s (p=0.045) and Group C’s (p=0.006). Furthermore, the speech-based data input precision achieved by Group A was significantly better than that of Group B (p=0.0082) and Group C (p=0.0002). There was no similar significant difference between Groups B and C in terms of speech-based input. Additionally, there was no significant difference between the stylus-based data entry precision rates achieved by each group. That said, the stylus-based precision rates achieved by Group C were significantly better than the speech-based results for Group B (p<0.001).
These results suggest that the presence of noise interference does indeed reduce the accuracy rates achievable for data input using speech. Stylus-based input was generally found to be more accurate and with increasing noise levels, stylus-based input significantly exceeded speech-stylus-based input. The significant difference between speech-based data precision across the three noise levels clearly shows that the greater the noise, the less accurate speech-based data input becomes. Furthermore, it implies that there is a potential threshold for
0.0% 10.0% 20.0% 30.0% 40.0% 50.0% 60.0% 70.0% 80.0% 90.0% 100.0% A B C Group A ver ag e D a ta E n tr y P reci si o n R a te s (% ) Speech Stylus Combined Group Average
acceptable accuracy (approximately 75%) under realistic usage conditions of around 80 dB. Stylus-based data input showed no such degradation with rising noise levels which suggests that, albeit significantly slower as a data input method, it is more consistent in terms of achievable data precision rates under our conditions of use.
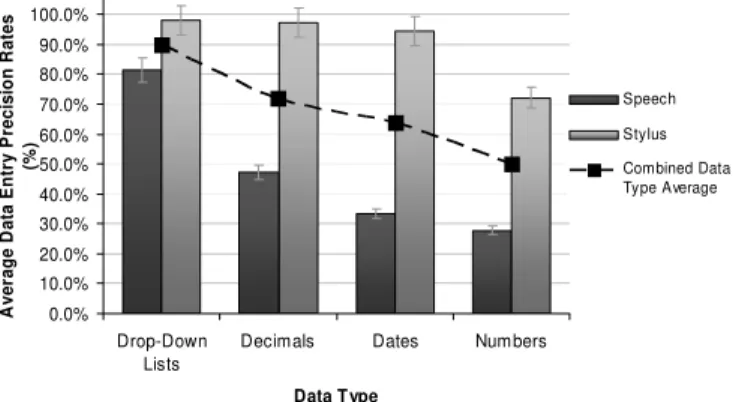
Fig. 4. Average data entry precision rates according to input style and data type.
Having looked at the overall precision rates achieved for the MFDE form as a whole, consider now the suitability of each input technique according to the different data entry fields/types tested (see Fig. 4). A two factor ANOVA revealed that input technique significantly affected participants’ precision rates for date fields (F1,30=22.41, p<0.001), for
drop-down lists (F1,30=12.25, p=0.001), for decimal numbers
(F1,30=24.55, p<0.001), and for non-decimal numbers
(F1,30=8.42, p=0.007). In each case, significantly higher data
entry precision rates were achieved using the stylus (see Fig. 4). On the surface, the results for drop-down lists are surprising given that to use a stylus to select an item from the drop-down lists on the form required precision button presses and scrolling whereas, using speech, a participant had merely to say the item that was to be selected. It is likely that the extent of detrimental effect exerted by the contextual noise made drop-down lists harder to use with speech than originally anticipated but, that said, drop-down lists still returned the highest data entry precision rates on average across both data input types. There were no significant differences identified for drop-down list use according to noise level. Entry of non-decimal numbers was only affected by input modality. With respect to the findings for decimal numbers, Tukey HSD tests revealed that the difference in precision rates achieved using speech by Group A (83.3%) and Group C (25.0%) was significant (p=0.025). Within both Groups B and C, data precision rates were significantly higher for stylus-based than speech-based decimal number entry (p=0.007 and p=0.002 respectively). This highlights the impact of increasing noise levels on participants’ ability to achieve accurate input using speech. These findings further demonstrate the superior accuracy of the stylus and soft-keyboard.
Besides supporting our hypothesis, the results shown in Fig.
4 provide some insight into the general suitability of different data types/fields for use with a mobile data collection application like the MFDE prototype. Data type, in general, had a significant impact on achievable precision rates (F3,136=8.32, p<0.0001) with drop-down lists being
significantly more supportive of accuracy than both manual date entry (p=0.0089) and manual non-decimal number entry (p<0.0001); similarly decimals returned significantly more accurate entries than non-decimal numbers (p=0.0414). These observations suggest that, not considering input method, drop-down lists are (unsurprisingly) most supportive of accurate data entry for mobile data entry systems such as the MFDE application. We are unclear as to why non-decimal number entry appeared to cause the most problems; this will require further investigation.
The results shown in Fig. 4 also demonstrate the combined significant effect of input modality and data type (F3,136=2.73,
p=0.046). What this tells us is that for applications where speech input is necessary, drop-down lists are likely to perform significantly better than manual date and non-decimal number entry (p=0.0012 and p=0.0002 respectively). For interfaces favoring stylus-based interaction, there is no significant difference between the accuracy attainable with each of the data entry types. The results suggest that when relying on stylus and soft-keyboard use for input of data, a designer can be reasonably comfortable that the various data entry types each return similar data entry accuracy affordances.
As noted in Section 4, we had hypothesized that participants would return higher overall workload levels for the stylus-based input than the speech-based interaction as a consequence of the intricacies of using the stylus and soft-keyboard combined with the requirement to be aware of their surroundings. A two factor ANOVA did not, however, support this hypothesis; we found no significant difference between the overall workload reported according to group nor according to input modality. When we looked at the individual factors contributing to workload, only participants’ perception of their own performance was significantly affected by input modality (F1,30=5.62, p<0.024).
Unsurprisingly, given the data accuracy rates reported previously, participants reported an average performance rating of 15.7 (out of a possible 20) when using the stylus and soft-keyboard compared to a rating of 12.3 when using speech. This suggests that participants were conscious of the difference between speech and stylus input with respect to the precision difficulties they were encountering under the context-relevant noise levels. The fact that participants did not consequently report worse levels of effort and frustration for speech is likely a result of the fact that they were not permitted to correct erroneous or omitted entries; had we insisted that they persevere with data entry until their entire form was correct, we anticipate that participants would have become extremely frustrated with the speech (given the impact of the noise levels) and may ultimately have given up (hence, in part, our decision to ask them to ignore errors/omissions).
0.0% 10.0% 20.0% 30.0% 40.0% 50.0% 60.0% 70.0% 80.0% 90.0% 100.0% Drop-Down Lists
Decimals Dates Numbers
Data Type A ver ag e D a ta E n tr y P reci si o n R a tes (% ) Speech Stylus Combined Data Type Average
We feel that testing frustration and/or annoyance of the speech is an issue for a future experiment.
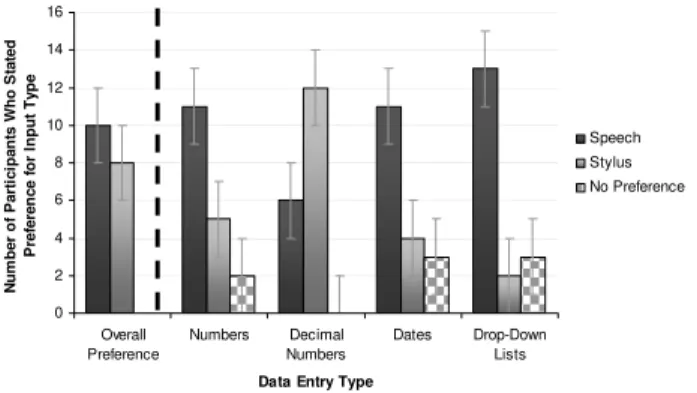
Fig. 5. Subjective preference for input modality according to data entry type.
Finally, Fig. 5 shows participants’ average stated preferences for input modalities, both in general and according to data type/field. Although none of the results shown are statistically significant, they are very interesting. There was little to separate participants’ overall preference; the average preference ratings were identical for both types of input (14.0 out of 20). For each data entry type, participants were asked to state whether they preferred using speech, the stylus and soft-keyboard, or had no preference. As can be seen in Fig. 5, with the exception of decimal numbers (for which participants typically preferred to use the stylus and soft-keyboard) the majority of participants stated preference for the use of speech. The preferences stated by participants are at complete odds with the data precision results and performance ratings. They do, however, reflect the nature of comments noted by participants, such as those included as examples below:
“I like the speech-based entry because you are able to focus more on your surroundings.”
“I felt more distracted while using the keyboard – I couldn’t watch what was going on around me.”
These participant comments (just two of many in a similar vein) are not only in accord with our findings that the speech-based input afforded participants greater cognizance of their surroundings, but they also stress the importance attributed to this capability by participants. Participants’ preferences therefore suggest that they are potentially willing to forgo accuracy of data input in order to have greater ability to monitor their surroundings, and in preference for an input technique they consider “easier to use”.
VI. CONCLUSIONS
This paper has shown that it is possible to ‘bring’ a complex physical environment such as a construction site into the lab by representing key relevant aspects of the intended context of
use. Using a combination of context-relevant mobility, passive distractions, active distractions, and interfering distractions (affecting both the auditory and visual senses) we were able to conduct a meaningful controlled evaluation of two input modalities for use with a mobile multimodal data collection application.
Stylus and soft-keyboard based input was shown to be significantly more accurate than speech under our conditions of use. Although the stylus-based interaction was slower, had we required that participants completed their forms entirely correctly, we anticipate that stylus-based input would likely have become the faster input option given our current interface design and context of use. We anticipate investigating this during future evaluations.
Noise level was shown to significantly affect data entry precision when using speech; our results suggest that there is a threshold of approximately 80 dB beyond which the accuracy achievable with speech-based input may prove unacceptable or indeed unusable. Although 80 dB is below the average noise levels on a construction site, our results suggest that if the interface was redesigned to rely more heavily on drop-down lists (which had a significantly higher input accuracy rate for speech as a result of a more restricted vocabulary) it may be possible to raise the threshold noise level. We plan to investigate this further as well as to determine what participants consider to be acceptable in terms of accuracy under our conditions of use.
Speech was shown to significantly increase participants’ ability to be cognizant of their physical surroundings. Given the physicality (including inherent dangers) of a typical construction site, this in itself suggests there would be merit to further investigation of speech as an input modality for applications such as the MFDE, in particular to find the optimum set-up and use of speech. Furthermore, participants were shown to clearly prefer using speech given its simplicity; they also seemed to respect its suitability to the physicality of a construction site. One possibility is to investigate the use of a bone-transfer microphone as a means to reduce the impact of external noise. We intend to investigate this further during our ongoing research in this field.
ACKNOWLEDGMENTS
We would like to thank Murray Crease and Bob Longworth for their invaluable assistance with technical set-up in the lab. We would also like to thank our participants for their enthusiastic participation in the study.
REFERENCES
[1] S. Bowden, A. Dorr, A. Thorpe, C. Anumba, and P. Gooding, "Making the case for mobile IT in construction," in ASCE International Conference on Computing in Civil Engineering, Cancun, Mexico, 2005, pp. 46-57.
[2] K. Menzel, K. Eisenblatter, and M. Keller, "Issues of context sensitivity in mobile computing: restrictions and challenges in the construction sector," in European Conference on Products and Processes Modeling 0 2 4 6 8 10 12 14 16 Overall Preference Numbers Decimal Numbers Dates Drop-Down Lists
Data Entry Type
N u m b er o f P a rt ic ip an ts W h o S tated P re fe re n c e f o r Inpu t Ty pe Speech Stylus No Preference
(ECPPM 2004) - eWork and eBusiness in Architecture, Engineering and Construction, Istanbul, Turkey, 2004, pp. 505-513.
[3] C. Bürgy and J. H. Garrett, Jr, "Situation-aware interface design: an interaction constraints model for finding the right interaction for mobile and wearable computer systems," in 18th International Symposium on Automation and Robotics in Construction (ISARC'2002), Washington, D.C., 2002, pp. 563-568.
[4] A. C. Picardi, "IDC viewpoint: five segments will lead software out of the complexity crisis," IDC Doc #VWP000148, December 2002. [5] L. Wilson, “Look Ma Bell, no hands! - VoiceXML, X+V, and the
mobile device”, http://xml.sys-con.com/read/45792.htm, 2004. [6] I. Kondratova, "Speech-enabled handheld computing for fieldwork," in
ASCE International Conference on Computing in Civil Engineering 2005, Cancun, Mexico, 2005.
[7] J. Kjeldskov, M. B. Skov, B. S. Als, and R. T. Høegh, "Is it worth the hassle? Exploring the added value of evaluating the usability of context-aware mobile systems in the field," in 6th International Symposium on
Mobile Human-Computer Interaction (MobileHCI'04), Glasgow, Scotland, 2004, pp. 61-73.
[8] I. Kondratova, J. Lumsden, and N. Langton, "Multimodal field data entry: performance and usability issues," in Joint International Conference on Computing and Decision Making in Civil and Building Engineering 2006, Montreal, Canada, to be published.
[9] A. Gilchrist, E. N. Allouche, and C. Cowan, "Prediction and mitigation of construction noise in the urban environment," Canadian Journal of Civil Engineering, vol. 30, 2003, pp. 659 - 672.
[10] M. Crease, "Measuring the effect of distractions on mobile users' performance," in Measuring Behavior 2005: The 5th International Conference on Methods and Techniques in Behavioural Research, Wageningen, The Netherlands, 2005.
[11] S. G. Hart and C. Wickens, "Workload assessment and prediction," in MANPRINT: an approach to systems integration, H. R. Booher, Ed. New York: Van Nostrand Reinhold, 1990, pp. 257 - 296.