HAL Id: hal-03236635
https://hal.archives-ouvertes.fr/hal-03236635
Submitted on 26 May 2021HAL is a multi-disciplinary open access
archive for the deposit and dissemination of sci-entific research documents, whether they are pub-lished or not. The documents may come from teaching and research institutions in France or abroad, or from public or private research centers.
L’archive ouverte pluridisciplinaire HAL, est destinée au dépôt et à la diffusion de documents scientifiques de niveau recherche, publiés ou non, émanant des établissements d’enseignement et de recherche français ou étrangers, des laboratoires publics ou privés.
How safe is safe enough? Psychological mechanisms
underlying extreme safety demands for self-driving cars
Azim Shariff, Jean-François Bonnefon, Iyad Rahwan
To cite this version:
Azim Shariff, Jean-François Bonnefon, Iyad Rahwan. How safe is safe enough? Psychological mech-anisms underlying extreme safety demands for self-driving cars. Transportation research. Part C, Emerging technologies, Elsevier, 2021, 126, �10.1016/j.trc.2021.103069�. �hal-03236635�
1215
“
How safe is safe enough?
Psychological mechanisms underlying extreme safety
demands for self-driving cars”
Azim Shariff, Jean-François Bonnefon & Iyad Rahwan
May 2021
How safe is safe enough?
Psychological mechanisms underlying extreme safety
demands for self-driving cars
Azim Shariff1,*, Jean-François Bonnefon2, Iyad Rahwan3
1Department of Psychology, University of British Columbia, Vancouver, USA.
shariff@psych.ubc.ca
2Toulouse School of Economics (TSM-R), CNRS, Université Toulouse-1 Capitole,
Toulouse, France. jean-francois.bonnefon@tse-fr.eu
3Center for Humans and Machines, Max Planck Institute for Human Development,
Abstract:
Autonomous Vehicles (AVs) promise of a multi-trillion-dollar industry that revolutionizes transportation safety and convenience depends as much on overcoming the psychological barriers to their widespread use as the
technological and legal challenges. The first AV-related traffic fatalities have pushed manufacturers and regulators towards decisions about how mature AV technology should be before the cars are rolled out in large numbers. We discuss the psychological factors underlying the question of how safe AVs
need to be to compel consumers away from relying on the abilities of human
drivers. For consumers, how safe is safe enough? Three preregistered studies (N = 4,566) reveal that the established psychological biases of algorithm aversion and the better-than-average effect leave consumers averse to adopting AVs unless the cars meet extremely potentially unrealistically high safety standards. Moreover, these biases prove
stubbornly hard to overcome, and risk substantially delaying the adoption of life-saving autonomous driving technology. We end by proposing that, from a psychological perspective, the emphasis AV advocates have put on safety may be misplaced.
Keywords:AUTONOMOUS VEHICLES, AUTOMATION, ALGORITHM AVERSION, SAFETY, ILLUSORY SUPERIORITY
Introduction
Autonomous vehicles (AVs) are one of a small handful of technologies that seem at once inevitable and transformational. AVs promise to upend the transportation status quo that people have built their lives around over the last hundred years. The 52.2 minutes that Americans suffer through on their daily commutes (U.S. Census Bureau, 2017)—the least happy moments of their day (Kahneman et al., 2004)—could be reduced and put towards more productive or enjoyable use. Opportunities would be opened for those for whom age or disability preclude driving themselves (Harper et al., 2016). Cities would be gradually redesigned as parking needs and other infrastructure evolve (Duarte & Ratti, 2018). And—looming largest among the promises—many of the 1.25 million lives that are lost annually (and countless more damaged) in traffic collisions would be spared once AVs are capable of outperforming the at-times sluggish, panicked, distracted, drunk, tired, and error-prone driving of human beings. Economically, Intel estimates the value of the AV industry at seven trillion dollars (Lanctot, 2017).
But these promises will all remain mere potential until the AV industry can
overcome the technological, legal, and psychological challenges that serve as barriers to the mass deployment of AVs. And while the prizes discussed above have motivated technology companies to pour billions into addressing the technological challenges (Harris, 2017), there has been little attention paid to the psychological challenges. This is especially surprising given that surveys have consistently revealed the public’s comfort with AVs to be lukewarm at best (American Automobile Association, 2018). Given the promise of this technology, there is considerable value to psychological research
technology. Moreover, as governments begin considering specific policies for AVs, a clear view of the risks, benefits and challenges will be an essential ingredient for balancing the timing and stringency of their regulations.
Here we review the nascent research in this field, and outline new research revealing two psychological mechanisms that threaten to further delay the adoption of this
potentially life-saving technology—algorithm aversion and the classic social
psychological phenomenon of illusory superiority (also known as the better-than-average effect). Finally, we discuss the implications for messaging that foregrounds safety as the primary benefit of AVs.
How safe is safe enough?
How safe is safe enough for the wide-scale roll-out of AVs? Should we wait until AVs hold their promise of being 90 percent safer than human drivers, or should AVs take over our roads as soon as they cross the threshold of being safer than the average person? As governments begin codifying AV policies—including the safety thresholds that manufacturers need to meet—the question has become increasingly pressing. The 2017 guidelines released by Germany’s autonomous vehicle ethics commission tie the timing of AV deployment specifically to when these cars are able to show themselves to be demonstrably safer than human drivers. But how much safer remains an open question, and may be shaped by the psychology of both regulators and the consumers who will have to elect to be driven by AVs rather than by themselves or other humans.
A recent RAND Corporation report (Kalra & Groves, 2017) explored this question by estimating the number of lives saved under policies that would allow the introduction of AVs once they are 10, 75, or 90 percent safer than the average human driver, respectively.
The report concluded that over 30 years, hundreds of thousands of additional lives would be saved by introducing AVs as soon as they are 10 percent safer than the average driver, rather than waiting for near-perfect safety. Not only would the cars begin saving lives sooner, but the early deployment would more quickly afford the mass real-world data collection that should hasten technological progression toward the 90 percent mark.
A major uncertainty is how willing consumers will be to adopt AVs that are merely 10 percent safer than the average human driver (Liu, 2019). Psychological biases like those discussed above and elsewhere (Shariff et al., 2017) are likely to deter people from adopting AVs, even when AVs are demonstrably safer than the average human driver. Here we identify two additional psychological biases that will deter people from using AVs which are only 10, 50, or even 75 or 90 percent safer than the average driver.
First, consumers are unlikely to adopt AVs that are not as safe as they themselves are. An extremely safe driver, for example, would not benefit (at least in terms of safety) from switching to an AV that is only 10 percent safer than the average driver. The
problem is that people have a well-documented tendency to experience illusory
superiority (see Zell, Strickhouser, Sedikides & Alicke (2020) for a thorough review).
This phenomenon is also known as the better-than-average effect, as it demonstrates that most people consider themselves better than average on many tasks, including driving (Svenson, 1981). Accordingly, AVs that are only a little safer than the average driver may have little appeal, if most consumers (incorrectly) think they are vastly safer than that average driver.
Second, people may hold AVs to a higher standard than humans due to algorithm
are equal or superior to a human (Dietvorst, Simmons & Massey, 2015, 2016). Algorithm aversion has thus far been demonstrated only within specific domains such as predicting student performance (Dietvorst et al., 2015) and offering medical diagnoses (Longoni, Bonezzi & Morewedge, 2019), but may similarly apply to people’s willingness to ride in AVs. People who would be happy to be driven by a taxi driver who is (for example) 50 percent safer than the average driver, might be unhappy to be driven by an AV that is likewise 50 percent safer than the average driver. Indeed, reviews of algorithm aversion have shown that the less control user’s perceive themselves as having over the
algorithmically-derived decisions of a computer, the less trust they put in it, and the more aversion they feel towards it (Burton, Stein & Jensen, 2020). As a result, the less control AVs offer their passengers--the less they allow the human to remain “in the loop”--the more aversion they are likely to inspire.
Together, the phenomena of illusory superiority and algorithm aversion may inflate the safety threshold at which any individual consumer is willing to purchase or ride in an AV—and thus limit the adoption of AVs that do not reach this inflated threshold. To quantify these problematic effects, we conducted three studies, which we report below. Studies 1 and 2 report surveys that test the safety requirements that
nationally representative American samples demand from AVs and whether this relates to their perceptions of their own safety. Study 3 reports an experiment that tests whether debiasing people’s better-than-average effect can reduce the levels of safety they demand from AVs. Before data were collected, all hypotheses, materials, and analyses were pre-registered on the Open Science Framework. All studies were conducted in
accordance with local Institutional Review Board requirements, and all participants gave informed consent.
Study 1
Open Science
Before data were collected, the hypotheses, materials, and analysis plan for Study 1 were pre-registered on Open Science Framework (OSF; https://osf.io/pvrkz). Codebook and data are available at https://osf.io/n46k5.
Participants
A sample of 2000 Americans was recruited via YouGov’s nationally representative omnibus survey (sample size was determined by what was available through the survey company). YouGov is an online market-research and data analytics firm and the sample for their omnibus survey “mimics the properties of a random sample and is representative on age, gender, age groups, education, partisanship and ideology.” 255 respondents failed to complete one or more of the key questions, and thus could not be included in the analyses, leaving 1745 in the analysis. Demographics for Studies 1-3 are shown in Table S1.
Method
Participants were asked two sequential questions in counterbalanced order. One question asked participants to indicate the minimum level of safety they would require to accept a ride with a ride-sharing company. In one condition (n=873), this ride was
provided with a self-driving car as part of a ride-sharing service, and in the other (n=872) it was provided by a human driver working for a ride-sharing company that made their drivers’ safety data available. In this study, and following the RAND report, relative
safety levels were framed in terms of the number of traffic accidents that would be
eliminated. The question read as follows (text in brackets indicates the control condition):
Imagine that the ride-sharing companies Uber and Lyft began offering
fully autonomous (i.e. self-driving) cars [Imagine that the ride-sharing
companies Uber and Lyft began calculating the safety-levels for each of their drivers based on data the drivers' cars collected about the way they drove]. What threshold of safety would the self-driving car [the Uber/Lyft driver] need to be--compared to the average human--for you would choose to ride with it?
For example,
- a self-driving car [Uber driver] that is 10% safer than the average driver is able to avoid 10% of the accidents that average drivers have - a self-driving car [Uber driver] that is 50% safer than the average driver would avoid half the accidents that average drivers have - a self-driving car [Uber driver] that is 100% safer than the average driver would avoid all the accidents that average drivers have
Participants then responded on a 100-point slider with the prompt “I would ride
with a self-driving car that [driver who], at minimum, drove X% more safely than the average human” and anchors at “0% (accident rate equal to the average human driver)”,
“50% (accident rate half of the average human driver)”, and “100% (all accidents eliminated)”.
The other question was adapted from earlier work on the better-than-average effect (11) and asked people to rate their own safety relative to other American drivers. In
order to maintain consistency with the question above, one’s own safety level was also framed in terms of total accidents reduced. The question read as follows:
We would like to know about what you think about how safely you drive an automobile. All drivers are not equally safe drivers. We want you to compare your own skill to the skills of the other people in the United States. Consider your own driving skill. If everyone drove like you, instead of how they do now, what percentage of accidents do you think would be eliminated?
Participants responded on a 100-point slider with the prompt, If everyone drove
like me, X% of the current accident rate would be eliminated” and anchors at “0%
(accident rate would remain what it is)”, “50% (accident rate would be half of what it currently is)”, and “100% (all accidents would be eliminated)”. Though this way of quantifying relative safety has its limitations—most notably that it does not allow people describe themselves as worse-than-average drivers. However, we used it for this first study as it follows the common practice (e.g. Kalra & Groves, 2017) for quantifying safety advantages.
Participants provided demographic data elsewhere in the omnibus survey.
Results
Using the “percentage of accidents eliminated” method of quantifying relative safety, the 0-point reflects the average status-quo. Someone who chose 0 would be indicating that if everyone drove like them, the number of accidents would remain the same as it was today. As Figure 1 indicates, the distribution of respondents’
of 66 (mean=62.94). In other words, the majority of respondents thought if everyone drove as they did, 66 percent of accidents would be eliminated, and this pattern held for both men and women, in every age group, and for all education levels. Thus, as expected participants held inflated views of their own driving ability.
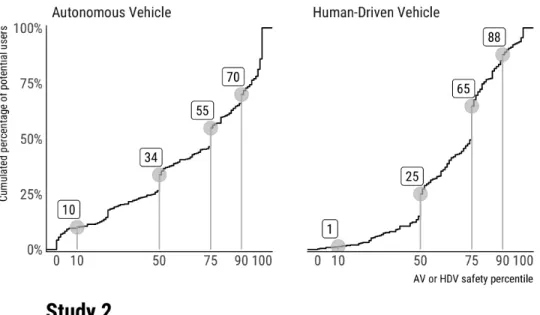
Figure 1. Perception of own driving safety in the two national US surveys. Respondents had a largely inflated view of their own safety as drivers, in all demographic groups, whether they expressed this safety as (A) the percentage of accidents that would be eliminated if others drove like them, in Study 1, or (B) as their percentile of safety within the US population, in Study 2. In both figures, distribution quartiles are shown in increasingly darker shades of grey.
What level of AV did participants find tolerable? Any AV above 0 would represent a vehicle that was better than the average human driver. Thus, if respondents were well calibrated about their own safety as drivers, then we could expect the average driver to find an AV above 0 to be an improvement. However, people are clearly not well calibrated—perceiving themselves to be well above average. And the further above average they perceived themselves, the higher the safety threshold they demanded from an AV.
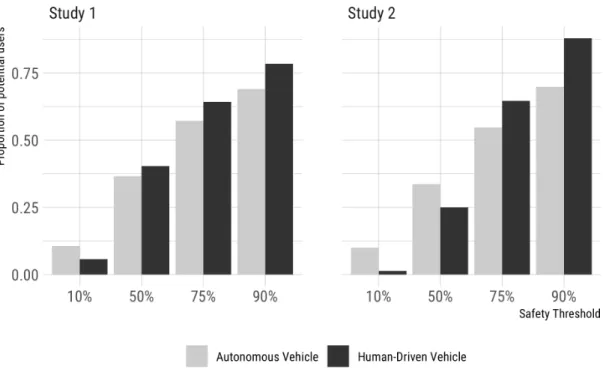
Figure 2A displays reported adoption rates at the various levels of safety used in the RAND report, and shows that AVs would overall need to be vastly more than 10
percent safer than the average driver to see widespread adoption. Supporting the
prediction that these demands would differ on the basis of self-perceptions, respondents with higher estimates of their own safety demanded higher safety thresholds from AVs (Figure 2B).
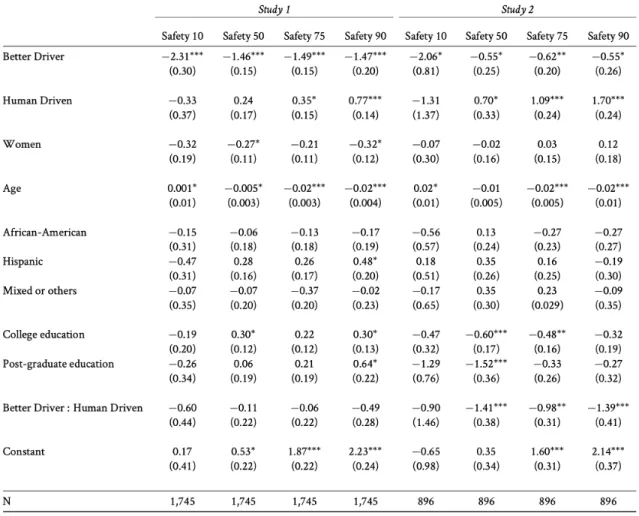
Table 1 displays complete regression results supporting this prediction. Each column reports a logistic regression predicting the willingness to buy an AV that meets a certain safety threshold, as a function of whether participants see their own safety as higher or lower than this threshold. For example, in the ‘Safety 10’ column, the outcome variable is coded as 1 for participants whose response to“I would ride with a self-driving
car that [driver who], at minimum, drove X% more safely than the average human” was
between 0 and 10 (and 0 otherwise); and the ‘better driver’ predictor variable is coded 1 for participants whose response to “If everyone drove like me, X% of the current
accident rate would be eliminated” was between 10 and 100 (and 0 otherwise).
The willingness to buy an AV at the 10, 50, 75, or 90 percent safety threshold was strongly predicted by whether the respondents perceived themselves to be below or above this safety threshold, and this perception was a stronger predictor than age and gender, the two demographic variables commonly linked to AV attitudes (Hulse et al., 2018). In other words, one of the strongest predictors of whether people report being willing to ride in an AV that was, say, 10 percent or 90 percent better than average was whether or not they themselves felt they were over 10 percent or 90 percent better than average, respectively.
Figure 2. Main results of the first national US survey. In Study 1, (A) adoption rates climb slowly as a function of the safety of autonomous or human-driven vehicles. For example, only 11 percent of
respondents report being willing to ride in an AV which is 10 percent safer than the average driver. (B) The safety level that people require is strongly determined by how safe they believe themselves to be.
Moving to our hypotheses about algorithm aversion, we had predicted that for an equivalent level of safety, people would report less willingness to ride with an AV than with a human-driven taxi. This prediction was confirmed at the Safety75 and Safety90 level, and directionally correct at the Safety50 level (See Table 1 and Figure 2).
Table 1. Results from logistic regressions for the acceptance of four safety improvements over average human drivers: 10, 50, 75, and 90 percent. "Better Driver" indicates whether self-perceived skill is higher than safety level; "Other Human" indicates whether the car is human-driven (by an Uber driver) as opposed to an AV. The reference level of ethnicity is ‘white’ and the reference level for education is ‘high school or less’. *=p<.05, **=p<.01, ***=p<.001, not corrected for multiple comparisons.
In sum, this study showed that respondents in all demographic groups vastly overestimated their own safety as drivers, and that this inflated self-perception predicted a reported demand for very high levels of AV safety, far above the levels recommended by institutions such as the RAND corporation, the German AV ethics commission (Lütge,
2017), or the European Commission (Bonnefon et al., 2020). Second, people showed some more aversion to riding with AVs than to riding with a human driver, even if these two modes of transportation were equally safe.
Study 2
However, as discussed above, while the metric of relative safety used in Study 1 allows our results to be directly compared to the way the promised safety benefits of AVs are usually described, it has the disadvantage of not letting people describe themselves as below-average drivers: at worst, respondents could describe themselves as average. Very few respondents did so (only 7 percent of respondents rated themselves as anywhere below 10 percent better than average), but it is possible that our findings were distorted by this lower bound on self-perceived safety. As a result, for Study 2, we replicated Study 1’s design, but used a different scale that circumvented this problem by framing safety in terms of percentile rank. For example, a required safety threshold of 75 meant that the AV or human driver would need to be safer than 75 percent of current drivers, and a self-perceived safety of 33 meant that the respondent perceived themselves to be safer than 33 percent of current drivers. This scale has several advantages. First, as a recent meta-analytic review reports, ranking one’s percentile can most unambiguously indicate a better-than-average belief since, regardless of a distribution’s skew, only 50% can be above the median (Zell et al., 2020). Second, compared to the one used in Study 1, percentile ranking is more straightforward and intuitive—being a familiar format widely used in sports and academic rankings, and avoiding the potentially confusing calculations involved in proportionally reducing total numbers of accidents. In fact, people likely
sidestepped these calculations to use simple heuristics in this first study—and indeed, many participants may have interpreted the awkward “percent accidents-reduced” measure as the more intuitive and commonplace percentile rank type of measure. As a result, we turned to this format for Study 2.
Open Science
Before data were collected, the hypotheses, materials, and analysis plan for Study 2 were pre-registered on OSF (https://osf.io/gejqb). Codebook and data are available at https://osf.io/n46k5. Note that two studies are included in this pre-registration. The study labeled Study 2 in the pre-registration is the current study described here. The study labeled Study 1 in this pre-registration is a single-condition version of the current study, without a human driver control condition. Results for this additional study were fully consistent but redundant with the current study. As a result, we report the alternate study in the Supplementary Materials as “Alternate Study”.
Participants
As in Study 1, a nationally representative sample was recruited using YouGov’s omnibus survey. The sample included 1000 participants, 104 of which were discarded for not completing one or more of the key questions (sample size was again determined by what was available through the survey company; demographics in Table S1). This left a sample of 896 (449 in the AV condition, 447 in the human driver condition).
Method
Methods were identical to those of Study 1 but safety was framed in terms of percentile ranking among US drivers. The required safety threshold question read as follows:
How much safer than the average human would a self-driving car need to be before you would choose to buy one?
For example, assume that the average human driver has a 1 in 600 lifetime chance of dying in a car crash, if he or she drove him or herself. If this person always rode in a self-driving car that was 10% safer than the average human, he or she would instead have a 1 in 660 lifetime chance of dying in a car crash. If this person always rode in a self-driving car that was 50% safer, he or she would have a 1 in 1200 lifetime chance of dying in a car crash.
Respondents answered on a 100-point scale with the prompt “I would ride with a
self-driving car that [driver who] was, at minimum, a safer driver than X% of drivers in the US,” and anchors at “0%”, “25%”, “50%”, “75%”, and “Only if it were 100% safe”.
The own safety-estimate question read as follows:
We would like to know about what you think about how safely you drive an automobile. All drivers are not equally safe drivers. We want you to compare your own skill to the skills of the other people in the United States. By definition, there is a least safe and a most safe driver in the country. We want you to indicate your own estimated position in the nation. Of course, this is a difficult question because you do not know all the people in the US, much less how safely they drive. But please make the most accurate estimate you can.
Participants responded on a 100-point slider, with the prompt I am a safer driver
than X% of the drivers in the US,” and anchors at “0%”, “25%”, “50%”, “75%”, and
“100%”.
Results
The results closely replicated those of Study 1. The vast majority of respondents again rated themselves as better than average drivers (median=76thpercentile;
mean=71.89), with most respondents believing themselves to be in the top 25 percent of drivers, and this was again true in all demographic groups (Figure 1B). This inflated self-perception was again a strong predictor of respondents’ minimum safety requirement for both AVs and human drivers (Table 1, Figure 3B).
Figure 3. Main results of the second national US survey. In Study 2, just as in Study 1, (A) adoption rates climb slowly as a function of the safety of autonomous or human-driven vehicles, and (B) the safety level that people require is strongly determined by how safe they believe themselves to be.
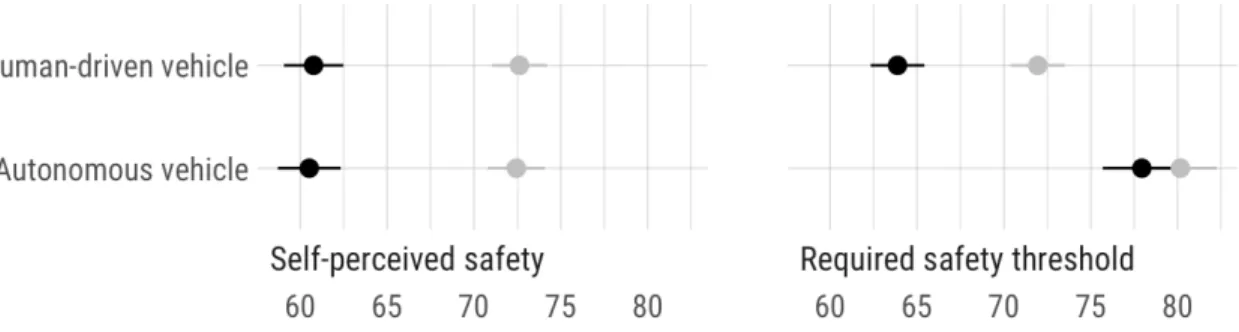
Moreover, again in line with algorithm aversion, people would be less forgiving of errors among AVs than when being driven by another human being. That is, people demanded higher thresholds of safety from AV taxis than from human taxi-drivers. At all
but the lowest safety thresholds (see Table 1 and Figure 4); respondents were less likely to ride in an AV than with a taxi driver, when the AV and the taxi driver had the same level of safety. We can only speculate as to why, in both samples, more participants were willing to ride in an AV than with a human driver at the lowest threshold (10% or less). One possibility is that this group includes a subset of AV enthusiasts, who would be excited to ride in an autonomous vehicle even if it had a dubious safety record. For example, in Study 2, 19 respondents indicated they would be willing to ride in an AV even if it was in the bottom percentile of drivers in terms of safety, whereas this was true of only one respondent in the human driver condition. Overall, however, a much larger group requires higher, not lower, safety thresholds from AVs.
Figure 4. Algorithm aversion in self-driving cars. At nearly every level of safety threshold, participants were less willing to be driven by a self-driving car than an equally-safe human being.
In sum, two pre-registered studies with nationally representative samples indicate that people’s demanded safety threshold from AVs are calibrated to their perceptions of their own safety, and these self-perceptions are not calibrated to reality. Second,
algorithm aversion effects showed that, even at the same level of safety, people reported less willingness to be driven by a self-driving car than by a fellow human. Together, these two studies suggest that extremely high—possibly unrealistically high—safety standards are required to compel people to people to choose AVs over their human-driven
alternatives. Thus, for our final study, we investigated whether attempts to debias
people’s inflated views of their own driving safety might lower the level of safety people demanded from AVs.
Study 3
Open Science
Before data were collected, the hypotheses, materials, and analysis plan for Study 3 were pre-registered on Open Science Framework (https://osf.io/wkj6p). Codebook and data are available at https://osf.io/n46k5.
Participants
We recruited 2000 participants on May 22, 2018 and ultimately received 1925 completed surveys (sample size selected to match Study 1; demographics in Table S1). As the experimental method required a longer and more complicated design than was feasible for YouGov’s omnibus survey, this study was conducted using Amazon’s Mechanical Turk, an online worker platform that has been extensively used in and validated for social scientific research.
Method
We randomly assigned half our participants (n=961) in a better-than-average effect debiasing condition. Following prior research showing that numerous other biases can be reduced by merely educating people about the existence of the bias (Morewedge et al., 2015), we informed participants in the debiasing condition of the existence of the illusory superiority bias, giving them the definition and three popular examples (physical attractiveness, teaching ability, and, most relevantly, driving safety; see Figure S1 for an example screenshot). The other half (n=963) received no manipulation. We then asked all participants to rate their own safety level and, on a subsequent page, indicate the
threshold of safety they would require to ride in a ride-sharing service car that was driven by a human driver or that was autonomous. As in Study 2, we used percentile rank as the metric for both self-estimates and threshold demanded. As in Studies 1 and 2, we asked a random half of the participants about the safety threshold demanded to ride with an AVs and the other half about the safety threshold demanded to ride with a human driver. This made for a 2 (informed about illusory superiority effect vs not) X 2 (human driver vs AV) between-subjects design.
We pre-registered a prediction that informing people about the illusory superiority effect would reduce their safety self-estimates and safety threshold demands for both human drivers and AVs. Given the findings on algorithm aversion in Studies 1 and 2, we tentatively predicted an interaction for the safety thresholds such that the reduction would be smaller for AVs than for human drivers.
Results
Results are displayed in Figure 5. First, we conducted a one-way ANOVA comparing people’s minimum safety thresholds for riding with an AV compared to a human driver. Replicating the algorithm aversion results from Studies 1 and 2, people demanded a higher threshold from AVs (MAV=79.05) than from human drivers
(Mhuman=67.94), F(1,1921)=136.71, p<.001. Next, we tested whether the debiasing
manipulation affected people’s self-perceptions of safety, and found that learning about the existence of the illusory superiority bias did indeed reduce people’s ratings of their own safety percentile by an average of 12 percent, Mcontrol=72.53 vs. Mdebiasing=60.64;
F(1,1920)=190.73, p<.001. The most pertinent question, however, was whether the
manipulation that had reduced people’s estimates of their own safety would in turn reduce the safety they demanded from driverless cars and other human drivers?
Figure 5. Effects of a debiasing intervention. Participants who learn about the better-than-average effect provide a lower estimate of their own safety as a driver and require a lower safety threshold from humans to drive them, but they still require the same safety threshold from autonomous vehicles.
A two-way ANOVA yielded an overall main effect—those receiving the
debiasing manipulation reduced the safety threshold they demanded, F(1,1921)=29.71,
human driver condition, F(1,1921)=9.47, p=.002. Decomposing the interaction reveals a robust effect of debiasing in the human driver condition (F1, 960=56.43, p<.001), but, contrary to predictions, no significant effect in the AV condition, F(1,961)=1.98, p=0.16 (see Fig. 2). Thus, whereas attempts to debias people about their own inflated
self-estimates of safety reduces the safety threshold people require of riding with other human beings, it appears to have no similar effect—at least none of a size that could be detected with our well-powered study (n=1925)—in making AVs more palatable.
General Discussion
These findings reveal that the demand for very high levels of safety for riding in AVs are tied to the psychological biases of illusory superiority and algorithm. This underscores the challenges of designing AVs that are safe enough to satisfy the demands of potential consumers. While there are compelling reasons to allow AVs on the road as soon as they are somewhat safer than the average human, the current findings suggest that consumers may have much more stringent safety thresholds before they opt-into using AVs. These thresholds are related both to a general tendency to reject AVs over human drivers even at comparable levels of safety (algorithm aversion), and to people’s inflated views of their own driving safety (the better-than-average effect). However, the experiment in Study 3 showed that while alerting people to the pervasiveness of illusory superiority was able to lower the thresholds people required to drive with other human beings, debiasing people’s self-perceptions of their safety records left their thresholds for riding in an AV unchanged. While other techniques may prove more effective, the lack of an effect in our study suggests that people’s safety requirements for AVs may be
particularly sticky. Self-perceptions of safety may not have a tight causal impact on safety requirements from AVs, and fostering doubt over people’s own driving safety may not be an effective lever to pull to make AVs more attractive.
Implications
Combined with the RAND report’s projections, these findings paint a concerning picture. As RAND estimated, if we wait for AVs to be 90 percent (rather than 10 percent) safer than the average human driver, we risk failing to save thousands, if not hundreds of thousands, of lives that will be lost while we perfect AV technology (Kalra & Groves, 2017). But what we show is that if regulators were to allow the broad deployment of 10-per-cent-safer AVs, various psychological biases could interfere with large-scale adoption and thus prove to be a substantial public health hazard insofar as they prolong the era of much more dangerous human driving. Furthermore, other psychological biases involving risk perception (Shariff et al. 2017) and betrayal aversion (Koehler & Gershoff, 2003;see below) raise concerns about how much error the public is willing to tolerate. Some accidents are inevitable, but rolling out and even road-testing AVs too early or too riskily, when many more accidents are likely to occur, could build up an early reluctance that might prove very difficult to overcome in the future. The physical threats and attacks on AV cars that have emerged following the 2018 Uber fatality may be a particularly violent augur of a growing discomfort among the public.
Though our results question the viability of rolling out AVs that are only marginally safer than the average human driver, they do not necessarily preclude its possibility. First, there is a minority of drivers who admit themselves to be below average
drivers and who don’t have as stringent safety thresholds for riding in an AV. Though people tend not to be particularly accurate in their self-evaluations of driving ability, this minority at least identify as some of the least safe drivers. Moving at least this group to somewhat safer AVs would be beneficial. Second, norms can change quickly (Amato et al., 2018), and anecdotes abound about how quickly passengers move from being apprehensive of being driven by an AV to comfortable (and then potentially over-trusting) once they get in one of the cars. Third, the results here are based on
people’s reports about still hypothetical safety thresholds in a future yet to arrive; this is a notable limitation as actual consumer behavior could differ substantially. The context of AVs is sure to change as the technology evolves and penetration increases. As this happens, other factors will no doubt emerge as important determinants of consumer trust and rider willingness. Nevertheless, the results do raise the question about how much promises about safety should be the focus of the AV industry—a question we explore in the next section.
Is the focus on safety misplaced?
Thus far, manufacturers, policy-makers, and other advocates for AVs have focused on the safety promises of the vehicles, with frequently-repeated promises that AVs will ultimately reduce traffic fatalities by figures such as 90 percent—sometimes even 93 percent or 94 percent (National Highway Traffic Safety Administration, 2017). This foregrounding of the safety benefits is understandable given that the promise of saved lives may also be a more politically saleable goal than, for example, improvements in convenience. Perhaps more importantly, those in the industry are well aware that safety has emerged as the primary source of the public’s reticence to shift from human-driven to
autonomously-driven vehicles. A global report from 2016 found that safety was the primary concern among those who reported being unlikely to ride in an AV (Lang et al., 2016). Similarly, a 2017 Pew poll found that the two the two most common reasons by people reticent to ride in an HAV were lack of trust (42 percent) and safety (30 percent) (Smith & Anderson, 2017). The third-place response—the enjoyment of driving
oneself—was cited by only 9 percent of these respondents. Meanwhile a poll by the American Automobile Association has found that the proportion of Americans who report being too afraid to ride in an AV increased from 63 percent in October of 2017 to 73 percent in April of 2018 (American Automobile Association, 2018). However, this worsening trajectory may hint that, for the goal of increasing public acceptance and expediting mass adoption, this focus on safety may be a tactical misstep. Below we discuss five interrelated reasons why this might be the case.
First, the pledge that traffic fatalities would be reduced by 90-94 percent is both somewhat arbitrarily derived and—in the context of any reasonable timeframe—an overpromise. The 94 percent figure was arrived at by determining the percentage of traffic fatalities in which the immediate proximate cause was human error, and then determining that all such accidents would be eliminated if human drivers were also eliminated. However, as several researchers have noted, this determination is more art than science. “Human error” is a loose criterion that is deduced from the absence of obvious mechanical or infrastructure failures. Moreover, even if an error in driver judgment or perception occurred, there may still have been other involved factors such that the crash could still have occurred without faulty human behavior. Thus the 94 percent figure likely overstates the number of accidents that could be realistically reduced
by simply replacing human drivers with automation (Noy et al., 2018; OECD/ITF, 2018). Finally, this figure assumes no new types of fatalities are introduced as a byproduct of the new autonomous technologies—an assumption that is rendered less warranted with every new accident in which the early versions of these technologies are found culpable (Noy et al., 2018).
Second, determining if and when we reached this (or any) standard of relative safety will require substantial amounts of real-world data. Estimates from a RAND report put this number well into the billions of miles, and the smaller the improvement of AVs over human drivers, the more data will be needed to reliably detect a significant
difference (Kalra & Paddock, 2016). This creates a critical chicken-and-egg problem for AVs; given the infeasibility of collecting this much data with test vehicles, knowing whether we have reached a promised threshold of safety can only occur after the cars have been widely accepted among consumers. This means that any promises of relative safety advantages that are made to the initial tens of thousands of initial adopters of autonomous technologies will have wide-enough confidence intervals so as to be misleadingly inaccurate. Thus, those making promises of AVs eliminating X percent of traffic fatalities are making a promise that no one knows when or how precisely it can be met.
Third, the inaccurate promises about safety sit uneasily along the AV-related fatalities that have already occurred—and may exacerbate the negative psychological responses they’ve produced. The increase in public distrust in AVs from 2017 to 2018 has been attributed, at least in part, to the high-profile fatalities involving the autonomous driving technologies employed by Tesla and Uber. The novelty of these tragic collisions
has stimulated considerable media attention, feeding people’s affective (Finucane et al., 2000) and availability (Tversky & Kahneman, 1973) heuristics, and inflating the
perception of risk of AVs compared to human driving. Whereas there were an estimated 37,000 traffic fatalities in the US in 2018, none received anything close to the attention of the self-driving Uber accident in Phoenix, AZ. This is a pattern that is likely to continue as many more instances of novel AV accidents (an AV kills a child, two AVs collide with each other, etc.) accrue.
Beyond these well-understood heuristics, more recently discovered psychological phenomena reveal how the combination of the focus on safety and instances of
less-than-perfect safety could prove especially toxic to public trust. Research on the concept of betrayal aversion has shown that people react especially negatively when harm is caused by features that were supposed to be protective. For example, Koehler and Gershoff (2003) found that people awarded more and larger punitive damages to victims of a fire caused by a smoke alarm than one caused by a refrigerator because the harm caused by a smoke alarm (a safety device) involved betrayal. Critically, the researchers further found that when choosing between two options, people preferred a product that was less effective at reducing the risk of harm, if it meant avoiding even a slight possibility of betrayal. For example, participants willingly chose a vaccine that had a 2 percent chance of being ineffective, over a different vaccine that had a 1 percent chance of being ineffective, but also carried a 0.01 percent chance of causing harm itself.
The Uber and Tesla collisions were tragic in the lives that were immediately lost, but may prove even more costly in the cumulative effect they have on slowing and even reversing enthusiasm for AVs, and thereby delaying adoption of an ultimately life-saving
technology. Outsized reactions to these initial fatalities were likely inevitable, however, the negative impact may have been exaggerated by these fatalities occurring alongside oft-repeated promises of AVs’ safety. The juxtaposition of grand promises of safety and the apparent betrayal of these promises seen in the inevitable fatalities that occur, could dig a deep psychological hole for the public.
Fourth, while safety promises may pose a risk of intensifying negative reactions, they may have limited upside as well. The studies we present in the current paper demonstrate that even unrealistically extreme promises of safety are still insufficient to convince large swathes of the population that AVs will prove to be a safer alternative. Thus, safety promises may paradoxically do more to repel the public than entice them. By raising issues of safety in the hopes of appealing to safety-concerned customers, AV manufacturers and advocates may achieve the exact opposite
Finally, a fifth reason that the intense emphasis on AVs potential for safety may be a misstep is opportunity costs. Consumers obviously make choices based on multiple criteria. That participants in the current research consistently chose human drivers over equally safe automated ones suggests that there were considerations other than safety that appealed to them about a human driver. The emphasis on safety crowds out discussion of the other benefits that AVs themselves may have—such as convenience. These benefits may have a much greater positive impact. Traffic fatalities, though too frequent, are rare—with a US motorist’s lifetime chance of dying in a traffic accident standing at 1 in 572 in 2017 (National Center for Health Statistics, 2019). Moreover, due to a
combination of the better-than-average effect (discussed above) and the optimism bias (the tendency to underestimate one’s own chance of experiencing negative events; Sharot,
2011), people underestimate their own risk of experiencing an accident (DeJoy, 1989). As a result, AVs’ advantage in avoiding such a rare occurrence may hold less appeal to the average motorist than the more concrete advantage in increasing the convenience of one’s commute. As noted in the introduction, the average American commutes for an unhappy 55 minutes per day. Lessening the overt pain of that commute may endear potential consumers to AVs more than their uncertain and dubious marginal value in one day reducing the hypothetical chance of a traffic fatality.
In sum, we are in a moment when the safety benefits of AVs are likely to be overpromised and uncertain, when such overpromises and uncertainties are likely to further undermine the brittle trust consumers have for AVs, and when there are other bases on which to improve the appeal of AVs to the public, and expedite the acceptance of the technology. While it may be intuitive to try to appeal to a fearful public by making promises about safety, this approach may be worth reconsidering.
Conclusion
Public attitudes are, of course, not public policy. Policy-makers should resist falling themselves for the more irrational biases of the greater public. However,
policy-makers must be aware of how their constituents think in order to structure policies that are both acceptable and beneficial to them. Our results speak to the need to take psychological factors seriously today, as attitudes and policies are being formed. In an ideal world of rational actors, people would accurately estimate their driving skill, and as a result properly calibrate to how much an AV could improve their safety. Psychological biases may complicate this calculus. If the many potential benefits of AVs are to be
realized, manufacturers and policy experts would do well to be cognizant of these biases, and researchers can contribute by better understanding them, their context, and how they might be overcome.
References
Amato, R., Lacasa, L., Díaz-Guilera, A., & Baronchelli, A. 2018. The dynamics of norm change in the cultural evolution of language. Proceedings of the National Academy of
Sciences. 115 (33), 8260-8265.
American Automobile Association. 2018. American trust in autonomous vehicles slips. Available at:
https://newsroom.aaa.com/2018/05/aaa-american-trust-autonomous-vehicles-slips/ Burton, J. W., Stein, M. K., & Jensen, T. B. (2020). A systematic review of algorithm aversion in augmented decision making. Journal of Behavioral Decision Making,
33(2), 220-239.
DeJoy, D. M. (1989). The optimism bias and traffic accident risk perception. Accident
Analysis & Prevention, 21(4), 333-340.
Dietvorst, B. J., Simmons, J. P., & Massey, C. 2015. Algorithm aversion: People erroneously avoid algorithms after seeing them err. Journal of Experimental
Psychology: General. 144 (1), 114.
Dietvorst, B. J., Simmons, J. P., & Massey, C. 2016. Overcoming algorithm aversion: People will use imperfect algorithms if they can (even slightly) modify them.
Management Science. 64 (3), 1155-1170.
Duarte, F., & Ratti, C. (2018). The impact of autonomous vehicles on cities: A review. Journal of Urban Technology, 25(4), 3-18.
Finucane, M. L., Alhakami, A., Slovic, P., & Johnson, S. M. 2000. The affect heuristic in judgments of risks and benefits. Journal of behavioral decision making. 13 (1), 1-17.
Harper, C. D., Hendrickson, C. T., Mangones, S., & Samaras, C. 2016. Estimating potential increases in travel with autonomous vehicles for the non-driving, elderly and people with travel-restrictive medical conditions. Transportation research part C:
emerging technologies. 72, 1-9.
Harris, M. 2017. Google has spent over $1.1 billion on self-driving tech. IEEE Spectrum. Available at:
https://spectrum.ieee.org/cars-that-think/transportation/self-driving/google-has-spent-o ver-11-billion-on-selfdriving-tech
Hulse, L.M., Xie, H., &. Galea, E.R. 2018. Perceptions of autonomous vehicles: Relationships with road users, risk, gender and age. Safety Sci. 102, 1-13.
International Transport Forum. (2018). Safer Roads with Automated Vehicles? Available at: https://www.itf-oecd.org/sites/default/files/docs/safer-roads-automated-vehicles.pdf Kahneman, D., Krueger, A. B., Schkade, D. A., Schwarz, N., & Stone, A. A. 2004. A
survey method for characterizing daily life experience: The day reconstruction method. Science. 306 (5702), 1776-1780.
Kalra, N., & Groves, D.G. 2017. The enemy of good: Estimating the cost of waiting for
nearly perfect automated vehicles. RAND Corporation. Available at:
https://www.rand.org/content/dam/rand/pubs/research_reports/RR2100/RR2150/RAN D_RR2150.pdf
Kalra, N., & Paddock, S. M. 2016. Driving to safety: How Many Miles of Driving Would
It Take to Demonstrate Autonomous Vehicle Reliability? RAND Corporation.
Koehler, J. J., & Gershoff, A. D. 2003. Betrayal aversion: When agents of protection become agents of harm. Organizational Behavior and Human Decision Processes. 90 (2), 244-261.
Lanctot, R. 2017. Accelerating the future: The economic impact of the emerging
passenger economy. Strategy Analytics.
Lang, N., Rüßmann, M., Mei-Pochtler, A., Dauner, T., Komiya, S., Mosquet, X., & Doubara, X. 2016. Self-driving vehicles, robo-taxis, and the urban mobility revolution. The Boston Consulting Group.
Longoni, C., Bonezzi, A., & Morewedge, C. (2019). Resis- tance to medical artificial intelligence. Journal of Con- sumer Psychology, 46(4), 629–650.
Lütge, C. 2017. The German ethics code for automated and connected driving. Philosophy & Technology. 30 (4), 547-558.
Morewedge, C. K., Yoon, H., Scopelliti, I., Symborski, C. W., Korris, J. H., & Kassam, K. S. 2015. Debiasing decisions: Improved decision making with a single training intervention. Policy Insights from the Behavioral and Brain Sciences. 2 (1), 129-140. National Highway Traffic Safety Administration. 2017. Automated Driving Systems 2.0:
A Vision for Safety. Available at:
https://www.npr.org/sections/thetwo-way/2017/09/12/550533833/department-of-transp ortation-rolls-out-new-guidelines-for-self-driving-cars.
National Highway Traffic Safety Administration. 2017. Traffic safety facts, research
note: 2016 fatal motor vehicle crashes: Overview. Available at:
Noy, I. Y., Shinar, D., & Horrey, W. J. (2018). Automated driving: Safety blind spots. Safety science, 102, 68-78.
OECD/ITF. 2018. Safer Roads with Automated Vehicles: International Transport Forum. Available at:
https://www.itf-oecd.org/sites/default/files/docs/safer-roads-automated-vehicles.pdf Shariff, A., Bonnefon, J.F., & Rahwan, I. 2017. Psychological roadblocks to the adoption
of self-driving vehicles. Nat. Hum. Behav. 1, 694-696.
Sharot, T. 2011. The optimism bias. Current biology. 21 (23), R941-R945. Smith, A., & Anderson, M. 2017. Automation in everyday life. Pew Foundation. Svenson, O. 1981. Are we all less risky and more skillful than our fellow drivers? Acta
psychologica. 47 (2), 143-148.
Tversky, A., & Kahneman, D. 1973. Availability: A heuristic for judging frequency and probability. Cognitive psychology. 5 (2), 207-232.
U.S. Census Bureau. 2017. Average one-way commuting time by metropolitan areas. Available at: https://www.census.gov/library/visualizations/interactive/travel-time.html Acknowledgments
Funding: Shariff acknowledges funding from a Canada 150 Research Chair grant from the Social Sciences and Humanities Research Council. Bonnefon acknowledges support from the ANR-Labex Institute for Advanced Study in Toulouse, the ANR-3IA Artificial and Natural Intelligence Toulouse Institute and grant no. ANR-17-EURE-0010 from Investissements d’Avenir. I.R. acknowledges support from the Ethics and Governance of Artificial Intelligence Fund. The funders had no role in study design, data collection and analysis, decision to publish or preparation of the manuscript.
Author contributions: All authors contributed equally. Competing interests: There are no competing interests.
Data and materials availability: Data, pre-registration documents, and question wording, are available at
Supplemental Materials
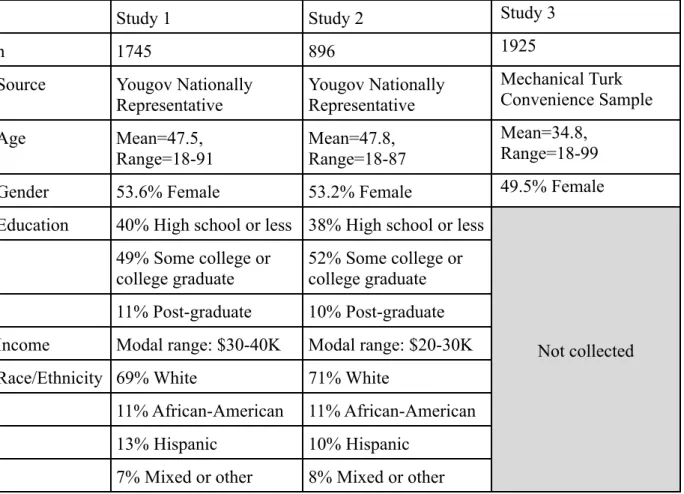
Table S1. Demographics breakdown of samples (Studies 1-3).
Study 1 Study 2 Study 3
n 1745 896 1925
Source Yougov Nationally Representative Yougov Nationally Representative Mechanical Turk Convenience Sample Age Mean=47.5,
Range=18-91 Mean=47.8,Range=18-87
Mean=34.8, Range=18-99
Gender 53.6% Female 53.2% Female 49.5% Female
Education 40% High school or less 38% High school or less
Not collected 49% Some college or
college graduate 52% Some college orcollege graduate 11% Post-graduate 10% Post-graduate Income Modal range: $30-40K Modal range: $20-30K
Race/Ethnicity 69% White 71% White
11% African-American 11% African-American
13% Hispanic 10% Hispanic
Alternate Study
Alongside Study 2 from the main text, we also pre-registered and conducted an additional study that featured a condition asking participants the level of safety they would demand from an AV, but unlike Study 2, did not include a condition asking what level of safety they would require to be driven by a fellow human. As a result, this study could only test the relevance of the better-than-average effect, and not the algorithm aversion effect.
Open Science
Before data were collected, the hypotheses, materials, and analysis plan for this study were pre-registered on Open Science Framework (https://osf.io/gejqb), where it is labeled as “Study 1”. Codebook and data are available as part of Study 2 at
https://osf.io/n46k5.
Participants
As in Studies 1-2, a nationally representative sample was recruited using YouGov’s omnibus survey. The sample included 1000 participants, 108 respondents failed to complete one or more of the key questions, and thus could not be included in the analyses, leaving 892 in the analysis.
Method
The method was identical to Study 2 from the main text, with the exception that all respondents received the question of their required safety threshold (as measured in percentiles) for an autonomous vehicle. That is, they were not randomly assigned to AV or human driver conditions. As in Study 2, all respondents also reported their
than X% of the drivers in the US,” and anchors at “0%”, “25%”, “50%”, “75%”, and
“100%”.
Results and Discussion
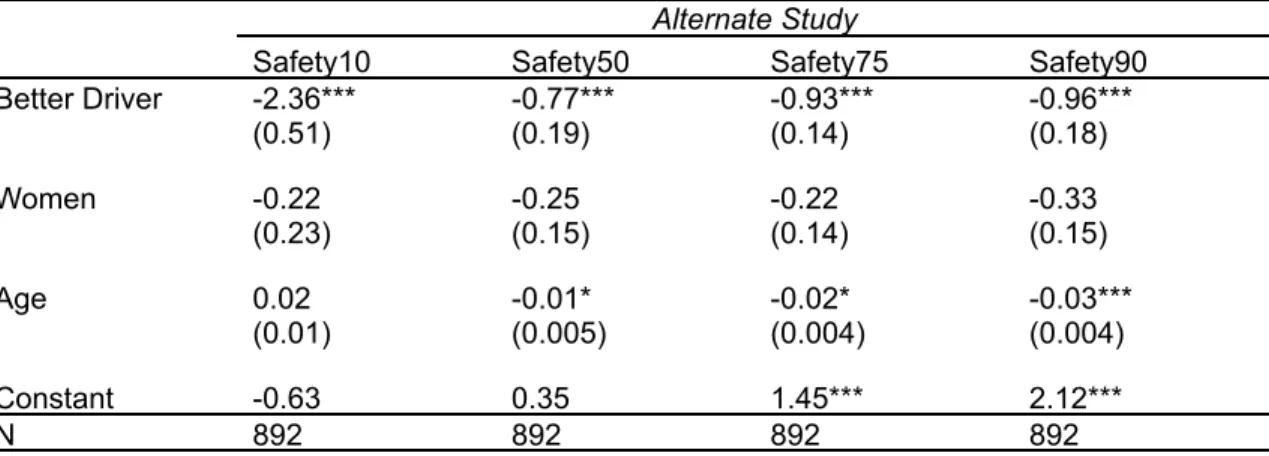
As in Studies 1 and 2, the willingness to buy an AV at every safety threshold was predicted by whether the respondents perceived themselves to be below or above this safety threshold (Table S2). This is consistent with the other studies in showing that (likely overly optimistic) self-perceptions of safety are strongly predictive of how much safety people will demand from AVs. As in previous studies, this factor was generally a better predictor of willingness to ride in an AV than the oft-discussed demographic variables of gender and age.
Table S2. Results from logistic regressions for the acceptance of four safety
improvements over average human drivers: 10, 50, 75, and 90 percent. "Better Driver" indicates whether self-perceived skill higher than safety level; *=p<.05, **=p<.01, ***=p<.001.
Alternate Study
Safety10 Safety50 Safety75 Safety90 Better Driver -2.36*** -0.77*** -0.93*** -0.96*** (0.51) (0.19) (0.14) (0.18) Women -0.22 -0.25 -0.22 -0.33 (0.23) (0.15) (0.14) (0.15) Age 0.02 -0.01* -0.02* -0.03*** (0.01) (0.005) (0.004) (0.004) Constant -0.63 0.35 1.45*** 2.12*** N 892 892 892 892
Figure S1: Screenshot of one of the pages of Study 3’s debiasing manipulation, which explained the better-than-average effect to participants and gave them several examples.