Repetitive Activation of the Corticospinal Pathway by Means of rTMS may Reduce
the Ef
ficiency of Corticomotoneuronal Synapses
Wolfgang Taube
1, Christian Leukel
1,2, Jens Bo Nielsen
3,4and Jesper Lundbye-Jensen
3,41
Department of Medicine, Movement and Sport Science, University of Fribourg, 1700 Fribourg, Switzerland,
2Department of Sport
Science, University of Freiburg, Germany,
3Department of Nutrition, Exercise and Sports, and
4Department of Neuroscience and
Pharmacology, University of Copenhagen, DK-1165 Copenhagen, Denmark
Address correspondence to Wolfgang Taube, Department of Medicine, Movement and Sport Science, University of Fribourg, Boulevard de Pérolles 90, 1700 Fribourg, Switzerland. Email: [email protected]
Low-frequency rTMS applied to the primary motor cortex (M1) may
produce depression of motor-evoked potentials (MEPs). This
depression is commonly assumed to re
flect changes in cortical
cir-cuits. However, little is known about rTMS-induced effects on
sub-cortical circuits. Therefore, the present study aimed to clarify
whether rTMS in
fluences corticospinal transmission by altering the
ef
ficiency of corticomotoneuronal (CM) synapses. The corticospinal
transmission to soleus
α-motoneurons was evaluated through
con-ditioning of the soleus H-re
flex by magnetic stimulation of either M1
(M1-conditioning) or the cervicomedullary junction
(CMS-condition-ing). The
first facilitation of the H-reflex (early facilitation) was
deter-mined after M1- and CMS-conditioning. Comparison of the early
facilitation before and after 20-min low-frequency (1 Hz) rTMS
revealed suppression with M1- (
−17 ± 4%; P = 0.001) and
CMS-conditioning (
−6 ± 2%; P = 0.04). The same rTMS protocol caused
a signi
ficant depression of compound MEPs, whereas amplitudes of
H-re
flex and M-wave remained unaffected, indicating a steady level
of motoneuronal excitability. Thus, the effects of rTMS are likely to
occur at a premotoneuronal site
—either at M1 and/or the CM
synapse. As the early facilitation re
flects activation of direct CM
pro-jections, the most likely site of action is the synapse of the CM
neurons onto spinal motoneurons.
Keywords: corticospinal tract, H-re
flex conditioning, synaptic plasticity
Introduction
The strength of synapses and synaptic transmission has been
shown to be modi
fiable, and changes in synaptic efficiency
contribute to an essential property of our central nervous
system (CNS): its plasticity. This capacity for neural
reorganiz-ation is fundamental for the formreorganiz-ation of memory and learning
as well as neural repair. During recent years, different
noninva-sive electrophysiological methods have been developed,
which allow induction of plastic changes such as long-term
potentiation or inhibition within the CNS in isolation or in
combination with motor learning or rehabilitation paradigms.
These methods encompass repetitive transcranial magnetic
stimulation (rTMS), repetitive peripheral nerve stimulation
(
Ridding et al. 2000
), transcranial direct current stimulation
(
Nitsche and Paulus 2000
), and paired associative stimulation
(PAS) at the cortical (
Stefan et al. 2000
) and spinal levels
(
Taylor and Martin 2009
). rTMS has proven to be a powerful
in-strument to either reduce or enhance cortical/corticospinal
excitability depending on the stimulation protocol:
low-frequency rTMS (stimulus rates of, e.g., 1 Hz or less) induces a
longer lasting decrease in corticospinal excitability (
Chen et al.
1997
) whereas conventional high-frequency rTMS (5 Hz or
more) produces an increase in corticospinal excitability and a
reduction in intracortical inhibition (
Fitzgerald et al. 2006
). In
general, the aftereffects of rTMS are ascribed to changes in
cor-tical circuits. For instance,
Tsuji and Rothwell (2002)
demon-strated that the long-latency responses of the transcortical
stretch re
flex but not the spinal short-latency components were
affected by rTMS indicating intracortical processes at work.
In an elegant study involving direct recordings from the high
cervical epidural space,
Di Lazzaro et al. (2008)
strengthened
this hypothesis by showing that 1 Hz rTMS decreased the
am-plitude of descending later I-waves that depend on the intrinsic
circuitry of M1. Although evidence of the underlying cellular
processes is scarce, currently favored mechanisms are
activity-dependent changes in the ef
ficiency of synaptic
con-nections between cortical neurons (
Hallett 2007
;
Funke and
Benali 2011
).
However, it is important to emphasize that the
finding that
low-frequency rTMS induces effects at a cortical level does not
by any means preclude concomitant changes at a subcortical
and/or spinal level. These spinal plastic changes not only may
involve up- or down-regulation of membrane channels and
receptors in motoneurons and interneurons leading to changes
in their excitability (
Heckman et al. 2009
), but may also
involve plastic changes in the ef
ficiency of the corticospinal
sy-napses. Given the central role of the synapse for neuronal
plas-ticity, there is, however, surprisingly little research on the
modulation and plasticity of the corticospinal synapses. It has
been demonstrated in human (
Nielsen and Petersen 1994
) and
animal experiments (
Rudomin et al. 1975
) that corticospinal
synapses are not in
fluenced by presynaptic GABAergic
inhi-bition evoked by large diameter afferents, but this does not
rule out the possibility that the ef
ficiency of the synapses is
controlled by other intrinsic and extrinsic mechanisms.
Indeed, it has been known for some time that
corticomoto-neuronal (CM) synapses show activity-dependent short-term
plastic changes (
Porter and Lemon 1993
). Furthermore,
changes in the ef
ficacy of CM synapses were proposed to be—
at least partly
—responsible for altered transmission from M1
neurons to
α-motoneurons (
Davidson et al. 2007
). In humans,
Taylor and Martin (2009)
and
Leukel et al. (2012)
demonstrated
that repeated pairs of presynaptic ( produced by cortical
stimu-lation) and antidromic postsynaptic volleys ( produced by
peripheral nerve stimulation), delivered to the corticospinal
–
motoneuronal synapses, altered corticospinal transmission. It
was suggested that these changes could partly be explained by
changes in the ef
ficiency of the CM synapse. Furthermore,
there is indirect evidence that strong voluntary contractions
reduce the transmission across, that is, ef
ficacy of corticospinal
© The Author 2014. Published by Oxford University Press. All rights reserved.Cerebral Cortex June 2015;25:1629–1637 doi:10.1093/cercor/bht359
synapses (
Petersen et al. 2003
). Apart from these few
findings,
there is, to our knowledge, no evidence of plastic changes in
the ef
ficiency of the CM synapse.
It was, therefore, the purpose of the present study to
investi-gate whether rTMS can induce a change in the ef
ficiency of the
CM synapse, and thus whether part of the depression of
motor-evoked potential (MEP) amplitudes observed following rTMS
(see, e.g.,
Lundbye-Jensen et al. 2011
) may be explained by a
change in CM synaptic transmission. In the
first step
(Exper-iment I), the effect of 20-min low-frequency (1 Hz)
suprathres-hold rTMS on the compound MEP, and the H-re
flex was tested
in order to assess changes in corticospinal and motoneuronal
excitability, respectively. To test for changes in motoneuronal
excitability, H-re
flex recruitment curves were recorded in
order to evaluate the whole range of the motoneuron pool. In
the next step (Experiment II), an H-re
flex conditioning
tech-nique was applied in order to assess alterations in the fastest,
direct corticospinal pathways (
Nielsen et al. 1993
). During
clas-sical H-re
flex conditioning (called M1-conditioning herein),
cortical stimulation is timed so that the descending volley
coincides with the excitation generated by the Ia afferent
volleys after peripheral nerve stimulation (
Nielsen et al. 1993
).
Owing to the high temporal resolution of this technique,
excit-ability in different fractions of the corticospinal pathway, that
is, in the fastest, presumably monosynaptic, CM connections
and in indirect oligo- and polysynaptic pathways, can be
probed and quantitatively assessed (
Nielsen et al. 1993
;
Nielsen and Petersen 1995a
;
Petersen et al. 1998
;
Taube et al.
2006
). Furthermore, the H-re
flex conditioning technique
allows an evaluation of the ef
ficiency of the corticospinal
acti-vation of the motoneurons that is not in
fluenced by the
excit-ability of the motoneurons themselves (
Nielsen et al. 1993
,
1995
). Therefore, the size of the earliest facilitation produced
by corticospinal stimulation re
flects the size of the descending
volley evoked by the stimulation and the ef
ficiency of the CM
synapse. For TMS over M1, the descending volley(s) may be
changed by prior rTMS due to changes in cortical excitability,
but this is not the case for the descending volley evoked by
stimulation of the corticospinal tract at the cervicomedullary
junction (CMS) (
Taube et al. 2011
). Consequently,
M1-conditioning can indicate whether rTMS in
fluences the fastest
direct corticospinal projections (the early facilitation) while
H-re
flex conditioning with stimulation at the cervicomedullary
junction (CMS-conditioning) further speci
fies whether
trans-mission at the corticomotoneural synapse is modi
fied. In the
present experiment, we therefore compared the effect of
20-min low-frequency (1 Hz) suprathreshold rTMS on the early
facilitation of the soleus H-re
flex evoked by either M1- or
CMS-conditioning.
Materials and Methods
Study Participants
Twenty-two subjects (age 25 ± 4 years) without neurological or ortho-pedic disorder participated in the present study. Nine subjects partici-pated in Experiment I and 13 in Experiment II. In Experiment I, H-reflex recruitment curves and MEP recruitment curves (see “Periph-eral nerve stimulation: H/M recruitment curves” and “Transcranial magnetic stimulation: MEP recruitment curves,” respectively) were ob-tained (see“rTMS Intervention”). In Experiment II, the effects of rTMS on corticospinal transmission were investigated using H-reflex con-ditioning by means of magnetic stimulation of the motor cortex and
the cervicomedullary junction (see“SOL H-reflex conditioning in pre-and postmeasurement”). Written informed consent was obtained from all participants prior to their participation in the study. The exper-iments (KF 01-131/03) were approved by the local ethics committee of the Copenhagen Capital Region of Denmark (De Videnskabsetiske Ko-miteer for Region Hovedstaden) and followed the regulations ex-pressed in the Declaration of Helsinki (1964).
Electromyography (EMG)
EMG recordings were obtained from the soleus (SOL) and tibialis anterior muscle (TA) of the right leg. After preparation, bipolar surface electrodes (Blue sensor N, Ambu®, Ballerup, Denmark) were attached
to the skin longitudinally above the muscle belly (2-cm interelectrode distance). The reference electrode was placed on the tibia plateau. EMG signals were amplified (×1000), bandpass-filtered (10–1000 Hz), and sampled at 4 kHz. The EMG was stored for offline analysis using custom-built software (LabView® based, National Instruments®,
Austin, TX, USA).
Peripheral Nerve Stimulation: H/M Recruitment Curves
H-reflexes in the SOL were elicited with an electrical stimulator (Digiti-mer DS7A, Hertfordshire, UK) by stimulating the posterior tibial nerve in the popliteal fossa. Stimuli consisted of square-wave pulses of 1 ms duration. The anode, a rubber pad of 5 × 5 cm, was fixed on the anterior aspect of the knee just underneath the patella. The cathode (2 cm in diameter) was placed in the popliteal fossa and moved stepwise until the best position for eliciting the H-reflex was found. It was ensured that stimulation evoked no response in the TA muscle. After finding the optimal position, the cathode was fixed with tape. In Experiment I, an H-reflex and M-wave recruitment curve was obtained at 4 different time points while subjects were seated at rest: 1) before the rTMS intervention (baseline), 2) immediately after rTMS, and 3) 10, and 4) 20 min after rTMS. Prior to the generation of recruitment curves, the M-wave threshold was defined as the minimum intensity required to elicit an M-wave that was visible in the online soleus EMG. During baseline measurements, stimuli were applied with intensities ranging from 0.5 to 3 × M-wave threshold (e.g., 10–100 mA) in steps of 0.1. Stimuli were elicited with a 4-s interstimulus interval, and the stimulation intensity was varied in a randomized order. For each inten-sity, 5 responses were elicited. Once the full recruitment curve was obtained, the stimulation intensity was increased until the maximal M wave (Mmax) was obtained. When the M wave ceased to increase and a
plateau was reached, the stimulation intensity was further markedly increased in order to ensure that the maximal M-wave was indeed obtained.
Recruitment curves following rTMS were generated in an identical procedure but with stimulation intensities in steps of 0.2 MT due to the short time in which we expected the neural adaptations in response to rTMS to be active. For each stimulus, the peak-to-peak amplitude of the M-wave and the H-reflex was measured. The responses evoked at a specific stimulation intensity were averaged across the 5 trials. Responses were normalized and expressed relative to the correspond-ingMmax.
Transcranial Magnetic Stimulation: MEP Recruitment Curves MEPs were elicited in SOL by applying TMS to the contralateral motor cortical leg area using a Magstim Rapid2TMS stimulator and a 90-mm
figure-of-eight coil (SP16097, Magstim Company Ltd., Whitland, UK; Fig.2). The optimal position of the coil for eliciting MEPs in the SOL muscle was established through a mini-mapping procedure of M1 and the coil was placed on the scalp over the hot spot of the SOL represen-tation with the handle of the coil pointing horizontally backward. After positioning of the coil, the resting motor threshold (1.0 MT) was deter-mined as the minimum intensity required to evoke MEP amplitudes larger than 50 µV in 3 of 5 consecutive trials. Responses were normal-ized and expressed relative to the corresponding Mmax. TMS was
applied with an interstimulus interval of 4 s. To ensure a constant pos-ition of the coil throughout the experiment, the head of the subjects and the coil were mechanicallyfixed. The head was laid down on a
table and was secured by means of rigid foam preventing head move-ments in all directions. The handle of the coil wasfixed to a stand (Manfrotto®, Italy) and secured with Velcro®straps to the subject’s
head. During all experiments involving TMS, a Brainsight™ image-guided TMS navigational system (Brainsight 2, Rouge Research, Mon-treal, Canada) was used for online monitoring of the coil position and orientation relative to the head and the identified stimulation hot spot.
In the control experiment (Experiment I), MEP recruitment curves were obtained in the same 9 subjects in whom H/M recruitment were investigated before and after rTMS. Magnetic stimuli were applied over M1 with different stimulation intensities in a random sequence ranging from 0.8 to 1.5 MT in steps of 0.1 with a 4-s interstimulus interval. At each stimulation intensity, 5 stimuli were recorded and the mean MEP was obtained as the average peak-to-peak amplitude of 5 trials. MEP recruitment curves were obtained 1) before the rTMS intervention, 2) immediately after rTMS, and 3) 10, and 4) 20 min after rTMS.
Cervicomedullary Stimulation by TMS
In the main experiment (Experiment II), cervicomedullary TMS was applied with maximum stimulator output using a Magstim®rapid mag-netic stimulator (Magstim, Whitland, UK) with a double-cone coil (in line withTaube et al. 2011andLeukel et al. 2012; Fig.2). A limitation of this technique is that, in most subjects, it is impossible to obtain magnetically evoked cMEPs in the leg muscles at rest (Ugawa et al. 1994;Oya et al. 2008). One approach to overcome this problem is to voluntary precontract the muscle. However, as changes in the contrac-tion strength may influence the size of the cMEP, the comparison of different tasks is difficult and measurements at rest are impossible. Therefore, we collided the cervicomedullary volley with the H-reflex (see“SOL H-reflex conditioning in pre- and postmeasurement”) and used a Magstim Rapid stimulator with a biphasic pulse, because it was previously shown that for a given amplitude of initial current, biphasic stimulation was more effective than monophasic stimulation (Kammer et al. 2001;Sommer et al. 2006). The coil was positioned so that the first derivative of the induced current was cranially directed, and that its central portion was placed on or near the inion (Taylor 2006;Taube et al. 2011). During the measurements, the subjects were seated in a custom-built chair thatfixed their legs and trunk in place, and were asked to bend their back and head forward. The head rested on a custom-built table and was secured with cushions. This position was maintained throughout all pre- and postmeasurements and was only changed during the rTMS intervention. In all 13 subjects, stimulation with the maximal stimulator output (100%) was still subthreshold and therefore did not elicit detectable responses in the surface EMG of the SOL muscle. Thus, the stimulus intensity of the magnetic stimulator remained constant at its maximal output (100%) throughout the experiment. The time interval between successive stimuli was 5 s.
H-Reflex as a Test (Control) Reflex
The size of the test H-reflex was measured as the peak-to-peak ampli-tude and was expressed as a percentage ofMmax. It has been
demon-strated that the susceptibility of the H-reflex to conditioning depends on the size of the control reflex (Crone et al. 1990). Therefore, it was ensured that the test reflex always had the same size of ∼20% of the maximal M-response, and that it was on the ascending portion of the H-reflex recruitment curve. Accordingly, the susceptibility of the test H-reflex for facilitation or inhibition induced by a constant condition-ing stimulus should be the same for cervicomedullary and cortical stimuli and in pre- and postmeasurements. It is important to note that the H-reflex is not only dependent on the motoneuron excitability, but also affected by presynaptic factors such as presynaptic inhibition of Ia afferents. Therefore, it has to be emphasized that, in the current study, we have tried to control for confounding factors. First, the control H-reflex had the same size in pre and postmeasurements (Fig.4C,F).
Second, the measurements were performed at rest so that both movement-related efferent and afferent activity is unlikely to exert any influence. Third, we assessed control ISIs to ensure that we observe a pathway-specific effect (Fig.3). Lastly, the position of the subjects in pre- and postmeasurement was identical so that for instance changes in muscle length did not bias the H-reflex response.
SOL H-Reflex Conditioning in Pre- and Postmeasurement The SOL H-reflex was conditioned by magnetic stimulation of the motor cortex (M1-conditioning) and by magnetic cervicomedullary stimulation (CMS-conditioning) in a random order during the same measurement (Fig.2). The H-reflex conditioning was in accordance with previous studies using M1- (Nielsen et al. 1993;Petersen et al. 1998;Taube et al. 2006,2007;Schubert et al. 2008) or CMS-condition-ing (Taube et al. 2011;Leukel et al. 2012). However, compared with the initial study introducing M1-conditioning (Nielsen et al. 1993), the stimulation intensity of the magnetic stimulus was higher (0.9 MT) so that the early facilitation (explained later on in detail) could be evoked in all subjects at rest.
Cervicomedullary and cortical stimuli were applied with different interstimulus intervals (ISIs in ms). In order to detect the early facili-tation, the ISIs for CMS-conditioning were−9, −8, −7, −6, −5, −4, and −3 ms whereas M1-conditioning involved the following ISIs: −5, −4, −3, −2, −1, 0, and +1 ms. Negative ISIs indicate that the peripheral nerve stimulation was applied before TMS (or cervicomedullary stimulation).
Ten trials were recorded at each ISI as well as for the control (uncon-ditioned) H-reflex in a randomized order (the ISIs were randomized as well as the type of conditioning stimulation: TMS over M1 or cervico-medullary stimulation). Peripheral nerve stimulation was applied with an intensity to evoke SOL H-reflexes of ∼20% of Mmax. The intensity of
the TMS pulses was subthreshold (0.9 MT). Cervicomedullary stimu-lation was also subthreshold but the exact level of stimustimu-lation intensity relative to MT could not be identified as 100% of the maximal stimu-lator output was not sufficient to elicit a response in the relaxed soleus muscle. Thus, the stimulator output was chosen to be constant at its maximal intensity (100%) throughout the experiment.
The conditioned H-reflexes were expressed as the percentage of the control H-reflexes in order to identify the so-called early facilitation (or “short-latency facilitation”) indicated by the first increase in the ampli-tude of the conditioned H-reflex (Fig.2). This early facilitation is con-sidered to be mediated via fast, presumably direct corticospinal pathways (Nielsen et al. 1993).
rTMS Intervention
During the rTMS intervention, stimuli were applied at 1 Hz for 20 min while subjects were sitting upright at rest. The stimulation intensity was set to 1.2 MT, as observations imply that the reduction in MEP size induced by 1-Hz stimulation is longer with longer train duration (Maeda et al. 2000) and at higher stimulation intensity (Fitzgerald et al. 2002). It was the aim to induce a relatively long-lasting suppression of the corticospinal excitability as the subsequent assessment by means of H-reflex conditioning took several minutes to accomplish. rTMS was applied in a similar setup as described above for both Experiment I and II.
Data Analysis and Statistics
In Experiment I, MEP and H/M recruitment curves were assessed in 9 subjects before and after rTMS. In order to allow comparison across subjects and over time, all evoked responses were normalized to the corresponding Mmax. Also stimulation intensities were normalized:
TMS stimulation intensities were normalized to the individual motor threshold (MT) at baseline established as the intensity that evoked MEP amplitudes >50μV in 3 of 5 trials. Peripheral nerve stimulation intensi-ties were normalized to the individual M-wave threshold at baseline established in a corresponding procedure. For each subject, the responses evoked at each stimulation intensity were averaged. Before statistical comparison, all datasets were tested for normal distribution by a Kolmogorov–Smirnov test. The resulting MEP and H-reflex recruit-ment curves were compared using a two-way repeated-measures ANOVA with TIME (4 levels: pre (baseline), post, 10 min post and 20 min post) and STIMULATION INTENSITY (7 levels: 0.9–1.5 × MT and M-wave threshold respectively) as factors. The obtained Mmax
responses were compared for an effect of TIME using a one-way repeated-measures ANOVA. Post hoc pairwise comparisons were performed as Bonferroni-corrected tests.
In Experiment II, the unconditioned (control) H-reflexes and the conditioned H-reflexes were also expressed as peak-to-peak ampli-tudes of the unrectified EMG. Ten conditioned H-reflexes were aver-aged for each ISI after both CMS- and M1-conditioning. Additionally, 10 control (unconditioned) H-reflexes were averaged. The control H-reflexes served as a reference for the conditioned H-reflexes. The in-traindividual mean of the conditioned H-reflex (at each ISI) was divided by the intraindividual mean of the unconditioned control H-reflex and ISI-curves after M1- and CMS-conditioning were plotted for each subject (a representative subject is displayed in Fig.2). As there is interindividual variability in the occurrence of the onset of the early facilitation (dependent on the subjects’ anthropometry, i.e., trunk and leg lengths and possibly due to differences in the nerve conduc-tion velocities), the early facilitaconduc-tion was determined in the premea-surement for each subject separately and compared with the amplitude of the early facilitation obtained in the postmeasurement using the same ISI. Thereby, the ISI indicating the individual early facilitation was defined as the first significant increase of the mean value of the conditioned H-reflex with respect to previous values (beginning at ISI −9 ms with CMS-conditioning and at ISI −5 ms with M1-conditioning) using nonparametric Wilcoxon tests (in line withTaube et al. 2011). In 3 subjects, there was no significant early facilitation after CMS-conditioning. In these subjects, the early facilitation was visually determined by the authors of the study. Furthermore, subsequent stat-istics were executed twice: one time including and a second time excluding these 3 subjects (indicated in the Result section; allfigures display the data of all subjects).
For the statistical analysis, the early facilitation and the ISI before (−1) and the ISI after this facilitation (+1) were taken into consider-ation. The effect of rTMS was evaluated using a two-way repeated-measures ANOVA with TIME and ISI as factors. The amount of early facilitation in the premeasurement of both M1- and CMS-conditioning was compared with the early facilitations obtained in the postmeasure-ment by means of Bonferroni-corrected two-sided paired Student’s t-tests after having tested that the present data followed a normal distri-bution (Kolmogorov–Smirnov test).
All variables were expressed as mean ± standard deviation (SD) unless indicated otherwise.
Differences were regarded significant at P < 0.05 for all tests. SPSS software 19.0 (SPSS®, Chicago, IL, USA) was used for the statistical
analysis.
Results
MEP Recruitment Curves
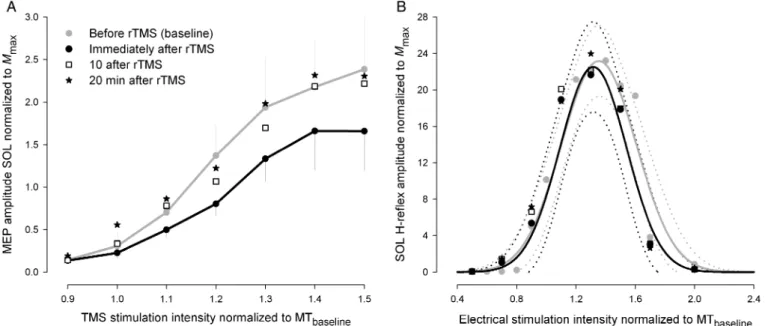
There was a main effect of TIME (
F
3,144= 4.4,
P = 0.014) and
a main effect of STIMULATION INTENSITY (
F
6,144= 10.4,
P < 0.001). Additionally, there was a significant TIME ×
STIMULATION INTENSITY interaction (
F
18,144= 2.528,
P =
0.038; see Fig.
1
A). Bonferroni post hoc pairwise comparisons
revealed that the evoked MEP amplitudes across all stimulation
intensities, were signi
ficantly lower immediately after rTMS
compared with pre (baseline) (
t = 2.883, P = 0.025). Further
tests of interactions between TIME and STIMULATION
INTEN-SITY demonstrated that MEP amplitudes were signi
ficantly
depressed immediately following rTMS compared with pre
(baseline) at the stimulation intensities 1.2 (
t = 2.776, P = 0.02),
1.3 (
t = 2.971, P = 0.011), 1.4 (t = 2.527, P = 0.039), and 1.5 (t =
3.562,
P = 0.002). Ten minutes following rTMS, MEP
ampli-tudes increased again with the only signi
ficant difference from
post-rTMS at 1.5 (
t = 2.731, P = 0.032) and no difference
com-pared with baseline measurements. Twenty minutes following
rTMS, MEP amplitudes were back at baseline levels.
H/M Recruitment Curves
For the H/M recruitment curves, there was a main effect of
STIMULATION INTENSITY (
F
8,192= 10.4,
P < 0.001) but not a
main effect of TIME (
F
3,192= 0.78,
P = 0.52). There was also
no signi
ficant STIMULATION INTENSITY × TIME interaction
(
F
24,192= 0.756,
P = 0.787; Fig.
1
B). Thus, there were no
changes in the H-re
flex amplitudes for different stimulation
in-tensities over time, and thus no signi
ficant differences in the
H-re
flex recruitment curves could be detected after rTMS
com-pared with the values before rTMS. There were also no
differ-ences in the evoked maximal compound potential
M
maxbetween recruitment curves obtained at baseline, immediately
following, 10, or 20 min after rTMS.
Figure 1. Results from Experiment I. (A) TMS stimulus-response curves obtained from SOL motor-evoked potentials evoked before, immediately after, 10, and 20 min after 20 min of 1-Hz rTMS at 1.2 MT. Stimulation intensities are normalized to the individual motor threshold and MEP amplitudes are normalized toMmax. Data are presented as group
mean ± SEM, *P < 0.05. (B) H-reflex recruitment curves obtained from SOL EMG at identical times. Data are presented as group mean. Recruitment curves are presented ± confidence bands.
Occurrence of the Early Facilitation After
M1-and CMS-Conditioning
When the H-re
flex was conditioned by M1 stimulation in
Experiment II, subjects displayed the early facilitation around
ISI
−3.5 ms (mean ISI for the onset of the early facilitation:
−3.54 ± 0.66 ms), whereas CMS-conditioning produced the
early facilitation roughly 4 ms earlier (mean ISI for the onset of
the early facilitation:
−7.46 ± 0.66 ms) (an example of 1 subject
is displayed in Fig.
2
C). These values are comparable with
those previously reported using the same technique (
Taube
et al. 2011
): M1-conditioning:
−3.69 ± 0.65 ms;
CMS-condition-ing:
−7.19 ± 0.59 ms. As the early facilitation was assessed
within the
first 1 ms with both M1- and CMS-conditioning, it is
believed to re
flect activity of direct, monosynaptic
corticosp-inal pathways (
Nielsen et al. 1993
,
1995
;
Nielsen and Petersen
1995a
,
1995b
;
Petersen et al. 1998
). In the following, the
results therefore mainly concentrate on this early facilitation
and other ISIs are only displayed as control ISIs in order to
show that rTMS did not in
fluence the properties of the
moto-neuron pool in response to the descending volleys in general.
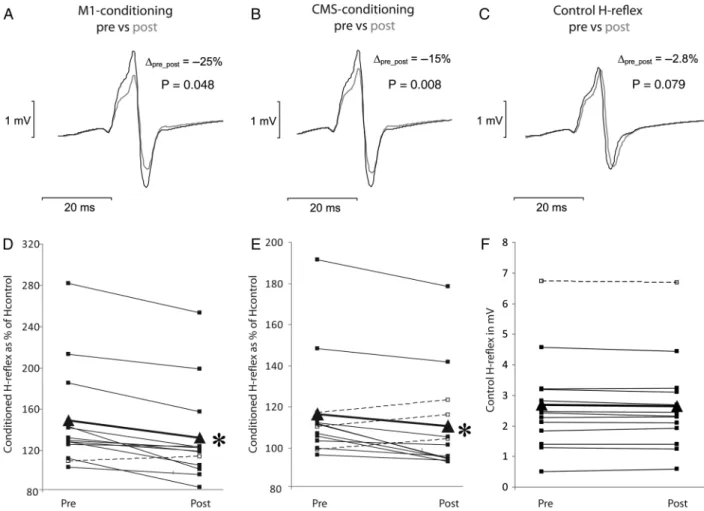
Changes in the Amplitude of the Early Facilitation
After rTMS
There was a signi
ficant TIME × INTERSTIMULUS INTERVAL
effect of rTMS for both M1- (
F
2,24= 6.23,
P = 0.006, Fig.
3
A)
and CMS-conditioning (all subjects:
F
2,24= 5.34,
P = 0.012,
Fig.
3
B; only subjects with significant early facilitation (n = 10):
F
2,18= 4.65,
P = 0.024). After the rTMS intervention, the early
facilitation obtained by M1-conditioning was signi
ficantly
reduced ( pre 149% vs. post 132%;
t = 4.64, P = 0.001; Fig.
4
A,
D). Similarly, the early facilitation was significantly suppressed
when tested with CMS-conditioning ( pre 117% vs. post 111%;
t = 2.64, P = 0.04; Fig.
4
B,E; only subjects with significant early
facilitation: pre 122% vs. post 114%;
t = 2.90, P = 0.035). When
comparing the effect of rTMS on the early facilitations,
M1-conditioning revealed a greater inhibitory effect than
CMS-conditioning (
t = 3.26, P = 0.007). The amplitudes of the
control H-re
flexes remained at 20% of M
maxin the
postmea-surement, and comparable values were obtained before and
after the rTMS intervention (Fig.
4
C,F).
Discussion
We have shown in this study that low-frequency rTMS
sup-pressed soleus MEP recruitment curves, but had no effect on
the H/M recruitment curves. This suggests that the depression
of the MEPs is not caused by changes in motoneuronal
excit-ability, but must be explained by changes in transmission
up-stream from the motoneurons. The rTMS-induced reduction in
the early facilitation of the H-re
flex evoked by both M1- and
Figure 2. Procedure of M1- and CMS-conditioning. (A) Schematic drawing of M1- and CMS-conditioning procedure. One coil was placed over M1 (M1) and the other over the cervicomedullary junction (CMS). Conditioning of the SOL H-reflex by magnetic stimulation of the motor cortex (M1-conditioning) and by magnetic cervicomedullary stimulation (CMS-conditioning) was applied in a random order during the same measurement. (B) Descending volleys after magnetic stimulation of the motor cortex (M1-cond.) and the cervicomedullary junction (CMS-cond.) are dispersed for some milliseconds. In contrast, the peripheral nerve stimulation (H-reflex) produces a short effect. The H-reflex can be shifted forward in relation to the descending volley so that it collides with the fast(est) fraction(s) of the descending corticospinal volley (early facilitation) or it can be shifted backward so that slower corticospinal pathways can be tested (late facilitation). In the present study, interstimulus intervals (ISIs) from−9 to +1 were tested; the later ISIs are only displayed to complete the picture. (C) H-reflex conditioning curves after M1- and CMS-conditioning. The same ISIs are displayed as in (B), and it can be seen that the early facilitation occurs between ISI−7 and ISI −2 followed by a late facilitation starting around ISI +5. The conditioned H-reflexes were expressed as percentage of the control (unconditioned) H-reflexes. The first positive deflection from the baseline (100%) was taken to indicate the start of the early facilitation. In most subjects, the early facilitation after CMS-conditioning started 3–4 ms earlier than the facilitation obtained with M1-conditioning due to the shorter travel distance. The magnitudes of the early facilitations were compared before and after 20-min rTMS.CMS-conditioning suggests that reduced ef
ficiency of the CM
synapse is a contributing factor to the MEP depression.
Corticospinal and Motoneuronal Excitability
One of the most extensively studied effects of rTMS is its in
flu-ence on corticospinal excitability indicated by augmented
MEPs after high-frequency rTMS and reduced MEPs after
low-frequency rTMS (
Pascual-Leone et al. 1994
;
Chen et al. 1997
;
Fitzgerald et al. 2006
), similar to what we observed here. TMS
(
Di Lazzaro et al. 2008
), PET (
Conchou et al. 2009
), and fMRI
studies (
Bestmann et al. 2003
) have indicated that changes in
cortical circuits contribute to these changes. However, rTMS is
likely to in
fluence not only cortical structures but also spinal
circuits. Indeed,
Valero-Cabré et al. (2001)
reported increased
flexor carpi radialis H-reflexes lasting 10 min following 1-Hz
rTMS while
Perez et al. (2005)
and
Berardelli et al. (1998)
found reduced H-re
flexes lasting around 1 s following 5-Hz
rTMS in the soleus muscle and forearm muscles, respectively.
In patients with multiple sclerosis, both
findings were
con-firmed: high-frequency rTMS inhibited H-reflex responses
whereas low-frequency rTMS facilitated the soleus H-re
flex
(
Centonze et al. 2007
). These observations indicate that
changes in corticospinal excitability observed following rTMS
may
—at least for a short period—be influenced by changes in
spinal circuits.
In Experiment I of the present study, we obtained H/M
re-cruitment curves before, immediately after as well as 10 and 20
min after rTMS with 1 Hz at 1.2 MT. In contrast to the
above-cited studies, the H/M recruitment curves remained unaltered at
any time. This may be related to the relatively long time needed
for testing different stimulation intensities in the present study,
and/or the stimulation intensity in general. However, as we
tested the whole range of the motoneuron pool, this
finding
suggests that suprathreshold low-frequency rTMS to the
M1-representation of the soleus muscle did not induce longer
lasting changes in the excitability of the motoneuron pool.
Con-sequently, the depression of the compound MEPs and the early
facilitation of the soleus H-re
flex elicited by M1- and
CMS-con-ditioning are unlikely to be caused by changes in motoneuronal
excitability but are more likely explained by changes in
trans-mission upstream from the motoneurons. This reasoning seems
even more likely taking into account the abovementioned
studies showing facilitated H-re
flex responses after
low-frequency rTMS (
Valero-Cabré et al. 2001
;
Centonze et al. 2007
).
If anything, we would have expected to
find facilitated H-reflex
responses, which would have blurred rather than strengthened
the suppressive effects obtained with the low-frequency rTMS
used in the present study.
Potential Changes in the Ef
ficiency of CM Synapses
The comparison of M1- and CMS-conditioning effects revealed
greater (
−17% vs. −6%) and more consistent (12 of 13 subjects
vs. 10 of 13 subjects) suppression after M1-conditioning. It is
however, not possible to quantitatively compare the effects
after M1- and CMS-conditioning as the stimulation intensity
could not be perfectly matched between conditions. Based on
previous studies showing modulation of cortical circuitries by
means of low-frequency rTMS (
Di Lazzaro et al. 2008
;
Conchou
et al. 2009
), resulting in decreased excitability of M1 (for
review
Fitzgerald et al. 2006
), it is most likely that intracortical
processes may have contributed to the depression of the early
facilitation evoked by M1-conditioning. However, they are
un-likely to also explain the depression of the early H-re
flex
facili-tation evoked by CMS-conditioning due to the subcortical site
of stimulation. As the motoneuron excitability remained
un-changed and the control H-re
flexes were matched in pre- and
postmeasurements (Fig.
4
F), altered corticospinal transmission
is likely to be involved. The early facilitation of the H-re
flex is
thought to be caused by activation of direct, monosynaptic
cor-ticospinal (CM) projections to the spinal motoneurons (
Nielsen
et al. 1993
;
Nielsen and Petersen 1995b
). This and the fact that
the ISIs before and after the early facilitation remained
un-changed (Fig.
3
A,B) indicate that the most likely site of the
depression is the synapse of the CM neuron on the spinal
mo-toneuron. This conclusion seems even more likely when
con-sidering the observation of direct recordings from the cervical
epidural space showing reduction of later I-waves but not of
the
first I-wave after 1-Hz rTMS (
Di Lazzaro et al. 2008
; for
summary see Fig. 8 in
Di Lazzaro et al. 2010
). As the
first
I-wave is separated by several milliseconds (
∼3–5 ms) from
later I-waves and as the early facilitation is in all likelihood
caused by activation of pathways transmitting this
first
exci-tation, not only the reduction of the early facilitation after
CMS-but also M1-conditioning may strongly rely on mechanisms
taking place at the CM synapses. Although corticospinal
sy-napses have been shown to be unaffected by presynaptic
Figure 3. Results from Experiment II. The effects of low-frequency rTMS on the earlyfacilitation obtained with CMS-conditioning (A) and M1-conditioning (B). The interstimulus interval (ISI) representing the early facilitation as well as the ISI before (−1) and the ISI after the early facilitation (+1) are displayed. rTMS significantly reduced the early facilitation of both M1- and CMS-conditioning whereas surrounding ISIs (−1 and +1) were not affected.
inhibition
elicited
by
stimulation
of
sensory
afferents
(
Rudomin et al. 1975
;
Nielsen and Petersen 1994
), this does
not rule out the possibility that other populations of
inter-neurons may inhibit the synapses of CM axons. It has also
been known for some time that CM synapses show
activity-dependent short-term plastic changes similar to other synapses
in the nervous system including potentiation at high
frequen-cies of activation and relative depression at longer intervals
between action potentials (
Porter and Lemon 1993
). More
recently, transmission from M1 neurons to
α-motoneurons has
been shown to change rapidly; possibly at least partly due to
changes in the ef
ficacy of CM synapses (
Davidson et al. 2007
).
Taylor and Martin (2009)
and
Leukel et al. (2012)
demon-strated that
“spinal PAS” consisting of repeated pairs of cortical
and peripheral nerve stimulation may alter corticospinal
trans-mission and suggested that changes in the ef
ficiency of CM
synapses could be one contributing factor. However, no
con-clusive evidence for this possibility was presented as previous
studies did not assess alterations at the time of early facilitation,
which re
flects, at least when it is assessed within the first
milli-second after its onset, activity in direct, monosynaptic
corti-cospinal projections (
Nielsen et al. 1993
,
1995
;
Nielsen and
Petersen 1995a
,
1995b
;
Petersen et al. 1998
).
The effects observed in the present study may also have
con-tributed to some recently observed behavioral consequences
fol-lowing application of rTMS. In this previous study, we used an
identical rTMS protocol to investigate interference effects during
motor learning. rTMS (1 Hz) was applied both at suprathreshold
and subthreshold intensities but only suprathreshold
rTMS-induced behavioral aftereffects (
Lundbye-Jensen et al. 2011
).
Therefore, it was suggested that the detrimental effect of
supra-threshold rTMS on motor learning may be caused at least in part
by subcortical or spinal mechanisms. Consequently, the
ob-served changes in corticospinal transmission in the present
study may at least partly explain these behavioral consequences
of suprathreshold rTMS. From a physiological point of view, the
finding of activity-dependent changes of CM synapses in
response to rTMS may extend and specify the previously made
observation that strong voluntary contractions depress the
corti-cospinal transmission (
Petersen et al. 2003
). In addition,
proto-cols using spinal PAS suggest that transmission cannot only be
downregulated, but also be upregulated (
Taylor and Martin
2009
;
Leukel et al. 2012
). Thus, synaptic plasticity within the
major pathway for voluntary contractions and more speci
fically
within the direct corticospinal projections may be used to adapt
transmission in an activity-dependent way.
Figure 4. Results from Experiment II. The effects of low-frequency rTMS on the early facilitation obtained with M1-conditioning (A and D) and CMS-conditioning (B and E). Furthermore, the size of the control H-reflex is displayed in (C) and (F) to illustrate that the control H-reflex was kept constant. The first row (A, B, C) displays data (averages of 10 traces) from one single representative subject, whereas the second row (D, E, F) shows the mean data of all participating subjects before (pre) and after (post) rTMS. Each dot represents the mean of 10 responses and the triangles (triangle) represent the overall mean. It can be seen that rTMS significantly reduced not only the cortically conditioned H-reflexes (A, D) but also the responses after CMS-conditioning (B, E). P-values in the first row refer to the data of the single subject whereas the stars (asterisk) in the second row indicate significant suppression of the mean (*P < 0.05).
The
finding of the present study highlights that
interven-tions in
fluencing the corticospinal pathway may lead to
changes in excitability, synaptic ef
ficacy and thus transmission
at different levels, cortical as well as spinal but importantly also
at the speci
fic level of the CM synapse. It is important that this
is acknowledged when interpreting both behavioral and
elec-trophysiological effects of different interventions. In the
present study, the effects were elicited by a low-frequency
su-prathreshold rTMS protocol, but it is indeed likely that other
electrophysiological neuroenhancement protocols and
behav-ioral interventions such as motor practice could also be
accompanied by changes at this level of the motor system.
Conclusion
In line with previous studies, the present study demonstrates
that low-frequency rTMS suppresses corticospinal excitability.
Whereas previous studies suggested that this effect relates to
changes at a cortical level, the present study demonstrates that
the effects of rTMS are not restricted to the motor cortex. Based
on the current observation of suppressed early facilitation after
cervicomedullary conditioning of the soleus H-re
flex, it can be
concluded that rTMS with suprathreshold intensity most likely
also in
fluences the synaptic efficiency of direct corticospinal
pathways projecting to spinal motoneurons.
Notes
We thank Axel Scherle and Florian Pfister for their technical support. Conflict of Interest: None declared.
References
Berardelli A, Inghilleri M, Rothwell JC, Romeo S, Curra A, Gilio F, Modugno N, Manfredi M. 1998. Facilitation of muscle evoked responses after repetitive cortical stimulation in man. Exp Brain Res. 122:79–84.
Bestmann S, Baudewig J, Siebner HR, Rothwell JC, Frahm J. 2003. Sub-threshold high-frequency TMS of human primary motor cortex modulates interconnected frontal motor areas as detected by inter-leaved fMRI-TMS. Neuroimage. 20:1685–1696.
Centonze D, Koch G, Versace V, Mori F, Rossi S, Brusa L, Grossi K, Torelli F, Prosperetti C, Cervellino A et al. 2007. Repetitive transcra-nial magnetic stimulation of the motor cortex ameliorates spasticity in multiple sclerosis. Neurology. 68:1045–1050.
Chen R, Classen J, Gerloff C, Celnik P, Wassermann EM, Hallett M, Cohen LG. 1997. Depression of motor cortex excitability by low-frequency transcranial magnetic stimulation. Neurology. 48: 1398–1403.
Conchou F, Loubinoux I, Castel-Lacanal E, Le TA, Gerdelat-Mas A, Faure-Marie N, Gros H, Thalamas C, Calvas F, Berry I et al. 2009. Neural substrates of low-frequency repetitive transcranial magnetic stimulation during movement in healthy subjects and acute stroke patients. A PET study. Hum Brain Mapp. 30:2542–2557.
Crone C, Hultborn H, Mazieres L, Morin C, Nielsen J, Pierrot-Deseilligny E. 1990. Sensitivity of monosynaptic test reflexes to facilitation and inhibition as a function of the test reflex size: a study in man and the cat. Exp Brain Res. 81:35–45.
Davidson AG, Chan V, O’Dell R, Schieber MH. 2007. Rapid changes in throughput from single motor cortex neurons to muscle activity. Science. 318:1934–1937.
Di Lazzaro V, Pilato F, Dileone M, Profice P, Oliviero A, Mazzone P, Insola A, Ranieri F, Tonali PA, Rothwell JC. 2008. Low-frequency repetitive transcranial magnetic stimulation suppresses specific excitatory circuits in the human motor cortex. J Physiol. 586: 4481–4487.
Di Lazzaro V, Profice P, Pilato F, Dileone M, Oliviero A, Ziemann U. 2010. The effects of motor cortex rTMS on corticospinal descending activity. Clin Neurophysiol. 121:464–473.
Fitzgerald PB, Brown TL, Daskalakis ZJ, Chen R, Kulkarni J. 2002. Intensity-dependent effects of 1 Hz rTMS on human corticospinal excitability. Clin Neurophysiol. 113:1136–1141.
Fitzgerald PB, Fountain S, Daskalakis ZJ. 2006. A comprehensive review of the effects of rTMS on motor cortical excitability and inhi-bition. Clin Neurophysiol. 117:2584–2596.
Funke K, Benali A. 2011. Modulation of cortical inhibition by rTMS—findings obtained from animal models. J Physiol. 589: 4423–4435.
Hallett M. 2007. Transcranial magnetic stimulation: a primer. Neuron. 55:187–199.
Heckman CJ, Mottram C, Quinlan K, Theiss R, Schuster J. 2009. Moto-neuron excitability: the importance of neuromodulatory inputs. Clin Neurophysiol. 120:2040–2054.
Kammer T, Beck S, Thielscher A, Laubis-Herrmann U, Topka H. 2001. Motor thresholds in humans: a transcranial magnetic stimulation study comparing different pulse waveforms, current directions and stimulator types. Clin Neurophysiol. 112:250–258.
Leukel C, Taube W, Beck S, Schubert M. 2012. Pathway-specific plas-ticity in the human spinal cord. Eur J Neurosci. 35:1622–1629. Lundbye-Jensen J, Petersen TH, Rothwell JC, Nielsen JB. 2011.
Interfer-ence in ballistic motor learning: specificity and role of sensory error signals. PLoS One. 6:e17451.
Maeda F, Keenan JP, Tormos JM, Topka H, Pascual-Leone A. 2000. Interindividual variability of the modulatory effects of repetitive transcranial magnetic stimulation on cortical excitability. Exp Brain Res. 133:425–430.
Nielsen J, Petersen N. 1994. Is presynaptic inhibition distributed to cor-ticospinalfibres in man? J Physiol. 477:47–58.
Nielsen J, Petersen N. 1995a. Changes in the effect of magnetic brain stimulation accompanying voluntary dynamic contraction in man. J Physiol. 484:777–789.
Nielsen J, Petersen N. 1995b. Evidence favouring different descending pathways to soleus motoneurones activated by magnetic brain stimulation in man. J Physiol. 486:779–788.
Nielsen J, Petersen N, Ballegaard M. 1995. Latency of effects evoked by electrical and magnetic brain stimulation in lower limb motoneur-ones in man. J Physiol. 484:791–802.
Nielsen J, Petersen N, Deuschl G, Ballegaard M. 1993. Task-related changes in the effect of magnetic brain stimulation on spinal neur-ones in man. J Physiol. 471:223–243.
Nitsche MA, Paulus W. 2000. Excitability changes induced in the human motor cortex by weak transcranial direct current stimu-lation. J Physiol. 527(Pt 3):633–639.
Oya T, Hoffman BW, Cresswell AG. 2008. Corticospinal-evoked responses in lower limb muscles during voluntary contractions at varying strengths. J Appl Physiol. 105:1527–1532.
Pascual-Leone A, Valls-Sole J, Wassermann EM, Hallett M. 1994. Responses to rapid-rate transcranial magnetic stimulation of the human motor cortex. Brain. 117(Pt 4):847–858.
Perez MA, Lungholt BK, Nielsen JB. 2005. Short-term adaptations in spinal cord circuits evoked by repetitive transcranial magnetic stimulation: possible underlying mechanisms. Exp Brain Res. 162:202–212.
Petersen N, Christensen LOD, Nielsen JB. 1998. The effect of transcra-nial magnetic stimulation on the soleus H reflex during human walking. J Physiol. 513:599–610.
Petersen NT, Taylor JL, Butler JE, Gandevia SC. 2003. Depression of activity in the corticospinal pathway during human motor behavior after strong voluntary contractions. J Neurosci. 23: 7974–7980.
Porter R, Lemon RN. 1993. Corticospinal function and voluntary move-ment. Monographs of the Physiological Society, No. 45. New York: Oxford University Press.
Ridding MC, Brouwer B, Miles TS, Pitcher JB, Thompson PD. 2000. Changes in muscle responses to stimulation of the motor cortex induced by peripheral nerve stimulation in human subjects. Exp Brain Res. 131:135–143.
Rudomin P, Nunez R, Madrid J. 1975. Modulation of synaptic effective-ness of Ia and descendingfibers in cat spinal cord. J Neurophysiol. 38:1181–1195.
Schubert M, Beck S, Taube W, Amtage F, Faist M, Gruber M. 2008. Balance training and ballistic strength training are associated with task-specific corticospinal adaptations. Eur J Neurosci. 27:2007–2018.
Sommer M, Alfaro A, Rummel M, Speck S, Lang N, Tings T, Paulus W. 2006. Half sine, monophasic and biphasic transcranial magnetic stimulation of the human motor cortex. Clin Neurophysiol. 117:838–844.
Stefan K, Kunesch E, Cohen LG, Benecke R, Classen J. 2000. Induction of plasticity in the human motor cortex by paired associative stimu-lation. Brain. 123(Pt 3):572–584.
Taube W, Gruber M, Beck S, Faist M, Gollhofer A, Schubert M. 2007. Cortical and spinal adaptations induced by balance training: corre-lation between stance stability and corticospinal activation. Acta Physiol (Oxf ). 189:347–358.
Taube W, Lundbye-Jensen J, Schubert M, Gollhofer A, Leukel C. 2011. Evidence that the cortical motor command for the initiation of
dynamic plantarflexion consists of excitation followed by inhi-bition. PLoS One. 6:e25657.
Taube W, Schubert M, Gruber M, Beck S, Faist M, Gollhofer A. 2006. Direct corticospinal pathways contribute to neuromuscular control of perturbed stance. J Appl Physiol. 101:420–429.
Taylor JL. 2006. Stimulation at the cervicomedullary junction in human subjects. J Electromyogr Kinesiol. 16:215–223.
Taylor JL, Martin PG. 2009. Voluntary motor output is altered by spike-timing-dependent changes in the human corticospinal pathway. J Neurosci. 29:11708–11716.
Tsuji T, Rothwell JC. 2002. Long lasting effects of rTMS and associated peripheral sensory input on MEPs, SEPs and transcortical reflex excitability in humans. J Physiol. 540:367–376.
Ugawa Y, Uesaka Y, Terao Y, Hanajima R, Kanazawa I. 1994. Magnetic stimulation of corticospinal pathways at the foramen magnum level in humans. Ann Neurol. 36:618–624.
Valero-Cabré A, Oliveri M, Gangitano M, Pascual-Leone A. 2001. Modu-lation of spinal cord excitability by subthreshold repetitive transcra-nial magnetic stimulation of the primary motor cortex in humans. Neuroreport. 12:3845–3848.