The Relation between Spatial Thinking and Proportional Reasoning in Preschoolers Wenke Möhringa, Nora S. Newcombea, and Andrea Frickb
NOTICE: this is the author's version of a work that was accepted for publication in Journal of Experimental Child Psychology. Changes resulting from the publishing process, such as editing, corrections, structural formatting, and other quality control mechanisms may not be reflected in this document. This article may be
used for non-commercial purposes in accordance with the journals conditions. A definitive version is published as:
Möhring, W., Newcombe, N. S., & Frick, A. (2015). The Relation between spatial thinking and proportional reasoning in preschoolers. Journal of Experimental Child Psychology, 132, 213-220. DOI:
10.1016/j.jecp.2015.01.005
Corresponding Address: [email protected]
a Temple University, Department of Psychology, Weiss Hall 318, 1701 North 13th Street, Philadelphia, PA 19122-6085, United States. Email: [email protected];
b University of Fribourg, Department of Psychology, Rue P.A. de Faucigny 2, 1700 Fribourg, Switzerland. Email: [email protected]
Author Note
This research was supported by research grants from the US National Science
Science Foundation # PP00P1_150486. We are grateful to Kizzann Shana Ramsook and Nate George for their help with data collection.
Abstract
Previous research has indicated a close link between spatial and mathematical
thinking. However, what shared processes account for this link? In this study, we focused on the spatial skill of map reading and the mathematical skill of proportional reasoning and investigated whether scaling, or the ability to relate information in different-sized
representations, is a shared process. Scaling was experimentally manipulated in both tasks. In the map task, 4- and 5-year-olds (N = 50) were asked to point to the same position shown in a map in a larger referent space on a touch screen. The sizes of the maps were varied
systematically, such that some trials required scaling and some did not (i.e., the map had the same size as the referent space). In the proportional reasoning task, children were presented with different relative amounts of juice and water and asked to estimate each mixture on a rating scale. Again, some trials required scaling but others could be solved by directly mapping the proportional components onto the rating scale. Children’s absolute errors in locating targets in the map task were closely related to their performance in the proportional reasoning task, even after controlling for age and verbal intelligence. Crucially, this was only true for trials that required scaling, whereas performance on non-scaled trials was not related. These results shed light on the mechanisms involved in the close connection between spatial and mathematical thinking early in life.
Keywords: Proportional reasoning, Spatial Cognition, Map use, Scaling, Cognitive Development
The Relation between Spatial Thinking and Proportional Reasoning in Preschoolers Previous studies have indicated that spatial and mathematical reasoning are closely linked (e.g., Hegarty & Kozhevnikov, 1999; Rheukala, 2001; for a review, Mix & Cheng, 2012). However, it is largely unknown what shared processes account for this relation. One potential link connecting certain types of spatial and mathematical reasoning may involve scaling — the ability to map different-sized representations onto each other by mentally transforming their extent.
Many spatial tasks involve scaling. For instance, navigation often requires relating distance information on a map to a larger space. Mathematical tasks such as proportional reasoning also require understanding that different proportions can have the same value (e.g., 1/3 = 2/6; Boyer & Levine, 2012). Consequently, understanding how different sized
magnitudes relate to each other might account for some commonalities between particular spatial and mathematical skills. The present study aimed to investigate a) whether
preschooler’s spatial localization skills and proportional reasoning are related, and b) whether this relation differs when scaling is or is not required.
Studies investigating children’s map use in spatial search tasks have shown that preschoolers have great difficulties (Liben & Yekel, 1996) and their accuracy to locate targets develops considerably (Frick & Newcombe, 2012; Vasilyeva & Huttenlocher, 2004). However, if task requirements are low, even 3-year-olds succeed in using metric information from small-scale maps (Huttenlocher, Newcombe, & Vasilyeva, 1999). Children and adults seem to solve such tasks by mentally transforming spatial information presented in maps to the size of the referent space (Möhring, Newcombe, & Frick, 2014), as indicated by linear increases in response times and errors with larger scaling factors. Such linear response time patterns have typically been taken as indicators of mental transformation strategies in mental imagery research (Shepard & Metzler, 1971; Kosslyn, 1975).
Studies on the development of early proportional reasoning show heterogeneous results. On the one hand, 5-year-olds can successfully rate probabilities of events on a continuous scale (Schlottmann, 2001) and 3- to 4-year-olds can match proportions across substances (e.g., half a pizza equals half a chocolate bar; Singer-Freeman & Goswami, 2001). On the other hand, same-aged children had difficulties finding the matching proportion between two alternatives (Boyer & Levine, 2012; Spinillo & Bryant, 1991). These studies suggest early proportional reasoning abilities; however, this ability is not fully developed and individual variance is still large. Therefore, preschool age may be ideal to investigate the relationship between proportional and spatial reasoning, as individual variance in both abilities should be large, and shared variance can be optimally detected.
The proportional reasoning task in the present study presented continuous amounts of cherry juice and water, based on findings that children are more successful when reasoning about proportions presented with continuous amounts as opposed to discrete amounts that may elicit counting strategies (Boyer, Levine, & Huttenlocher, 2008; Spinillo & Bryant, 1999). Other studies showed that children succeed earlier when using a rating procedure with a continuous response scale (Schlottmann, 2001). Thus, children in the present task were asked to indicate the cherry taste of different mixtures on a rating scale. Importantly, the design involved trials that required scaling and trials in which the proportional components could be mapped directly onto the rating scale.
Preschooler’s spatial localization was measured in a search task using a touch screen. Children saw maps showing a target and were asked to point to the same location in a larger referent space. Again, the ratio between the size of the maps and the referent was varied systematically, such that some trials required scaling and some did not (i.e., maps had the same size as the referent space).
We expected a significant correlation between children’s proportional reasoning and spatial localizations. In addition, if scaling is an underlying process, we expected a relation only for scaled trials, but not for non-scaled trials. Furthermore, based on literature on mental imagery and spatial scaling (Kosslyn, 1975; Möhring et al., 2014; Shepard & Metzler, 1971), response times and errors in both tasks were expected to increase linearly with increasing scaling factors, if children used a mental transformation strategy. Finally, to control for the possibility that the present findings were due to general differences in intelligence, a subgroup of children completed an additional task that assessed verbal skills.
Method Participants
Twenty-five 4-year-olds (Mage = 53 months, range: 48-59 months; 13 girls) and 25
5-year-olds (Mage = 65 months, range: 60-71 months; 13 girls) participated in the present study.
Two additional children were excluded from analyses: one child did not finish the tasks and one child did not follow the instructions. Children were predominantly Caucasian, from middle-class backgrounds, and lived in suburban areas of a large U.S. city.
Administered Tasks
Children completed the spatial localizations task first, followed by the proportional reasoning task. Task order was not counterbalanced to keep conditions equal for all children, as we aimed to test for correlations between the tasks, thus focusing on individual
differences, rather than comparing children’s absolute levels of performance in the two tasks. The vocabulary test was administered on a different day.
Spatial Localization Task. Children were told a story about a farmer whose chickens
hid eggs in the fields of a farm, and they were asked to help the farmer find the eggs. Stimuli were presented on a touch screen monitor (19” Elo TouchSystems) using Cedrus Superlab 4.5 software. Trials began with a blue fingerprint on a white background, positioned in the
lower part of the screen. Upon touching this fingerprint, an empty green referent space
appeared above the fingerprint, and a map showing a white egg (i.e., the target) appeared next to it. Children were asked to point to the same position in the field. In four practice trials with targets located in the center of the maps, children received feedback (a smiling vs. frowning face). In subsequent test trials, no feedback was given. Seven target locations were either distributed along two dimensions in a rectangle, or along one dimension in a circle (see Figure 1A). Map sizes changed according to seven scaling factors (1:4, 1:2.6; 1:2, 1:1.6; 1:1.3; 1:1.14, 1:1). These within-participant variables were combined in a full factorial
design, amounting to 98 trials (84 scaled, 14 non-scaled trials). The rectangular referent space was 18 cm high x 22 cm wide, and maps ranged from 4.5 cm x 5.5 cm (1:4) to 18 cm x 22 cm (1:1). The circular space measured 22 cm in diameter, and maps ranged from 5.5 cm (1:4) to 22 cm (1:1). The different sized maps were centered on the same position to keep the average distance of the eggs to the referent space constant. Target locations and scaling factors were presented in random order. Order of target distribution (one-dimensional vs. two-dimensional first), instruction order (“respond quickly and accurately” vs. “accurately and quickly”), and map location (left vs. right of the referent space) was counterbalanced between participants. Response times and response locations in x- and y-coordinates were measured. If children did not respond within 10 s the trial was repeated. The task took about 20-30 minutes.
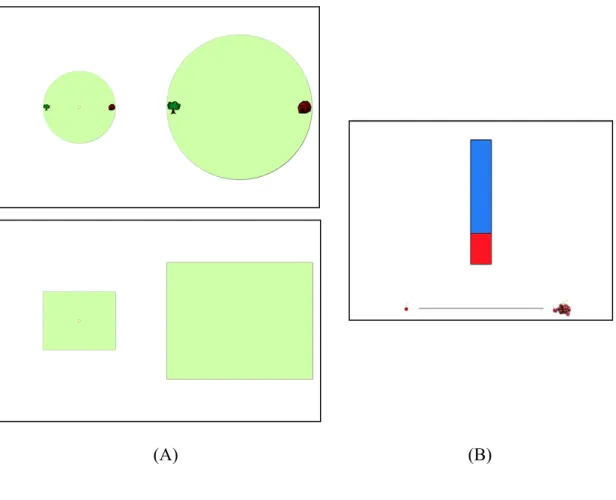
(A) (B)
Figure 1. (A) Examples of the entire touch-screen displays for a one-dimensional and a
two-dimensional target distribution in the spatial localization task (scaling factor 1:2). (B) Example of a cherry juice and water mixture (presenting a proportion of 6 units of juice vs. 24 units of total amount) in the proportional reasoning task (scaling factor 1:1).
Proportional Reasoning Task. To make the tasks diverse and keep children motivated,
this task was presented on letter-sized white paper. Children heard a story about a bear who mixes cherry juice with water. The experimenter explained that cherry juice was made of cherries, sweet, and red. Then, children were presented with combinations of red and blue rectangles representing cherry juice and water that were 2 cm wide and of varying length (see Figure 1B). Children were asked to estimate the cherry taste of each mixture on a horizontal line (12 cm) that was presented below. A single cherry to the left of the scale indicated a
weak cherry taste; a heap of cherries to the right of the scale indicated a strong cherry taste. On the first instruction trial, presenting 28 units of juice out of 30 units total amount (28/30), the experimenter explained the anchors of the scale, and positioned a rubber peg correctly on the scale. In the second trial (2/30), the child was asked to place the peg and was given corrective feedback. The third trial (22/30) aimed to further familiarize children with the task and to prevent them from only using the end positions of the scale. Children did not receive feedback on subsequent test trials, in which four levels of juice (3, 4, 5, 6 units) and total amount (6, 12, 18, 24 units) were combined in a full factorial design. These 16 combinations were blocked and presented twice, amounting to 32 trials (24 scaled, 8 non-scaled trials). Two quasi-random trial orders that avoided direct repetitions of factor levels were
counterbalanced between participants. The design involved four scaling factors, because the total amounts ranged from 6 to 24 units and had to be mapped onto a rating scale of 24 units (12 cm). Therefore, children had to either scale the total amount (by a factor of 4, 2, or 1.33) or directly map it onto a rating scale (factor of 1). The experimenter marked the placement of the peg on the pages for later measurement. The task took about 10-15 minutes.
Picture Vocabulary Test. A subgroup of 20 children also completed the Receptive
Vocabulary subtest of the Wechsler Preschool and Primary Scale of Intelligence as a measure of verbal intelligence (Wechsler, 2012). Children saw four pictures of objects and were asked to point to the picture that matched a spoken word. Children continued until the task was finished or three consecutive trials were answered incorrectly. Scores were calculated as the number of correct trials with a maximum of 31.
Results Spatial Localization Task Performance
Based on children’s responses on the x- and y-axis, we calculated the absolute deviations from targets on each trial. Examination of these deviations showed that some
children produced extreme errors by responding on the wrong side of the referent space. To see whether the number of such left-right reversal errors was influenced by scaling factor, an ANOVA with scaling factor (1:4 to 1:1.14) as a within-participant variable, and age (4 vs. 5 years) as a between-participants variable was calculated. This ANOVA revealed a significant age effect, F(1, 48) = 20.45, p < .001, η2 = .30, because 4-year-olds (M = 25.9%) committed more reversals than 5-year-olds (M = 12.9%), but no other effects (all Fs < 1.93, ps > .09). Furthermore, the number of reversals did not differ between scaled (M = 19.4%) and non-scaled trials (M = 20.0%), t(49) = -0.56, p > .05.
As reversal errors did not seem to systematically interact with scaling factors, we gave children credit for these half-correct solutions. Thus, in accordance with previous research (Huttenlocher, Newcombe, & Sandberg, 1994, Möhring et al., 2014), responses were “folded” along the midline such that children’s absolute deviations from the targets were considered independently of whether they were given to the left or right of the middle. Even though this procedure might have slightly overestimated young children’s performance, we prioritized reducing error variance, as we aimed to investigate the correlation with
proportional reasoning, and children’s absolute performance levels were of secondary importance.
Using folded errors on scaled trials of the localization task, an ANOVA was calculated, with scaling factor (6) as within-participant variable and age (2), sex (2), map location (left vs. right), instruction order (quickly vs. accurately first), and order of target distribution (one-dimensional vs. two-dimensional first) as between-participants variables. The ANOVA yielded a significant effect of scaling factor, F(5, 100) = 4.35, p < .001, η2 =
.18, that was best explained by a linear function, F(1, 20) = 18.28, p < .001, η2 = .481. In addition, scaling factor interacted with map location, F(5, 100) = 2.96, p < .05, η2 = .13, and with order of target distribution and sex, F(5, 100) = 2.36, p < .05, η2 = .11. However, follow-up pairwise comparisons (Bonferroni-corrected here and throughout) revealed no significant differences between map locations for any of the scaling factors (all ps > .05). Additionally, there was a significant effect of age, F(1, 20) = 6.81, p < .05, η2 = .25, due to 5-year-olds outperforming 4-year-olds (see Table 1). There were no further significant effects (all Fs < 1.99, ps > .08), except of an interaction of sex, age, map location, and order of target distribution that was hard to interpret. An analogue ANOVA with response times as
dependent variable revealed a significant effect of scaling factor only, F(5, 100) = 27.81, p < .001, η2 = .58, that was best explained by a linear function, F(1, 20) = 104.64, p < .001, η2 = .84, but no further effects (all Fs < 2.67, ps > .11).
1 Children may have made more errors on trials showing the smallest maps (i.e., scaling factor: 1:4) because
they struggled to differentiate the targets. To investigate this possibility, we ran a separate ANOVA for this scaling factor, with horizontal errors as dependent variable, target distributions (one-dimensional vs. two-dimensional) as within-participant variable and age as a between-participants variable. This revealed a
significant effect of location, F(6, 288) = 62.28, p < .001, η2 = .57, qualified by significant interactions between
location and target distribution, F(6, 288) = 3.56, p < .01, η2 = .08, and between location and age, F(6, 288) =
4.39, p < .001, η2 = .08. There were no further significant results (all Fs < 1.69, ps > .12). Mean responses
showed that children preserved the relative spatial order for the one-dimensional distribution and made only one adjacent switch in the two-dimensional distribution. Children of both ages kept the relative orders but differed in their slopes.
Table 1
Mean absolute errors (in cm) in the spatial localization task (folded errors) and the
proportional reasoning task (ipsatized errors) for scaled vs. non-scaled trials per age group
Four-year-olds Five-year-olds
Mean (SD) range Mean (SD) range
Spatial localization Scaled trials 3.30 (0.99) 1.69 - 5.38 2.29 (0.43) 1.55 - 3.18 Non-scaled trials 3.27 (1.07) 1.65 - 5.69 2.22 (0.43) 1.58 - 2.95 Proportional reasoning Scaled trials 0.94 (0.28) 0.32 - 1.47 0.69 (0.35) 0.22 - 1.54 Non-scaled trials 0.83 (0.34) 0.25 - 1.47 0.62 (0.37) 0.19 - 1.59
An ANOVA for the non-scaled trials, testing the effects of the same
between-participants variables on children’s folded errors, revealed a significant age effect, F(1, 49) = 7.15, p < .05, η2 = .26, because 5-year-olds outperformed 4-year-olds (see Table 1). There were no further effects except for an interaction of sex, age, map location, and order of target distribution that was hard to interpret (all Fs < 2.36, ps > .14). An analogous ANOVA with response times yielded a significant interaction between age, map location, and instruction order, F(1, 20) = 9.41, p < .01, η2 = .32, that seemed rather arbitrary, but no further results (all Fs < 3.62, ps > .07).
Proportional Reasoning Task Performance
An examination of mean absolute deviations from the correct proportions revealed large variance in children’s accuracy to rate proportions (range of 0.52 – 6.29 cm).
deviations of less than 2 cm, with 5 of these (10%) showing deviations of less than 1 cm. A reason for the large individual variance may have been that individual children used the rating scale differently, from using a small range to the entire scale. To account for such individual usage, responses were standardized by subtracting each child’s individual mean from all of his/her responses and dividing these values by the child’s individual standard deviation. This process of within-participant standardization is typically used to correct for individual tendencies to shift responses to one end of the rating scale (ipsatization, Hicks, 1970). Then, these ipsatized responses were subtracted from the correct (ipsatized) target values, yielding a measure for the absolute deviations from the correct proportions
(subsequently referred to as absolute ipsatized errors). Target values were standardized in the same way, by creating a dummy case with normative target values (thus simulating a
hypothetical “perfect” participant). Then, the “individual” mean and standard deviation was computed for this dummy case, and values were ipsatized analogously to the values of each individual child.
Using these absolute ipsatized errors on scaled trials of the proportional reasoning task, an ANOVA was calculated, with scaling factor (3) as within-participant variable and age (2), sex (2), and order (2) as between-participants variables. The ANOVA yielded a significant effect of scaling factor, F(2, 84) = 52.89, p < .001, η2 = .56, that was best explained by a linear function, F(1, 42) = 67.71, p < .001, η2 = .62. In addition, there was a significant age effect, F(1, 42) = 6.86, p < .05, η2 = .14, because 5-year-olds responded more accurately than 4-year-olds (see Table 1), but no further effects (all Fs < 3.12, ps > .05). The same ANOVA with absolute ipsatized errors on non-scaled trials yielded no significant effects of between-participants variables (all Fs < 2.49, ps > .13).
To investigate relations between children’s accuracy in locating targets and rating proportions, Spearman2 correlations were calculated between averaged folded errors in the spatial localization task, and absolute ipsatized errors in the proportional reasoning task. Overall, these performance scores were significantly correlated (r = .51, p < .001). Moreover, the subgroup of 20 children who additionally completed the vocabulary test also showed a significant correlation between performance in the two tasks (r = .66, p < .01), and this correlation remained significant after controlling for verbal intelligence and age (r = .64, p < .01). Thus, children who showed more normative estimations on the proportional reasoning task performed more accurately on the localization task, regardless of age and intelligence.
To investigate whether the correlation between proportional reasoning and spatial localization skills was restricted to scaled trials, separate performance scores were calculated for scaled and non-scaled trials. For scaled trials, this correlation was highly significant after controlling for age in the total sample, r = .37, p < .001, and after controlling for age and verbal intelligence in the subsample, r = .64, p < .01. By contrast, for non-scaled trials there was no correlation between the two tasks, neither after controlling for age, r = .21, p = .16, nor after controlling for age and verbal intelligence in the subsample, r = .33, p = .18. To account for the possibility that performance scores on scaled trials could have correlated only because they were averaged across a larger number of trials, as compared to non-scaled trials, additional analyses were calculated with performance scores that were based on only one medium-sized scaling factor (1:2). These analyses confirmed that the correlation between proportional reasoning and spatial localization scores was significant for scaled trials (1:2) after controlling for age in the total sample, r = .32, p < .05, and after controlling for age and verbal intelligence in the subsample, r = .51, p < .05.
2 Spearman correlations were chosen because absolute errors in the localizations task were not normally
Discussion
The present experiment investigated preschooler’s ability to locate targets and to reason about proportions. Our results support previous findings (Schlottmann, 2001; Singer-Freeman & Goswami, 2001) indicating that proportional reasoning is possible early in life when using an intuitive task; nevertheless 5-year-olds were more accurate than 4-year-olds in rating proportions. In line with previous results (Frick & Newcombe, 2012), a similar age effect was found for children’s ability to locate targets presented on maps. The present results also replicated previous findings (Möhring et al., 2014) that response times and errors in locating targets increased linearly with increasing scaling factors, indicating that children applied a mental transformation strategy. In the present proportional reasoning task, children showed a similar linear increase with increasing scaling factors (cf. Boyer & Levine, 2012), indicating that also here children mentally transformed represented magnitudes.
Importantly, children who were better at estimating the concentration of the mixture in the proportional reasoning task were also more accurate at locating the target positions, even after controlling for age and verbal intelligence. This result indicates that proportional reasoning and the ability to use spatial information provided by maps are closely related abilities. This finding extends research about the connection between spatial and
mathematical knowledge (Mix & Cheng, 2012). Crucially, children’s ability to scale magnitudes may be a common mechanism, given that performance was correlated between tasks on trials that required scaling, but not on non-scaled trials. This also rules out that the correlation may have been due to perceptual similarities between the tasks, or to the fact that both tasks contained a spatial component. If this were the case, one could expect significant correlations independent of scaling.
Taken together, the present results indicate a close connection between spatial and proportional thinking early in life, with scaling likely being an important underlying process.
Beyond improving our understanding of the shared processes of spatial and proportional reasoning, the present findings have practical implications for academic success, considering that recent cross-sectional studies (Möhring, Newcombe, Levine, & Frick, in press) found connections between older children’s proportional reasoning (using the same task) and their ability to calculate with numerical fractions. These results indicated that children with better intuitive understanding of non-symbolic proportions also knew more about numeric fractions. Consequently, one could assume that estimating and comparing magnitudes inherent in scaling might also be a basis for children’s later fraction knowledge. So far, evidence is only correlational and the causal relations between these abilities remain unclear. Future studies using training and longitudinal designs may help to clarify the role of scaling for proportional reasoning and later fraction knowledge. The present study provides a first step in exploring the underlying mechanisms between spatial and proportional reasoning. It shows that proportional reasoning is possible at a young age and points to the possibility that early spatial and proportional skills could be harnessed to foster an advanced understanding of proportions later in life.
References
Boyer, T. W., & Levine, S. C. (2012). Child proportional scaling: Is 1/3 = 2/6 = 3/9 = 4/12?
Journal of Experimental Child Psychology, 111, 516-533.
Boyer, T. W., Levine, S. C., & Huttenlocher, J. (2008). Development of proportional reasoning: Where young children go wrong. Developmental Psychology, 44, 1478-1490.
Frick, A., & Newcombe, N. S. (2012). Getting the big picture: Development of spatial scaling abilities. Cognitive Development, 27, 270-282.
Hegarty, M., & Kozhevnikov, M. (1999). Types of visual–spatial representations and mathematical problem solving. Journal of Educational Psychology, 91, 684–689. Hicks, L. E. (1970). Some properties of ipsative, normative, and forced-choice normative
measures. Psychological Bulletin, 74, 167-184.
Huttenlocher, J., Newcombe, N., & Sandberg, E. (1994). The coding of spatial location in young children. Cognitive Psychology, 27, 115-147.
Huttenlocher, J., Newcombe, N. S., & Vasilyeva, M. (1999). Spatial scaling in young children. Psychological Science, 10, 393-398.
Kosslyn, S. M. (1975). Information representation in visual images. Cognitive Psychology, 7, 341-370.
Liben, L. S., & Yekel, C. A. (1996). Preschoolers’ understanding of plan and oblique maps: The role of geometric and representational correspondence. Child Development, 67, 2780-2796.
Mix, K. S., & Cheng, Y. L. (2012). The relation between space and math: Developmental and educational implications. Advances in Child Development and Behavior, 42, 197-243.
Möhring, W., Newcombe, N. S., & Frick, A. (2014). Zooming in on spatial scaling: Preschool children and adults use mental transformations to scale spaces.
Developmental Psychology, 50, 1614-1619.
Möhring, W., Newcombe, N. S., Levine, S. C., & Frick, A. (in press). Spatial proportional reasoning is associated with formal knowledge about fractions. Journal of Cognition
and Development.
Reuhkala, M. (2001). Mathematical skills in ninth-graders: Relationship with visuo-spatial abilities and working memory. Educational Psychology, 21, 387–399.
Schlottmann, A. (2001). Children’s probability intuitions: Understanding the expected value of complex gambles. Child Development, 72, 103-122.
Shepard, R. N., & Metzler, J. (1971). Mental rotation of three-dimensional objects. Science,
171, 701-703.
Singer-Freeman, K. E., & Goswami, U. (2001). Does half a pizza equal half a box of chocolates? Proportional matching in an analogy task. Cognitive Development, 16, 811-829.
Spinillo, A. G., & Bryant, P. (1991). Children’s proportional judgments: The importance of “half.” Child Development, 62, 427-440.
Spinillo, A. G., & Bryant, P. (1999). Proportional reasoning in young children: Part–part comparisons about continuous and discontinuous quantity. Mathematical Cognition,
5, 181-197.
Vasilyeva, M., & Huttenlocher, J. (2004). Early development of scaling ability.
Developmental Psychology, 40, 682-690.
Wechsler, D. (2012). Wechsler preschool and primary scale of intelligence (4th ed.). Bloomington, MN: Pearson.