HAL Id: hal-02470576
https://hal.archives-ouvertes.fr/hal-02470576
Submitted on 15 Jun 2021HAL is a multi-disciplinary open access
archive for the deposit and dissemination of sci-entific research documents, whether they are pub-lished or not. The documents may come from teaching and research institutions in France or abroad, or from public or private research centers.
L’archive ouverte pluridisciplinaire HAL, est destinée au dépôt et à la diffusion de documents scientifiques de niveau recherche, publiés ou non, émanant des établissements d’enseignement et de recherche français ou étrangers, des laboratoires publics ou privés.
14 C Sources and Distribution in the Vicinity of La
Hague Nuclear Reprocessing Plant: Part I-Terrestrial
Environment
M. Fontugne, D. Maro, Y Baron, C. Hatté, D Hebert, E. Douville
To cite this version:
M. Fontugne, D. Maro, Y Baron, C. Hatté, D Hebert, et al.. 14 C Sources and Distribution in the Vicinity of La Hague Nuclear Reprocessing Plant: Part I-Terrestrial Environment. Radiocarbon, University of Arizona, 2004, 46 (2), pp.827-830. �10.1017/S0033822200035852�. �hal-02470576�
14
C SOURCES AND DISTRIBUTION IN THE VICINITY OF LA HAGUE NUCLEAR REPROCESSING PLANT: PART I—TERRESTRIAL ENVIRONMENT
M Fontugne1,2 D Maro3 Y Baron4 C Hatté1 D Hebert2 E Douville2
ABSTRACT. COGEMA-La Hague nuclear reprocessing plant in the Cotentin Peninsula (northwest France) releases in the
atmosphere about 19 TBq.yr–1 of radiocarbon. Three experiments in a terrestrial environment with sampling of a bio-indicator like furze were performed in 1997, 1998, and 1999, and additional air samples in the chimney plume were measured. Results presente d here establish the 14C distribution in the La Hague environment and suggest that a part of the 14C content in the vegetation near the coast results from a 14CO2 degassing of seawater supplied with the liquid waste from the nuclear plant.
INTRODUCTION
The COGEMA-La Hague nuclear reprocessing plant is located in the northwest part of the Cotentin Peninsula near Cherbourg, France. This nuclear plant releases radioelements in the atmosphere and in
the English Channel. Radiocarbon is released to the environment as CO2 through a 100-m-high
chimney, and as liquid waste a few km off the shore, west of the reprocessing plant. Atmospheric 14C
releases are estimated to be 19 TBq.yr–1 (COGEMA data 2000).
The carbon dioxide is assimilated by plants through photosynthetic processes. Consequently, the
14
C activity of vegetation constitutes an integrated record of emissions from COGEMA-La Hague during the vegetative period (spring to fall). The aim of this study is to present the distribution of
14
C in the vicinity of the La Hague reprocessing plant.
MATERIALS AND METHODS
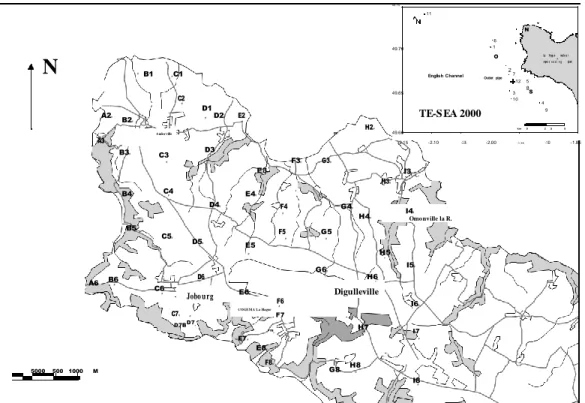
During 3 yr (1997–1999), the spring growth of furze was collected by the Laboratoire d’Etudes Radioécologiques de la Façade Atlantique (LERFA) and the Groupe d’Etudes Atomiques (GEA) at 70 stations (Figure 1). Twenty stations were chosen each year for 14C analyses. The samples were prepared using classical methods (Delibrias 1985). The 14C activity was measured by ß-counting in CO2 proportional gas counters at the Laboratoire de Sciences du Climat et de
l’Environnement (LSCE) at Gif/Yvette for years 1997 and 1998 and by benzene liquid scintillation at the University of Georgia (USA) for 1999 samples.
In the COGEMA-La Hague reprocessing plant, atmospheric releases of CO2 through the chimney are
not continuous and occur only during the opening of the nuclear fuel casing, about 10 to 15 times a day.
Each release lasts for 30 to 40 min. CO2 air samples were collected in the COGEMA plant downwind
of the chimney plume at Digulleville (Eperons Mount), 1000 m north of the chimney, and at sea, southwest of the plant during the TE-SEA cruise (June 2000). Collection of air samples was done at ground level or 2 m above sea level. The chimney plume is detected by continuously mea-suring the 85
Kr activity (Maro et al. 2001), another gas released by COGEMA-La Hague.
CO2 in a few liters of air was trapped by bubbling air in sodium hydroxide prepared a few hr before
sampling to avoid contamination by sodium carbonate generally present within sodium hydroxide
1
Laboratoire des Sciences du Climat et de l’Environnement, UM R 1572-CEA/CNRS, Domaine du CNRS, F-91198-Gif sur Yvette cedex, France.
2Corresponding author. Email: [email protected].
3Laboratoire de Radioécologie de Cherbourg-Octeville (IRSN/DEI/SECRE/LRC) F-50130 Cherbourg-Octeville, France. 4Marine Nationale, Groupe d’Etudes Atomiques (GEA), BP 34 F-50115-Cherbourg Naval, France.
4 9 .7 5 11 N 6
N
49.70 1 O La H agu e nucl e a r E English Channel 2 7 repro c e s s i n g pl ant # B1 # C1 Outlet pipe 12 5 C2 49.65 3 8S 10 4 # D1 D2# TE-S EA 2000 A2# E2 9 B2# # H2# # k m 49.60 0 0 .20 5.5 0 .51 # Auderville G2# A3 -2.15 -2.10 -2.05 -2.00 -1 .9 5 -1.90 -1.85 B3# C3 D3 # F3# G3# # E3# I3# H3# B4# C4 # E4# D4# F4 G4 # I4# H4# # Omonville la R. B5# C5# F5 G5 D5# # # E5 # H5 # I5# G6# D6 H6 A6 B6 # # # # C6 E6 # Digulleville Jobo urg # F6 # I6# C7# COGEMA La Hague # F7 D7BD7# # H7 F7B I7 # # E7# # E8# 5000 500 1000 M F8# G8# H8 # I8 #Figure 1 Location of the sampling points in the Cotentin Peninsula and during the TE-SEA cruise (June 2000)
tablets. During 30 min, bigger samples were also collected using a compressor that filled a 50 -L bottle. Later, air in the bottle was bubbled in sodium hydroxide.
In the laboratory, barium hydroxide was added to the sodium hydroxide solution to get a precipitate of barium carbonate. This carbonate was then rinsed with degassed distilled water and dried at 50 °C
before reaction with orthophosphoric acid under vacuum to evolve CO2. Water used to prepare the
solution was previously degassed. Precipitation, filtration of precipitate, and rinsing were performed under a controlled nitrogen atmosphere. The blank was determined following this procedure on the same solution used for sampling. Very active samples were mixed meticulously with dead carbonate
before acid reaction and measurement by ß-counting. Samples were analyzed for 14C activity using
accelerator mass spectrometry (AMS) at the Gif AMS facilities or by ß-counting.
Results are expressed in Bq.kg–1 C (100 pMC = 226 Bq.kg–1 C). The standard deviation varies
between 0.5 and 2% for Gif measurements and between 1.3 and 4.4% for the University of Georgia.
RESULTS AND DISCUSSION
14C Activity in the Influence of the Chimney Plume
Results are reported in Table 1. Four samples near the chimney show 14C activity ranging from 4700 to
9800 Bq.kg–1 C, with a mean value of 7200 Bq.kg–1 C. At sea, 4 to 6 km southwest of the plant, 14C
activity ranges between 426 to 908 Bq.kg–1 C. Outside the plume influence, the activity ranges between
257 to 291 Bq.kg–1 C, with a mean value of 271 Bq.kg–1 C, identical to that found at station 11 far to
than can be expected for unpolluted air. These results show a rapid dilution of the plume, the activity decreasing by a factor of 10 in a few km.
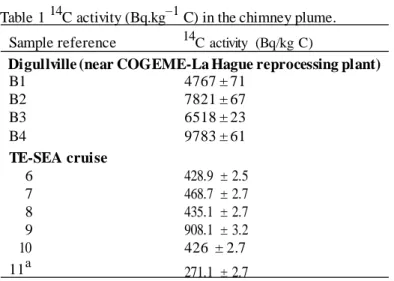
Table 1 14C activity (Bq.kg–1 C) in the chimney plume.
Sample reference 14C activity (Bq/kg C)
Digullville (near COGEME-La Hague reprocessing plant)
B1 4767 ± 71 B2 7821 ± 67 B3 6518 ± 23 B4 9783 ± 61 TE-SEA cruise 6 428.9 ± 2.5 7 468.7 ± 2.7 8 435.1 ± 2.7 9 908.1 ± 3.2 10 426 ± 2.7 11a 271.1 ± 2.7 a
Value for sea air samples outside the influence of the chimney plume.
14C Activity in Furze
Results are reported in Table 2. 14C activity varies between 250.5 and 587.1 Bq.kg–1 C. Reference samples were collected in Brittany, 300 km southwest from La Hague, and gave values between 252.6 and 254.3, in good agreement with 14C activity in air and plants growing outside areas con-taminated by industrial 14C. Samples from La Hague clearly record the influence of the reprocessing plant, the activity varying between 1 to 2 times the reference activity. The 14C distribution is similar for the 3 considered years (1997–1999) and clearly depends on the dominant wind direction, mainly a SW/ENE axis during the vegetative period. However, abnormally high values are found near the coast southwest of the plant at the extreme west of the peninsula, near Auderville and south of Jobourg. This excess of 14C at the coast suggests a marine contribution through degassing from sea-water of 14CO2 originating from the liquid waste released at the pipe
outlet south of the nuclear plant. The pCO2 measurements in water indicate that the sea was a
source of CO2 for the atmosphere (Keir et al. 2001; Fontugne et al. 2002). Atmospheric 14C
values measured at sea outside of the chimney plume that are about 20 Bq.kg–1 C higher than atmospheric reference values (1997–1999) support the hypothesis of a marine contribution.
CONCLUSIONS
Measurements of 14C activity in the chimney plume show a rapid dilution, from about 7200 Bq.kg–1 C near the chimney to values ranging between 400 and 900 Bq.kg–1 C at a distance of 4 to 6 km. Outside periods of release, the 14C residual value is around 270 Bq.kg–1 C. Vegeta-tion around the nuclear plant records these periods of release, concentration in bio -indicators rang-ing between 1 to 2 times the present atmospheric background. Higher 14C concentrations are observed at the coast, suggesting a supplementary marine contribution though the degassing of the 14C excess supplied by the liquid releases of the nuclear plant. This contribution has been esti -mated for year 2002 (Maro et al., these proceedings).
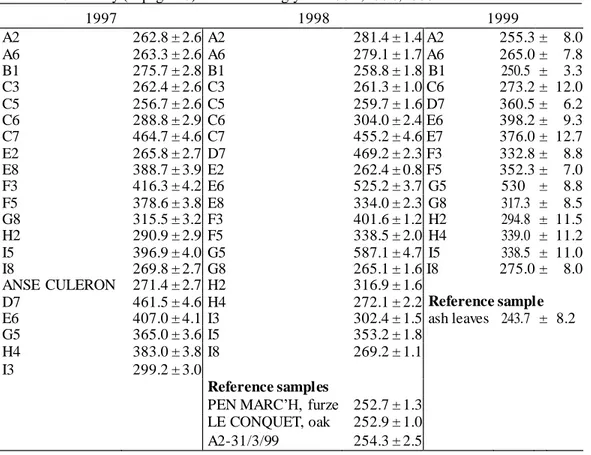
Table 2 14C activity (Bq.kg–1 C) in furze during years 1997, 1998, 1999. 1997 1998 1999 A2 262.8 ± 2.6 A2 281.4 ± 1.4 A2 255.3 ± 8.0 A6 263.3 ± 2.6 A6 279.1 ± 1.7 A6 265.0 ± 7.8 B1 275.7 ± 2.8 B1 258.8 ± 1.8 B1 250.5 ± 3.3 C3 262.4 ± 2.6 C3 261.3 ± 1.0 C6 273.2 ± 12.0 C5 256.7 ± 2.6 C5 259.7 ± 1.6 D7 360.5 ± 6.2 C6 288.8 ± 2.9 C6 304.0 ± 2.4 E6 398.2 ± 9.3 C7 464.7 ± 4.6 C7 455.2 ± 4.6 E7 376.0 ± 12.7 E2 265.8 ± 2.7 D7 469.2 ± 2.3 F3 332.8 ± 8.8 E8 388.7 ± 3.9 E2 262.4 ± 0.8 F5 352.3 ± 7.0 F3 416.3 ± 4.2 E6 525.2 ± 3.7 G5 530 ± 8.8 F5 378.6 ± 3.8 E8 334.0 ± 2.3 G8 317.3 ± 8.5 G8 315.5 ± 3.2 F3 401.6 ± 1.2 H2 294.8 ± 11.5 H2 290.9 ± 2.9 F5 338.5 ± 2.0 H4 339.0 ± 11.2 I5 396.9 ± 4.0 G5 587.1 ± 4.7 I5 338.5 ± 11.0 I8 269.8 ± 2.7 G8 265.1 ± 1.6 I8 275.0 ± 8.0 ANSE CULERON 271.4 ± 2.7 H2 316.9 ± 1.6 Reference sample D7 461.5 ± 4.6 H4 272.1 ± 2.2 E6 407.0 ± 4.1 I3 302.4 ± 1.5 ash leaves 243.7 ± 8.2 G5 365.0 ± 3.6 I5 353.2 ± 1.8 H4 383.0 ± 3.8 I8 269.2 ± 1.1 I3 299.2 ± 3.0 Reference samples
PEN MARC’H, furze 252.7 ± 1.3
LE CONQUET, oak 252.9 ± 1.0
A2-31/3/99 254.3 ± 2.5
ACKNOWLEDGEMENTS
Thanks are due to Martine Paterne for helpful discussions, Rodger Sparks for reviewing the manu -script, and Maurice Arnold for AMS measurements of TE-SEA cruise samples. We thank Mr Le Bourhis and Mr Henri, captains of the crew of the R/V “Côtes de la Manche.” TE-SEA and TRAN-SAT cruises were supported by CNRS.LSCE contribution nr 1101.
REFERENCES
COGEMA. 2000. Surveillance trimestrielle de l’environ-nement de la Hague. Rapport Hag. 055000120013. 84 p.
Délibrias G. 1985. Le carbone 14. In: Roth E, Poty B, editors. Méthodes de Datation par les Phénomènes
Nucléaires Naturels: Application. Paris: Coll. CEA,
Masson. p 421–58.
Fontugne M, Maro D, Baron Y, Hatté C, Hébert D, Dou-ville E. 2002. Identification of sources and distribu-t io n of radiocarbon in the vicinity of La Hague nuclear reprocessing plant. Radioprotection 37(C1):1271–6. Keir RS, Rehder G, Frankignoulle M. 2001. Partial pres
-sure and air-sea flux of CO2 in the Northeast Atlantic during September 1995. Deep Sea Research Part II:
Topical Studies in Oceanography 48(14–15):3179–
89.
Maro D, Crabol B, Germain. P, Baron Y, Hebert D, Bouisset P. 2001. A study of the near field atmospheric d is -persion of emission at height: comparison of Ga u s sia n plume models (Doury, Pasquill-Briggs, Caire) with krypton85 measurements taken around La Ha g u e n u -clear reprocessing plant. Radioprotection 37(C1): 1277– 82.
Maro D, Fontugne M, Hatté C, Hebert D, Rozet M. 2004. Source and distribution of radiocarbon in the vicinity of La Hague nuclear reprocessing plant: part II—marine environment. Radiocarbon, these pro-ceedings.