Publisher’s version / Version de l'éditeur:
Behavioural Brain Research, 2017-09-19
READ THESE TERMS AND CONDITIONS CAREFULLY BEFORE USING THIS WEBSITE.
https://nrc-publications.canada.ca/eng/copyright
Vous avez des questions? Nous pouvons vous aider. Pour communiquer directement avec un auteur, consultez la
première page de la revue dans laquelle son article a été publié afin de trouver ses coordonnées. Si vous n’arrivez pas à les repérer, communiquez avec nous à PublicationsArchive-ArchivesPublications@nrc-cnrc.gc.ca.
Questions? Contact the NRC Publications Archive team at
PublicationsArchive-ArchivesPublications@nrc-cnrc.gc.ca. If you wish to email the authors directly, please see the first page of the publication for their contact information.
NRC Publications Archive
Archives des publications du CNRC
This publication could be one of several versions: author’s original, accepted manuscript or the publisher’s version. / La version de cette publication peut être l’une des suivantes : la version prépublication de l’auteur, la version acceptée du manuscrit ou la version de l’éditeur.
For the publisher’s version, please access the DOI link below./ Pour consulter la version de l’éditeur, utilisez le lien DOI ci-dessous.
https://doi.org/10.1016/j.bbr.2017.09.028
Access and use of this website and the material on it are subject to the Terms and Conditions set forth at
Comparison of cannabinoids with known analgesics using a novel high
throughput zebrafish larval model of nociception
Ellis, L. D.; Berrue, F.; Morash, M.; Achenbach, J. C.; Hill, J.; McDougall, J. J.
https://publications-cnrc.canada.ca/fra/droits
L’accès à ce site Web et l’utilisation de son contenu sont assujettis aux conditions présentées dans le site LISEZ CES CONDITIONS ATTENTIVEMENT AVANT D’UTILISER CE SITE WEB.
NRC Publications Record / Notice d'Archives des publications de CNRC: https://nrc-publications.canada.ca/eng/view/object/?id=b473564b-c35f-4067-ba97-559fc19aafc4 https://publications-cnrc.canada.ca/fra/voir/objet/?id=b473564b-c35f-4067-ba97-559fc19aafc4
A novel zebrafish larval model of nociception used to compare cannabinoids with known analgesics.
Ellis, LD; Berrue, F Morash, M; Achenbach, JC; Hill, J; McDougall, JJ Abstract
It has been established that both adult and larval zebrafish are capable of showing nociceptive responses to noxious stimuli; however, the use of larvae to test novel analgesics has not been fully explored. Zebrafish larvae represent a low-cost, high-throughput alternative to traditional mammalian models for the assessment of product efficacy during the initial stages of drug development. In the current study, a novel model of nociception using zebrafish larvae is described. During the recovery from an acute exposure to low levels of acetic acid, larvae display innate changes in behaviour that may be indicative of nociception. To assess the usefulness of this model for testing potential analgesics, three known synthetic pain medications were assessed (ibuprofen, acetaminophen and tramadol) along with three naturally occurring products (honokiol, tetrahydrocannabinol and cannabidiol). When the effect of each compound on both the acetic acid recovery and control activity was compared there appeared to be both similarities and differences between the compounds. One of the most interesting effects was found for cannabidiol which appeared to oppose the activity change during the recovery period while having a nominal effect on control activity. This would appear to be in line with current research that has demonstrated the nociceptive properties of cannabidiol. Here we have provided a novel model that will complement existing zebrafish models and will expand on the potential use of zebrafish larvae for studying both nociception and new analgesics.
Intro
Pain is a complex physiological phenomenon with multiple etiologies. The numerous pain modalities and varied underlying causes make it difficult to develop treatments that can specifically target the source of the pain. Often a single analgesic is only efficacious in a subset of patients or can only reduce the level of pain by a certain degree but cannot eliminate it. There are a number of analgesic classes that treat different types of pain from relatively mild (NSAIDs, paracematol) to more severe pain (opiods). All analgesics possess significant side effects, such as sedation, organ toxicity, addiction and the
development of tolerance. In an effort to avoid strong side effects many people look towards naturally derived compounds for pain management (Quintans, Antoniolli et al. 2014). Natural products have been used i the treat e t of pai for thousa ds of years a d uch of the world’s populatio still rely heavily on natural pain remedies. The challenges associated with the use of natural products as therapeutics is that often the chemical composition of the products is not completely known and only a limited amount of testing is required to make health claims. Resolving this problem is difficult as companies are often hesitant to spend large amounts of money on testing. One such product that has steadily gained interest in the field of pain management is cannabis (Kim and Fishman 2017). While the use of medical
marijuana is gaining mainstream support, challenges still exist with its use, such as dosing, side effect profiles (psycho-activity, toxicity) and an overall lack of knowledge of its mechanism of action, which often makes clinicians hesitant to prescribe it (Carlini, Garrett et al. 2017). Some of these challenges stem from the fact that in addition to the most characterized cannabinoids, tetrahydrocannabinol (THC) and cannabidiol (CBD), cannabis contains numerous other cannabinoids along with terpenes and flavonoids that all may have biological activity but are poorly characterized (Andre, Hausman et al. 2016). Thus a model that can test the bio-activity of both plant derived material and extracted chemicals would aid in the further development of cannabis and cannabinoids as therapeutics.
Drug testing models using zebrafish larvae have gained popularity as a starting point for the testing of potential therapeutics as they offer a low-cost, high-throughput alternative to more costly mammalian tests (Rennekamp and Peterson 2015). It has been shown that zebrafish possess a similar
endocannabinoid system to that of mammals and may be useful for identifying the therapeutic potential of cannabinoids (Krug and Clark 2015). Zebrafish models may also provide information on both the target specificity of the compounds being tested along with potential off target effects that may be detrimental or lead to toxicity (Kanungo, Cuevas et al. 2014).
Additionally, a large number of disease models have been developed using zebrafish that can be used to test the efficacy of potential therapeutics (Santoriello and Zon 2012; MacRae and Peterson 2015). With respect to pain, it is now widely accepted that fish can detect painful stimuli (nociception) and have similar somatosensory neural networks to higher vertebrates (Sneddon 2009; Malafoglia, Bryant et al. 2013). Zebrafish behavioural models of nociception have been developed using both adults and larvae (Prober, Zimmerman et al. 2008; Reilly, Quinn et al. 2008; Correia, Cunha et al. 2011; Maximino 2011; Lima, Maximino et al. 2012; Gau, Poon et al. 2013; Malafoglia, Bryant et al. 2013; Malafoglia, Colasanti et al. 2014; Steenbergen and Bardine ; Curtright, Rosser et al. 2015; Lopez-Luna, Al-Jubouri et al. 2017; Taylor, Dewberry et al. 2017). Adult pain models have attempted to mirror those developed for other fish species involving the injection of acetic acid (AA) into either the lips (Reilly, Quinn et al. 2008; Correia, Cunha et al. 2011) or subcutaneously along the trunk (Maximino 2011). While these studies produced changes in behaviour that were indicative of pain, one of the lures of using zebrafish as a drug testing model comes from the high throughput and low cost of larval studies. In addition, a recent study has highlighted the usefulness of a larval nociception model as replacement for adult pain studies (Lopez-Luna, Al-Jubouri et al. 2017). Currently there are a limited number of zebrafish models of nociception using larvae. It has been shown that chemical and thermal stimuli can produce changes in larval behaviour that are indicative of nociception such as changes in activity (Prober, Zimmerman et al. 2008; Lopez-Luna, Al-Jubouri et al. 2017) and temperature aversion (Gau, Poon et al. 2013; Curtright, Rosser et al. 2015). In addition to behavioural responses thermal stimuli can produce gene expression changes related to the activation of nociceptive pathways (Malafoglia, Colasanti et al. 2014).
In the current study we have developed a novel model of nociception in which 5 day old larvae are briefly exposed to acetic acid followed by an analysis of their subsequent patterns of behaviour during their recovery. In order to evaluate the efficacy of the model for testing the therapeutic potential of cannabinoids, known synthetic and naturally derived health products were tested for their effects on the larval pain model and compared with THC and CBD.
Results
Previous zebrafish models have shown that continuous exposure of larvae to low levels of acetic acid (AA - 0.0025-0.025%) leads to a general and often sustained increase in activity (Steenbergen and Bardine 2014
) while exposure to higher levels of AA (0.1-0.25%) produces a decrease in activity (Lopez-Luna, Al-Jubouri et al. 2017). In order to design an alternative behavioural model of nociception using zebrafish larvae that would complement the existing studies and may more closely resemble both adult and rodent injection studies we have developed a model where larvae were exposed to higher levels of AA for short durations followed by recovery in a buffered solution. The goal was to produce some
peripheral tissue damage that would be akin to a localized injection without causing overt
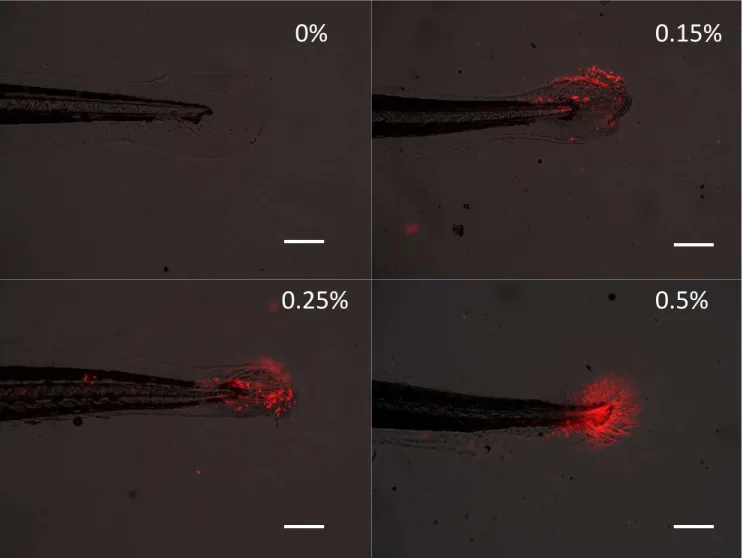
morphological abnormalities or lethality. We initially exposed larvae to AA between 0.1 & 0.5% for 60 seconds. The short duration exposure did not produce any overt physical deformations but propidium iodide staining did reveal that the AA exposure resulted in cell death on the surface of the larvae (Figure 1). There also appeared to be an increase in cell death as the concentration was increased from 0.1 to 0.5%.
Next we tested the effect of the short-duration AA exposure on larval behaviour. We used a
multifaceted behavioural assay to test both basal activity levels and stimulus response during recovery. Larvae show inherent activity patterns in both light and dark environments. The basal activity level for larvae is higher in the light than in the dark so we initially measured larval activity in the light (Prober, Rihel et al. 2006; MacPhail, Brooks et al. 2009). Paradoxically, a transition from light to dark results in a temporary increase in activity that is thought to be an avoidance response (Steenbergen, Richardson et al. 2011). Any decrease in the normal response to a light-dark transition may indicate sedation or an impediment to normal swimming activity such as tissue damage. In order to test both baseline activity and the response to a dark stimulus the basal activity of larvae was recorded for 2.5 hours in the light followed by three five-minute light-dark transitions (Figure 2A). Based on the propidium iodide test results we evaluated the behavioural response to AA concentrations between 0.1 & 0.5%. Exposure to concentrations at or above 0.25% AA led to a large drop in activity for the first 2.5 hours and the larvae no longer responded to the light to dark transitions (data not shown). This change in activity was considered too large to be useful for testing analgesics. We then narrowed the concentration range to between a level that produced the lowest significant decrease in activity (0.1%) and a maximum level that decreased activity without having a large effect on the light-dark transition response (0.2%). It was
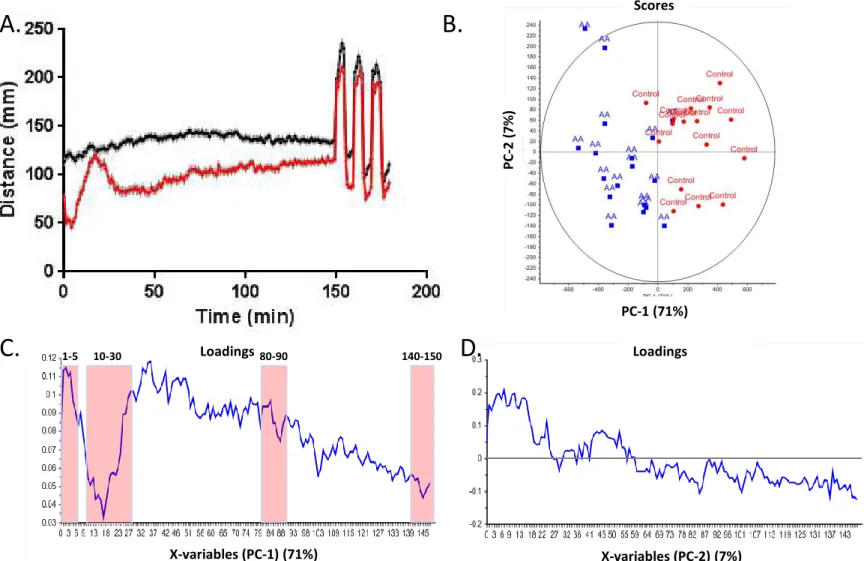
found that moving from 0.1 to 0.15 and finally 0.2% AA led to what initially appeared to be an increasing reduction in overall activity. Interestingly, exposure to 0.15% AA produced a multifaceted behavioural response. During the initial period of activity following the AA exposure larval activity was lower than controls, however, this was followed by an increase in activity between 10 & 40 minutes of recovery followed by a subsequent decrease in activity to a level well below that of the controls. The 0.15% AA model was further refined and the exposure time was decreased to 45 seconds resulting in a highly reproducible, multi-faceted change in behaviour (Figure 2A).
In order to assess the multi-faceted nature of the recovery response we used principle component analysis (PCA) as a data exploratory tool to reveal the main variances in a complex observation dataset and characterize trends in the behavior profiles using an untargeted approach. By converting a set of observations into a set of principal components (PCs), PCA results can be projected in an informative and dimensionally reduced score plot in order to best explain the variance in the data. In this study, PC-1 and PC-2 explained 7PC-1% and 7 % of the variances respectively, and a distinct and robust discrimination between control and AA treated larvae was observed along the PC-1 dimension of the score plot (figure 2B). Indeed, control larvae (red) display a strong positive influence along PC-1 while the AA treated larvae (blue) are symmetrically oriented in the opposite direction. In order to further characterize the weight of each variable (zebrafish mobility per 60s bin) on PC-1 score, the loading plot (Figure 2C) was interpreted from which four key characteristic regions were identified to represent observations with both high (1-5 min, and 80-90 min) and low variance (10-30 min, 140-150 min) recorded during the light exposure period. Both control and AA treated larvae displayed an even distribution along the Y-axis in the score plot which indicates that the second principal component (PC-2) is attributable to variances inherent to experimental deviation instead of the AA treatment. PC-2 loading plot (Figure 2D) displays an overall decrease in the basal activity over the 150 minute assessment period which could be
explained by recovery from the handling stress or attenuation to the light stimulus. Most of the variances resulting from the AA treatment can therefore be visualized and explained along the first principal component (71%) in the PCA model.
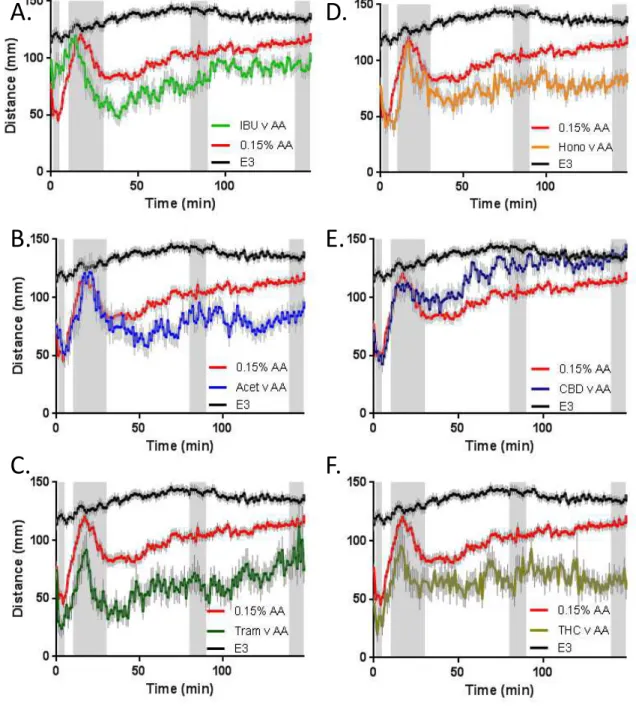
In order to assess the efficacy of the model for testing potential therapeutics we tested 4 known analgesics: ibuprofen, acetaminophen, tramadol and honokiol along with THC and CBD for their effects on the AA induced changes in behaviour (Figure 3). Initially concentration response profiles were generated for each compound (see materials and methods for concentration ranges). The data presented here represents the lowest concentration of each compound that produced a change in the
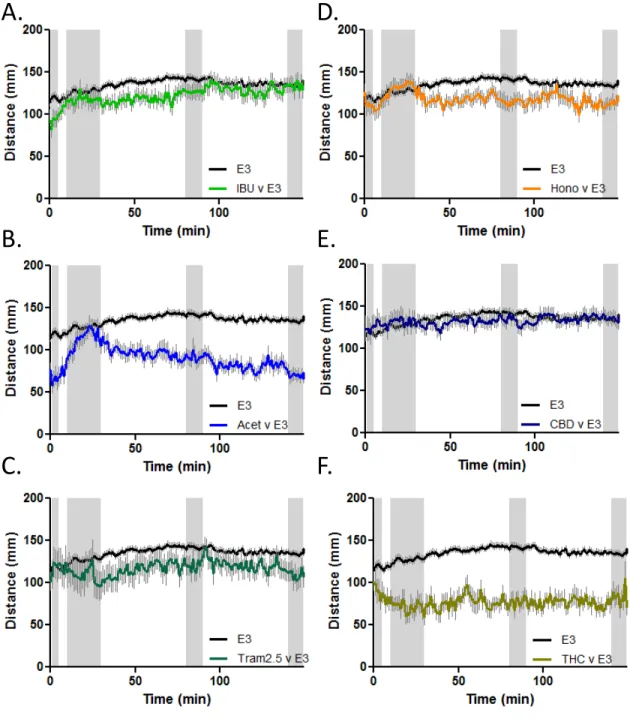
AA induced activity. Larvae were exposed to each compound at the selected concentration for 2 hours followed by the brief exposure to AA and then recovered in the compound being tested. In order to highlight the main features of the AA behavioural profile after larvae were exposed to the target compounds, the data are presented as the initial behavioural trace (60 second bins, Figure 3), a comparison of the 4 important time windows based on the initial PCA analysis (Figure 4) and finally by comparing all 6 compounds through PCA (Figure 5).
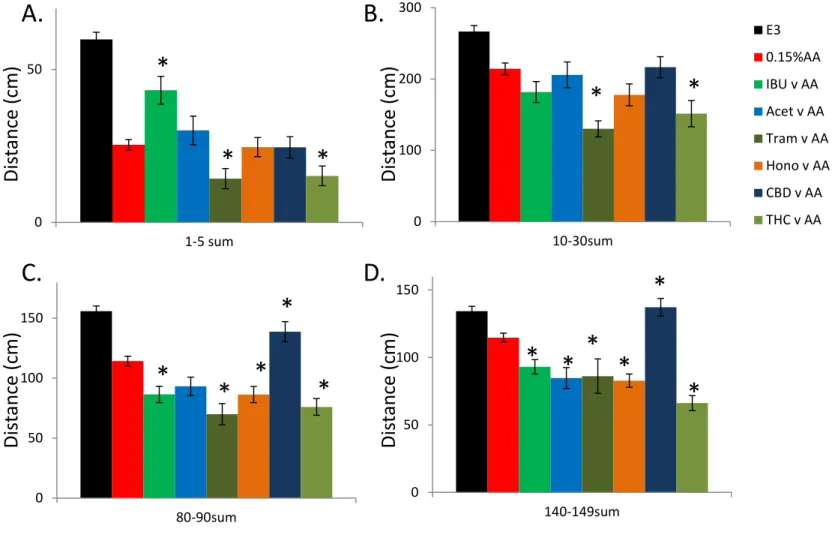
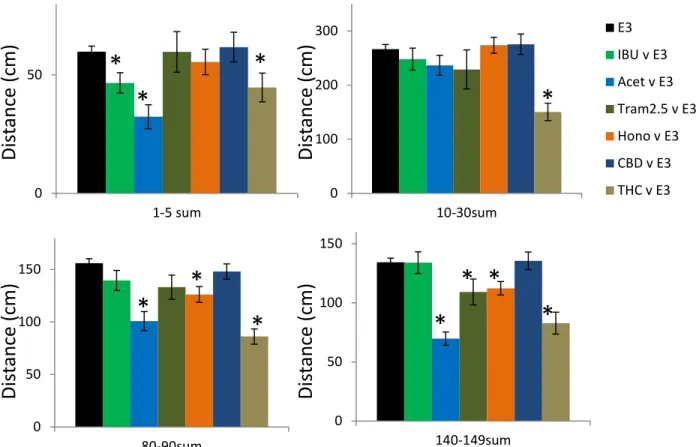
Acetaminophen, CBD and honokiol had no effect on the activity during the first 5 minute window, while both Tramadol and THC treatment led to a reduction in the AA induced activity (Tram 44%; THC 40%; Figure 4A). Conversely, ibuprofen appeared to oppose the AA induced activity reduction showing a significantly higher activity level (170%; Figure 4A). Only Tramadol and THC had an effect on the 10-30 minute time window, with both producing a reduction in activity (Tram 39%; THC 29%; Figure 4B). For the final two time windows (80-90 & 140-150 minute windows) all of the compounds, with the
exception of CBD, reduced the AA induced activity level (80-90 minute: IBU 24%; Acet 18%; Tram 39%; Hono 24%; THC 33%; 140-150 minute: IBU 19%; Acet 26%; Tram 24%; Hono 28%; THC 42%; Figure 4C&D). In contrast, CBD elevated the AA induced activity for the final two time windows (80-90 minute: 121%; 140-150 minute: 120%). Further analysis revealed that the activity level of the CBD treated larvae was not significantly different than controls for the 80-90 & 140-150 minute windows (80-90 minute: 90%; 140-150 minute: 102%; Figure 3E, 4C&D).
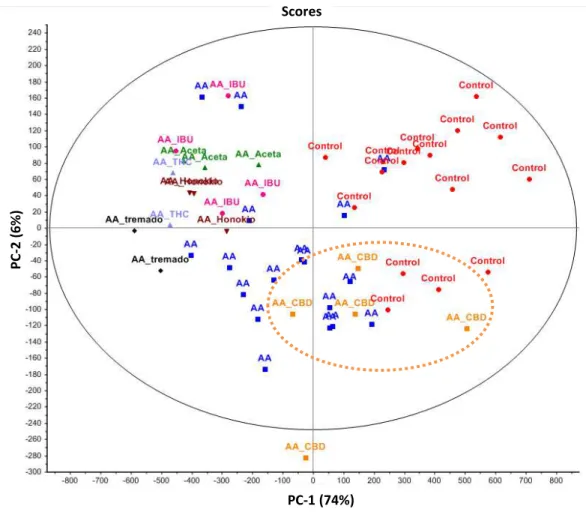
PCA was performed on the six tested compounds as well as both control and AA treated larvae and the results are displayed in the score plot from the first two principal components (Figure 5). While the variance encompassing the main internal structure of the data attributed to the change in the behavioral profile between control and AA treated larvae from which all control observations show a positive score was primarily along PC-1 (74% of variances), the larvae exposed to the tested compounds are differently scored along the first component while being further resolved on the second dimension to display unique coordinates on the score plot. This allowed for sub-groups of data points from the tested compounds to be distinguished on the score plot, and specifically CBD treated larvae are uniquely clustered at the interface of two data-point groups formed by the control and AA samples. The other compounds also lean towards showing different recovery patterns by forming distinguishable clusters or sub-groups in the score plot. As an example tramadol observations have the lowest score in the first principal component, and statically cluster away from Ibuprofen, honokiol, and acetaminophen overall. While Ibuprofen displays a wider dispersion across the score plot, acetaminophen and honokiol
exhibited a unique behavioral profile by clustering in two discernible sub-groups. Overall these experiments highlight the potential for PCA to predict and describe complex biological mechanisms involved in pain recovery in the zebrafish model.
The next important consideration was the effect of each compound on the activity pattern of control treated larvae. Control larvae show a relatively consistent activity level over the entire course of the 2.5 hour light phase (Figure 6). Of the 6 compounds tested acetaminophen and THC showed the largest decreases in activity versus the controls (Figure 6B & F) with THC showing a significant decrease in activity for all 4 of the time windows tested (Acet 39%, 11%; 35%, 48%; THC 25%, 43%, 44%, 38%; Figure 7). There were small reductions in activity for tramadol and honokiol, but these were only significant for the 80-90 (Tram 14%; Hono 19%) and 140-149 minute time windows (Tram 18%; Hono 16%; Figure 7). Importantly, ibuprofen only showed a slight decrease in activity during the first 5 minute time window (12%) and CBD did not show a significant change in activity versus controls for any of the time windows tested (Figure 7).
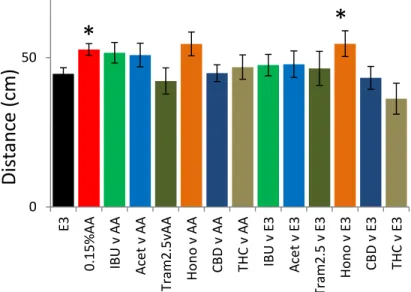
In order to evaluate if the reduction in activity produced by any of the compounds was the result of sedation we evaluate the dark transition response. There was no significant reduction in the light-dark transition response for any of the test groups (Figure 8). This result indicates that neither the AA treatment nor any of the therapeutics affected the normal stimulus response pattern.
Discussion
We have now developed a low-cost, high-throughput model to test the potential efficacy of analgesic compounds. Short term exposure to acetic acid (AA) leads to tissue damage on the surface of the larvae that likely generates a painful stimulus. This is based on the fact that larvae at this developmental time-point possess the subtypes of nociceptive neurons required to sense painful stimuli along the trunk (Pan, Choy et al. 2012; Gau, Poon et al. 2013). Previous studies using zebrafish larvae have shown that continuous exposure to various concentrations of AA produced distinct changes in larval behaviour (Prober, Zimmerman et al. 2008; Lopez-Luna, Al-Jubouri et al. 2017). However, it is important to note that these studies involved the continuous exposure of larvae to AA and the activity was measured for a relatively short period of time. In the current study we assessed larval behaviour during their recovery from the nociceptive stimuli. This may more closely represented both adult zebrafish and mammalian studies that typically use acute, focal injections of AA. Here we have found that an exposure to 0.15% AA for 45 seconds produced a behavioural response during the recovery period comprised of an initial
activity level lower than controls that was followed by a stereotypical elevation in activity over the first 30 minutes that again dropped to levels lower than controls and then returned to levels near that of controls over the next 2 hours (Figure 2). It is likely that the initial 2 phases of this multi-faceted activity pattern result from an initial shock/freeze response when larvae are initial placed in the recovery solution to which then becomes a flight response as the larvae attempted to escape from the painful stimuli. Importantly, following the first 2.5 hours in the light the larval response to light-dark transitions does not appear largely different than controls. This suggests that the stimulus does not have a
permanent effect on or cause permanent damage to the larvae. The previous studies that looked at the short term continuous exposure to AA have stated that prolonged exposure to the levels of AA tested would lead to lethality (Zahangir, Haque et al. 2015; Lopez-Luna, Al-Jubouri et al. 2017). In order to strengthen the statistical validity of the behavioural model principal component analysis was used as an untargeted approach to characterize and visualize the zebrafish behavioural trends during recovery from the painful stimulus. Differences between the AA treated larvae and controls were clearly evident from the PCA analysis. It was found that four sections in the behavioral pattern were characteristic areas that could be used to quantify and compare the differences in the behavioral responses between AA exposed larvae and controls.
In order to assess the relevance of the model for testing and comparing the analgesic properties of different compounds four known analgesics were chosen and their effects on the model were compared with those of THC and CBD. Principal component analysis (PCA) was successfully applied to the zebrafish behavioral observations and revealed that the 6 tested compounds displayed similarities and distinct cluster patterns when projected in the lower dimensional score plot (Figure 5) if we considered the behavioral observations over the 2.5 hours light exposure period as a high-dimensional data space (1 axis per 60 s binned variable). Of the compounds tested CBD showed the most unique activity pattern clustering between the AA and control patterns. This would be consistent with the raw activity trace and binned analysis that showed CBD was the only compound to oppose the reduction in activity produced by AA exposure by elevating the activity during the final hour of the test. The remaining 5 compounds appeared to cluster more closely together; however both ibuprofen and tramadol were located on the peripheral of the group formed by the other three compounds; acetaminophen, honokiol, and THC (Figure 5). Again this is consistent with the raw data traces and the binned data which showed
ibuprofen to be the only compound to produce an increase in activity for the first 5 minutes versus the AA treated larvae and tramadol showing the largest overall decrease in activity versus the AA treated larvae. Although additional experiments are prerequisite to further validate the PCA model, honokiol
and acetaminophen tend to create two sub-groups which would suggest the potential for the zebrafish pain model to describe complex pain recovery behavior and be applied as screening tools for the characterization of new analgesic compounds, formulations or natural extracts.
Further analysis of the binned data revealed that all 6 of the potential analgesics had different activity patterns. The two common over the counter analgesics, acetaminophen and ibuprofen, both showed a reduction in the AA induced activity during the final two time windows tested. However, they showed different responses during the first two time windows. Acetaminophen had no effect on either the initial drop in activity or the increase from 10-30 minutes. Ibuprofen appeared to oppose the initial drop in activity by elevating the AA induced activity (Figure 4). Importantly, ibuprofen had a minimal effect on the control activity while acetaminophen showed a significant reduction in activity (Figure 7). Honokiol showed a similar effect on the AA induced activity as acetaminophen, however, similar to ibuprofen it did not show the same reduction in control activity as was found for acetaminophen. Tramadol and THC have a similar effect on the AA induced activity leading to what appears to be an overall decrease in activity, however, tramadol had much less of an effect on the control activity than THC. It would then appear that while two compounds can have similar effects on the AA induced activity they may have differing effects on the control activity. A decrease in control activity may indicate a higher risk for side effects such as sedation or psycho-activity. While each of the 6 compounds showed a somewhat distinct activity pattern, it should be noted that acetaminophen and THC both showed a reduction in AA induced activity along with a similar reduction in control activity and that both target CB1 receptors. While more work is required to test compounds with similar targets, this may indicate that it will be possible to use this study as a first step in testing the target of new therapeutics.
Cannabidiol had perhaps the most interesting effect on the AA induced activity leading to an increase in activity over the course of the light cycle that returned the activity level to that of controls. It then appears that CBD can rescue some of the AA induced activity changes. Importantly at this level there was no effect of CBD on the control activity. CBD has been purported as a strong candidate for pain management (Costa, Trovato et al. 2007; Boychuk, Goddard et al. 2015; Hammell, Zhang et al. 2016) and one of the advantages of CBD over THC for the treatment of pain is the lack of psycho-activity and low side effect profile (Pisanti, Malfitano et al. 2017). It then appears that the effect of CBD on the current larval zebrafish model is consistent with its purported activity with respect to pain and is therefore suitable for the biological evaluation of cannabinoid like compounds. In addition to CBD, it appears that THC also has a complex effect on larval behaviour that may be indicative of its underlying bio-activity.
Since there is no effect of THC on the light-dark response of control larvae, the reduction in overall activity may not simply be an indicator of sedation, but may be due to the psycho-activity of THC. These results would seem to support the notion that cannabinoids other than THC may be better suited to be used as therapeutics as many do not have the same psycho-activity as THC. While cannabis use is ever increasing one of the many challenges to its use for the treatment of various disorders, including pain, is the varying levels of cannabinoids in different plant species and strains. This not only makes dosing difficult with respect to the levels of a single cannabinoid, such as THC, but the ratios of different cannabinoids may also affect the overall activity since there may be synergistic effects of different cannabinoids. It also appears that the ratio of CBD:THC is specifically important(Todd and Arnold 2016; Todd, Zhou et al. 2017). Thus, testing the interaction of the different cannabinoids using a low-cost, high-throughput in vivo model will be of great interest moving forward. The zebrafish larval behavioural models that we have developed may allow for such testing. In addition, since one of the primary uses for both medicinal marijuana and cannabinoids is pain management, the current model may be useful for screening and comparing other cannabinoids, combinations of cannabinoids or plant extracts for their analgesic potential.
The multifaceted changes in behaviour produced by exposure to AA in the current model appear to be able to quantify differences in the activity of potential and known therapeutics. As such, these tests may not only help ascertain the potential efficacy of an analgesic compound, but competition assays with other known compounds or further model development may also help to discern mechanisms of action or targets. Further validation and development of the model will require the profiling of the neural pathways that are activated by the AA exposure paradigm along with any gene expression changes that may be indicative of nociception.
Materials and Methods Animals
Zebrafish (Danio rerio) were maintained according to standard animal care protocols (Westerfield 1995) and in accordance with the Canadian Council on Animal Care guidelines. AB/Tubingen adults, embryos and larvae were maintained on a re-circulating Tecniplast aquatic system at 28oC +/- 1oC and between pH 7.0-7.5 on a 14/10 h light/dark (L/D) cycle. Embryos were collected from multiple AB/Tubingen breeding pairs and pooled. Following 4-6 hours in an incubator in E3 media (5 mM NaCl, 0.17 mM KCL, 0. M CaCl ∙ H O, 0. M MgSO ) unfertilized embryos were removed. Larvae were placed in Aquatic Habitats mesh-bottom baby baskets on the recirculation system until use.
Propidium Iodide staining
Five day old zebrafish larvae were placed 2 larvae per well in 12 well plates fitted with 15 mm Corning Netwell mesh bottom baskets. Larvae were exposed to acetic acid (AA) solutions (0.15, 0.25, 0.5%) made from a 5% AA stock solution in E3 media for 60 seconds. Larvae were washed in HEPEs buffered E3 media (HE3, E3 + HEPEs 10mM, pH 7.2), and transferred to 2ml of tricaine HE3 (50ul of 4mg/ml tricaine per 2ml HE3). Propidium Iodide was added to the well (0.75ul of 1.5mM PI) and swirled briefly for a final concentration of 0.5 ug/ml. Larvae were removed from the well and placed on a depression slide (3 per slide). The media was removed and replaced with ~100ul of 1.5% methyl cellulose w/ tricaine (50ul per 2ml). Larvae were imaged using a Nikon AZ100 fluorescent microscope at 4x2 zoom, dark: 400ms/2.8X gain, light: 100ms, 1X gain. All images were processed using NIS Elements AR 3.2 software.
Behavioural Testing
Five day old zebrafish larvae were placed 2 larvae per well in 12 well plates fitted with 15 mm Corning Netwell mesh bottom baskets. Larvae were incubated in HEPEs buffered E3 media (HE3, E3 + HEPEs 10mM, pH 7.2) or HE3 media with the therapeutic being tested for 2 hours in a light incubator. Acetic acid (AA) solutions were prepared using E3 media as the HE3 buffer contained enough HEPEs to reduce the acidity of the AA solutions reducing their effect on the larvae. An initial 5% stock solution in E3 was prepared from glacial AA. The stock solution was used to make the appropriate concentration of AA to be tested. Larvae were transferred from the pre-exposure solution to the AA or E3 control plate with the netwells. Following the required exposure time the netwells were washed 2 times with HE3 in 12 well plates then the larvae were transferred to a 24 well plate containing the appropriate recovery solution,
1 larvae per well, using a transfer pipette. The plates were placed immediately into the Zebrabox plate holder comprised of a recirculating water bath used to heat the plates, maintaining the plate
temperature at 28 °C. Larval activity was immediately tracked using the Viewpoint video tracking system and software (Viewpoint Life Sciences Inc., Montreal, Quebec, Canada). Images were scanned at a rate of 40fps and initially binned into 60-second windows. The behavioural testing protocol was begun immediately and consisted of a 2.5 hour exposure to light followed by a 5 minute dark-light cycle for 30 minutes. Following the behavioural protocol larvae were scored for any mortality, tissue damage or other abnormalities that may affect their behaviour. The initial concentrations tested of for each compound are as follows: Ibuprofen 25-100uM; Acetaminophen 1-10mM; Tramadol 1-20uM; Honokiol 1-5uM; THC 0.1-1uM; CBD 0.1-2.5uM.
Data Analysis
The entire distance travelled was used as the behavioural metric and data was initially pooled into 60 second bins. Each 24 well plate was split into two treatment groups for each run (n=12/group). The data from multiple experiments conducted on separate days was pooled for further analysis (n=36-60 for drug treatment groups, n= 188 for E3 controls, n=208 for AA controls). Following the initial analysis the activity was binned into the following time frames: 1-5, 10-30, 80-90 and 140-150 minutes. In addition the total activity for the second light cycle was subtracted from the total activity during the second dark cycle. Comparisons were made between experimental groups by testing significant differences using a standard 2-tailed t-test with a two sample unequal variance that compared data for each bin.
Multivariate statistical analysis and PCA was performed on the software Unscrambler X (v10.3) from CAMO. The dataset was built by averaging the observations recorded for 12 larvae and each sample was described by 150 variables obtained from the mobility measured within 60 second bins over the 2.5 hours of light exposure. PCA results were obtained after mean centering the data matrix for each variable and discussed by interpreting both score and loadings plots.
References
Andre, C. M., J. F. Hausman, et al. (2016). "Cannabis sativa: The Plant of the Thousand and One Molecules." Front Plant Sci 7: 19.
Boychuk, D. G., G. Goddard, et al. (2015). "The effectiveness of cannabinoids in the management of chronic nonmalignant neuropathic pain: a systematic review." J Oral Facial Pain Headache 29(1): 7-14.
Carlini, B. H., S. B. Garrett, et al. (2017). "Medicinal Cannabis." Am J Hosp Palliat Care 34(1): 85-91. Correia, A. D., S. R. Cunha, et al. (2011). "A Novel Behavioral Fish Model of Nociception for Testing
Analgesics." Pharmaceuticals (Basel, Switzerland) 4(4): 665-680.
Costa, B., A. E. Trovato, et al. (2007). "The non-psychoactive cannabis constituent cannabidiol is an orally effective therapeutic agent in rat chronic inflammatory and neuropathic pain." Eur J Pharmacol
556(1-3): 75-83.
Curtright, A., M. Rosser, et al. (2015). "Modeling nociception in zebrafish: a way forward for unbiased analgesic discovery." PLoS One 10(1): e0116766.
Gau, P., J. Poon, et al. (2013). "The zebrafish ortholog of TRPV1 is required for heat-induced locomotion." J Neurosci 33(12): 5249-60.
Hammell, D. C., L. P. Zhang, et al. (2016). "Transdermal cannabidiol reduces inflammation and pain-related behaviours in a rat model of arthritis." Eur J Pain 20(6): 936-48.
Kanungo, J., E. Cuevas, et al. (2014). "Zebrafish model in drug safety assessment." Curr Pharm Des
20(34): 5416-29.
Kim, P. S. and M. A. Fishman (2017). "Cannabis for Pain and Headaches: Primer." Curr Pain Headache Rep 21(4): 19.
Krug, R. G., 2nd and K. J. Clark (2015). "Elucidating cannabinoid biology in zebrafish (Danio rerio)." Gene
570(2): 168-79.
Lima, M. G., C. Maximino, et al. (2012). Nocifensive Behavior in Adult and Larval Zebrafish. Zebrafish Protocols for Neurobehavioral Research. A. V. Kalueff and A. M. Stewart. Totowa, NJ, Humana Press: 153-166.
Lopez-Luna, J., Q. Al-Jubouri, et al. (2017). "Reduction in activity by noxious chemical stimulation is ameliorated by immersion in analgesic drugs in zebrafish." J Exp Biol 220(Pt 8): 1451-1458. MacPhail, R. C., J. Brooks, et al. (2009). "Locomotion in larval zebrafish: Influence of time of day, lighting
and ethanol." Neurotoxicology 30(1): 52-8.
MacRae, C. A. and R. T. Peterson (2015). "Zebrafish as tools for drug discovery." Nat Rev Drug Discov
14(10): 721-31.
Malafoglia, V., B. Bryant, et al. (2013). "The zebrafish as a model for nociception studies." J Cell Physiol
228(10): 1956-66.
Malafoglia, V., M. Colasanti, et al. (2014). "Extreme thermal noxious stimuli induce pain responses in zebrafish larvae." J Cell Physiol 229(3): 300-8.
Maximino, C. (2011). "Modulation of nocicpetive-like behavior in zebrafish by environmental stressors." Psychology and Neuroscience 4(1): 149-155.
Pan, Y. A., M. Choy, et al. (2012). "Robo2 determines subtype-specific axonal projections of trigeminal sensory neurons." Development 139(3): 591-600.
Pisanti, S., A. M. Malfitano, et al. (2017). "Cannabidiol: State of the art and new challenges for therapeutic applications." Pharmacol Ther.
Prober, D. A., J. Rihel, et al. (2006). "Hypocretin/orexin overexpression induces an insomnia-like phenotype in zebrafish." J Neurosci 26(51): 13400-10.
Prober, D. A., S. Zimmerman, et al. (2008). "Zebrafish TRPA1 channels are required for chemosensation but not for thermosensation or mechanosensory hair cell function." J Neurosci 28(40): 10102-10.
Quintans, J. S., A. R. Antoniolli, et al. (2014). "Natural products evaluated in neuropathic pain models - a systematic review." Basic Clin Pharmacol Toxicol 114(6): 442-50.
Reilly, S. C., J. P. Quinn, et al. (2008). "Behavioural analysis of a nociceptive event in fish: Comparisons between three species demonstrate specific responses." Applied Animal Behaviour Science
114(1–2): 248-259.
Rennekamp, A. J. and R. T. Peterson (2015). "15 years of zebrafish chemical screening." Curr Opin Chem Biol 24: 58-70.
Santoriello, C. and L. I. Zon (2012). "Hooked! Modeling human disease in zebrafish." J Clin Invest 122(7): 2337-43.
Sneddon, L. U. (2009). "Pain perception in fish: indicators and endpoints." Ilar j 50(4): 338-42. Steenbergen, P. J. and N. Bardine (2014
). "Antinociceptive effects of buprenorphine in zebrafish larvae: An alternative for rodent models to study pain and nociception?" Applied Animal Behaviour Science 152: 92-99.
Steenbergen, P. J., M. K. Richardson, et al. (2011). "Patterns of avoidance behaviours in the light/dark preference test in young juvenile zebrafish: A pharmacological study." Behav Brain Res.
Taylor, J. C., L. S. Dewberry, et al. (2017). "A novel zebrafish-based model of nociception." Physiol Behav
174: 83-88.
Todd, S. M. and J. C. Arnold (2016). "Neural correlates of interactions between cannabidiol and Delta(9) -tetrahydrocannabinol in mice: implications for medical cannabis." Br J Pharmacol 173(1): 53-65. Todd, S. M., C. Zhou, et al. (2017). "Interactions between cannabidiol and Delta9-THC following acute
and repeated dosing: Rebound hyperactivity, sensorimotor gating and epigenetic and neuroadaptive changes in the mesolimbic pathway." Eur Neuropsychopharmacol 27(2): 132-145.
Zahangir, M. M., F. Haque, et al. (2015). "Secondary stress responses of zebrafish to different pH: Evaluation in a seasonal manner." Aquaculture Reports 2: 91-96.
0%
0.25%
0.5%
0.15%
Figure 1. Propidium idodide staining of 5 dpf zebrafish larvae following short term
exposure (60 s) to acetic acid. Scale bar-200uM
Figure 2. Optimized acetic acid (AA) exposure paradigm. A. Larval activity
following exposure to 0.15% AA or control media (E3) for 45 seconds . B.
Score plot (PC-1 vs PC-2). C. Loadings PC-1 D. Loadings PC-2
Scores PC-1 (71%) PC -2 ( 7% ) Loadings Loadings X-variables (PC-1) (71%) X-variables (PC-2) (7%) 1-5 10-30 80-90 140-150
A. B.
C. D.
Figure 3. Larval activity response
following acetic acid (AA) exposure
during pre/post treatment with: A.
Ibuprofen (25 uM), B. Acetaminophen
(5 mM), C. Tramadol (2.5 uM), D.
Honokiol (1 uM), E. Cannabidiol (0.5
uM), F. Tetrahydrocannabinol (0.5 uM).
A.
B.
C.
D.
E.
F.
0 50 1-5 sum 0 100 200 300 10-30sum E3 0.15%AA IBU v AA Acet v AA Tram v AA Hono v AA CBD v AA THC v AA 0 50 100 150 140-149sum 0 50 100 150 80-90sum
*
*
*
*
*
*
*
*
*
*
*
* *
*
*
*
*
A.
C.
B.
D.
Figure 4. Comparison of total activity across 4 different time points for larvae exposed to acetic
acid (AA) 0.15% for 45 seconds. Larvae were pre-treated and recovered in 1 of 6 different
potential analgesics. Ibuprofen (IBU, 25uM), Acetaminophen (Acet, 5mM), Tramadol (Tram,
2.5uM), Honokiol (Hono, 1uM), cannabidiol (CBD, 0.5uM), tetrahydrocannabinol (THC, 0.5uM).
D
is
ta
nce
(cm)
D
is
ta
nce
(cm)
D
is
ta
nce
(cm)
D
is
ta
nce
(cm)
Figure 5. Score plot PC-1 vs PC-2 from PCA results obtained for 6 tested
compounds as well as E3 control and AA control
Scores PC-1 (74%) PC -2 ( 6% )
A.
B.
C.
D.
E.
F.
Figure 6. Larval activity response
following control (HE3) exposure
during pre/post treatment with: A.
Ibuprofen (25 uM), B. Acetaminophen
(5 mM), C. Tramadol (2.5 uM), D.
Honokiol (1 uM), E. Cannabidiol (0.5
uM), F. Tetrahydrocannabinol (0.5 uM).
0 50 100 150 140-149sum 0 100 200 300 10-30sum E3 IBU v E3 Acet v E3 Tram2.5 v E3 Hono v E3 CBD v E3 THC v E3 0 50 1-5 sum 0 50 100 150 80-90sum
*
*
*
*
*
*
*
* *
*
*
Figure 7. Comparison of total activity across 4 different time points for control
larvae. Larvae were pre-treated and recovered in 1 of 6 different potential
analgesics. Ibuprofen (IBU, 25uM), Acetaminophen (Acet, 5mM), Tramadol
(Tram, 2.5uM), Honokiol (Hono, 1uM), cannabidiol (CBD, 0.5uM),
tetrahydrocannabinol (THC, 0.5uM).
D
is
ta
nce
(cm)
D
is
ta
nce
(cm)
D
is
ta
nce
(cm)
D
is
ta
nce
(cm)
0 50 E3 0. 1 5% A A IB U v A A A ce t v A A T ra m 2 .5 vA A Hon o v A A C B D v A A T H C v A A IB U v E 3 A ce t v E 3 T ra m 2 .5 v E 3 Hon o v E 3 C B D v E 3 T H C v E 3