by Carolyn Jenkins
B.S., Architecture (2007)
University of Virginia
Submitted to the Department of Architecture in partial fulfillment of
the requirements for the degree of MASTER OF ARCHITECTURE at the
MASSACHUSETTS INSTITUTE OF TECHNOLOGY.
Febraury 2013
© Carolyn Jenkins. All rights reserved.
The author hereby grants to MIT permission to reproduce and to distribute publicly
paper and electronic copies of this thesis document in whole or in part in any
medium now known or hereafter created.
Signature of Author:...
Department of Architecture
January 17, 2013
Certified by: ...
Andrew Scott
Associate Professor of Architecture
Thesis Supervisor
Certified by:...
Takehiko Nagakura
Associate Professor of Design and Computation
Chair of the Department Committee on Graduate Students
EAST BOSTON BUFFER:
A TRANSFERABLE URBAN FRAMEWORK FOR ADAPTING TO SEA RISE
EAST BOSTON BUFFER:
A TRANSFERABLE URBAN FRAMEWORK FOR ADAPTING TO SEA RISE
Andrew Scott, BArch
Associate Professor of Architecture
Thesis Supervisor
James Wescoat, PhD
Aga Khan Professor
John Fernandez, MArch
Associate Professor of Architecture and Building Technology and Engineering
Systems
THESIS COMMITTEE
by Carolyn Jenkins
by Carolyn Jenkins
Submitted to the Department of Architecture on January 17, 2013 in partial
fulfillment of the requirements for the degree of Master Of Architecture.
5
ABSTRACT
A TRANSFERABLE URBAN FRAMEWORK FOR ADAPTING TO SEA RISE
Urban vulnerability to climate change is constantly increasing. Many coastal cities will need to begin sea rise mitigation efforts soon, and now is a critical time for architects to intervene in this process with good design that takes on the issue of sea rise in the city, not just as a problem but as an opportunity and catalyst for change.
Data published in August 2012 revealed that the US East Coast is experiencing a rate of sea rise that is four times the global average. The city of Boston in particular has a high percentage of flood-prone areas due to the city’s dramatic history of landmaking. Of all the neighborhoods comprising Boston, the often-overlooked neighborhood of East Boston is the most flood-prone. The project is site-specific in that it is sited in the context of East Boston, but the design methodology and synthesis of technologies serve as a prototype to be applied to any urban waterfront.
This thesis project address the issue of sea rise in an urban context as a unique condition related to the construction a sustainable environment. In order to meet seemingly contradictory need for sea rise defense and capacity for future urban growth, the project reconsiders waterfront architecture as a new hybrid of architecture plus infrastructure as a means of building resilience and addressing scientific uncertainty.
The project establishes a systematic approach to a layered buffer zone that mediates between the sea and the vulnerable urban fabric of East Boston. The buffer is conceived of as a framework for future development that balances energy collection, environmental enhancement, and social enrichment through the allocation of productive, inhabitable, and recreational spaces within a defensive landscape. Through careful orchestration and layering of multi-disciplinary sea rise mitigation tools, the designed framework projects a new future for the urban waterfront – one that promotes social as well as physical resilience and adaptability in an ever-changing coastal environment.
Thesis Supervisor: Andrew Scott
Title: Associate Professor of Architecture
Abstract
ACKNOWLEDGEMENTS
Thank you to my advisory committee for helping me navigate this immense topic.
Andrew, thank you for encouraging me to keep track of the bigger picture and
maintain clarity on an already complex topic. Thank you Jim for helping me
keep my threads of reasoning relatively untangled. Thank you John, for your
encouragement and insight despite the distance.
A very big thanks to Barry Beagan, Erioseto Hendranata, Juan Jofre, and Zheela
Qaiser for lending your awesome rendering and modeling skills!
Thank you Antonio DiMambro for your generosity and sharing your expertise in the
topic of sea rise and flood management in an urban context.
Thank you Mom and Dad for your unfaltering support.
7 13 15 23 29 37 41 47 59 71 77 95 123 129 135 141 155 163 167 Contents
EAST BOSTON BUFFER:
A TRANSFERABLE URBAN FRAMEWORK FOR ADAPTING TO SEA RISE
TABLE OF CONTENTS
1.0 - Introduction
1.1 - Maldives Case Study ……….…..…….……… 1.2 - Urban Sea Rise Vulnerability ……….………….……… 1.3 - Existing Regulatory Framework……..……..….……… 2.0 - Research
2.1 - Criteria for Resilience & Adaptability ………....……… 2.2 - Interdisciplinary Sea Rise Mitigation Tools ..……… 3.0 - Site
3.1 - Boston Sea Rise Context & Project Scales……… 3.2 - East Boston Vulnerability Mapping………….………..……… 3.3 - Local Waterfront Focus Site….………..……… 4.0 - Design
4.1 - Edge Typology Studies…….….……….……… 4.2 - East Boston Buffer…….………..……… 4.3 - Resilient Waterfront Complex………....….……… 5.0 - Conclusions
5.1- Transferability of Approach……… 6. 0 - Appendices
6.1 - Table of Interdisciplinary Tools……….……….……… 6.2 - Thesis Defense Boards…..……….……….……… 6.3 - Final Models……….……… 6.4 - Previous Research & Design Studies….………...………… 7 .0 - Works Cited
7.1 - Bibliography……….……… 7.2 - List of Figures……….………
BOSTON - 3.57%
7.6 Million people
NEW YORK - 3.3%
20.1 Million people
PHILIDELPHIA - 5.26%
6.5 Million people
WASHINGTON, DC - 13.21%
8.57 Million people
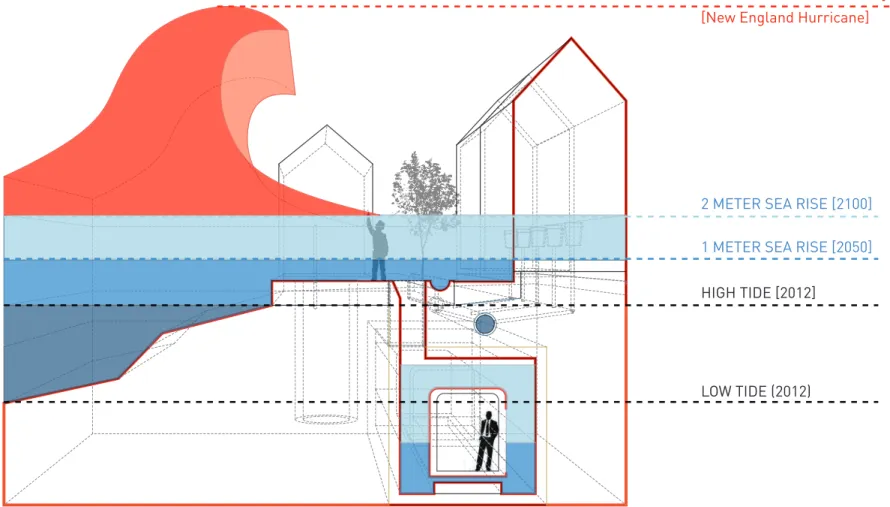
1 METER SEA RISE [2100]
SEA LEVEL [2012]
[TIDAL/ SEASONAL FLUX]
2 METER SEA RISE [2100?]
15’-0” STORM SURGE [1938]
[New England Hurricane]
EAST BOSTON BUFFER:
A TRANSFERABLE URBAN FRAMEWORK FOR ADAPTING TO SEA RISE
BOSTON - 3.57%
7.6 Million people
NEW YORK - 3.3%
20.1 Million people
PHILIDELPHIA - 5.26%
6.5 Million people
WASHINGTON, DC - 13.21%
8.57 Million people
(GLOBAL - 1.2%)
1 METER SEA RISE [2100]
SEA LEVEL [2012]
[TIDAL/ SEASONAL FLUX]
2 METER SEA RISE [2100?]
15’-0” STORM SURGE [1938]
[New England Hurricane]
WITHOUT THE INVESTMENT OF SEA RISE MITIGATION INFRASTRUCTURES,
CITIES WILL FIND THEMSELVES REPEATEDLY PAYING FOR DISASTER CLEANUP.
11. Hunter, Marnie and Hetter, Katia, Transit systems struggling to restart. CNN. Updated 12:55 PM EDT, October 30, 2012. Accessed online November 5, 2012. http://www.cnn.com/2012/10/28/travel/tropical-weather-transportation/index.html
11
1.0 - Introduction
1.0 - INTRODUCTION
As much as two meters of sea rise is expected by 2100. Such a gradual rise over the course of a century may not seem like a big deal, but when coupled with urban population growth and increase of severe storms, coastal cities - especially on the U.S. east coast - are sitting at a critical time where decisions need to be made about how to develop their waterfront. The conflation of these issues makes for a complex context for an architectural project. This project has been cognisant of these tangential issues, but explicitly not taken them on in a detailed way. The focus of the project is strictly how to manage sea rise urbanistically and architecturally by creating a performative and adaptive environment for inundation that creates physical framework for buildings and spatially provides places for social activation and participation.
CROSSING DISCIPLINARY BOUNDARIES
The design of an effective infrastructure is inherently complex and multi-disciplinary. This thesis argues that ultimately the effectiveness of such infrastructure in a city is tied to it’s experience as part of the urban environment. As an architecture student, I do not endeavor to become expert at the myriad specialties that would be required to weigh in on such a project in the ‘real world’. To keep the project in the realm of architecture, the approach of this thesis was to begin with a research phase (refer to sections 2, 6.1 and 6.4 for work from this process) for developing a sufficient under-standing these disciplinary tools to incorporate them in a strategic urban plan.
This complex problem of how to manage sea rise in an urban context has challenged experts as well. So far, the myriad of proposed solutions in cities and countries around the world have yielded disparate results. Generally, these projects are approached as single discipline endeavors. One such case which displays the inadequacy of such an approach is currently underway in the Maldives. The Maldivian government is imple-menting two concurrent and very different initiatives. The following section looks at the single disciplinary approaches being employed in greater detail and draws lessons from them - resulting in the argument for the layered strategies this thesis promotes.
PROJECT APPROACH & SCOPE
DEFINITIONS:
Hazard: a natural possible source of danger.
Disaster: an occurrence causing widespread destruction and distress including total failures and misfortunes
of human actions1. Disaster is the
in-troduction of humans into a hazard situation.
Risk: likelihood of a disaster based on vulnerability probability based on exposure to hazards.
Sea Rise: This project includes both thermal expansion and ice cap melting to arrive at 2 Meters (M) by 2100. The latest IPCC (2007) predicted a 0.6 M-1.4 M sea rise by 2100 and only considered thermal expansion.
1. Inam, Aseem. Planning for the Un-planned: Recovering from Crises in Megaci-ties. New York: Routledge, 2005. Print.
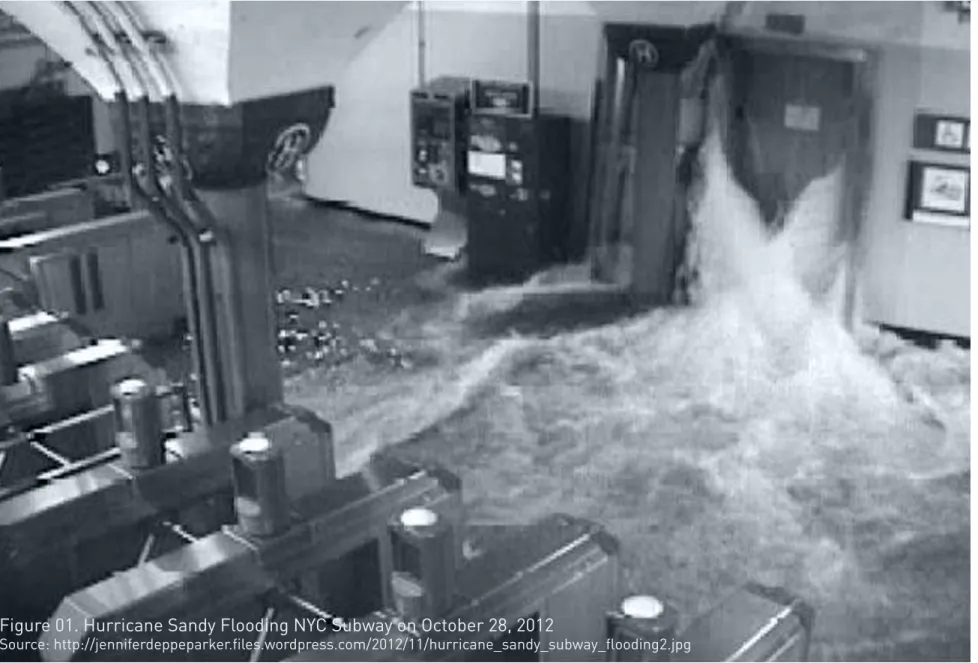
Figure 01. Hurricane Sandy Flooding NYC Subway on October 28, 2012
13
1.1 - Introduction - Maldives Case Study
MALDIVES CASE STUDY
The Maldives have been on the forefront of sea rise and climate change in the media as well as design and related industries trying to tackle the problem of sea rise. The country has become a testing ground for methods to adapt an existing urban condition to sea rise. So far there have been two sea rise mitigation strategies implemented by the Maldivian government, both of which are currently on-going.
The first is the Safer Island Development Program’ (SIDP) which identified 10 of the Maldives islands as more valuable (more urban) and sets them as safe havens for the
population1. These islands are receiving hard infrastructures such as sea walls and
desalination plants. SIDP has already led to severe destruction of existing natural capital. Dredging to create sandbars and erect seawalls is unintentionally weakening coral reefs and soil stability - natural shields against storm swells and surges.
In response to these issues, the Mali government has initiated a second program, ‘Integrating Climate Change Risks into Resilient Island Planning’ (ICCR). ICCR is a bottom-up approach of building capacity among local policy makers and communities
to implement soft infrastructure projects.2 These projects include: replenishing
natural ridges, afforestation, enhancing the island drainage system, restore vegetation along the shoreline, repair breaches in coral sea wall, planting mangroves and beach nourishment. These are all what I define as landscape tools.
Neither approach has a promising future, urbanistically speaking. The former removes buildings from the waterfront, separating the city and the sea. The latter doesn’t facilitate buildings at all. It is a retreat, which cedes more and more property to the sea over time. Most cities around the world cannot afford to take either approach.
1. Adaptation Learning Mechanism. Integration of Climate Change Risks into the Maldives Safer Island Development Programme, http://www.dev.adaptationlearning.net/project/inte-gration-climate-change-risks-maldives-safer-island-development-programme. Accessed December 2, 2012.
2. Sovacool, B.K. “Hard and Soft Paths for Climate Change Adaptation.” Climate Policy. 11.4 (2011): 1179. Print.
BOSTON - 3.57%
7.6 Million people
NEW YORK - 3.3%
20.1 Million people
PHILIDELPHIA - 5.26%
6.5 Million people
WASHINGTON, DC - 13.21%
8.57 Million people
(GLOBAL - 1.2%)
1 METER SEA RISE [2100]
SEA LEVEL [2012]
[TIDAL/ SEASONAL FLUX]
2 METER SEA RISE [2100?]
15’-0” STORM SURGE [1938]
[New England Hurricane]
COASTAL DESIGN NEEDS A NEW TYPOLOGY
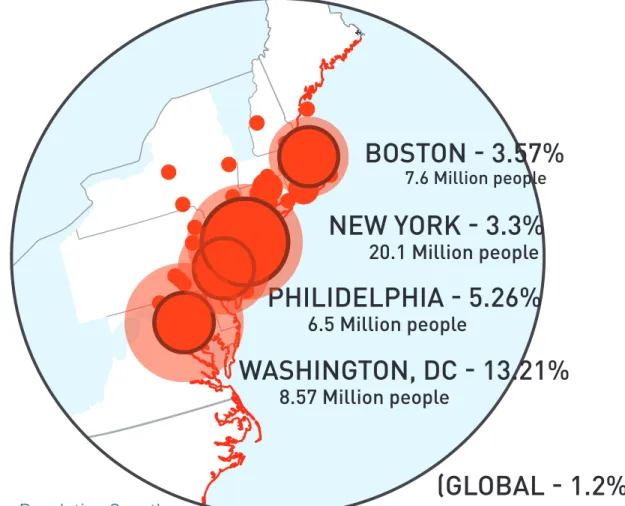
Coastal areas are the most developed in the nation. This narrow fringe– only 2% of the nation’s land–is home to more than
17% of the US population. Coastal population is increasing by 3,600 people per day, a projected total increase of 27 million
people between now and 2015.
1The region’s projected growth from 2010-50 is 35.2% (18.4 million people).
2Sources: 1. http://state_of_coast.noaa.gov/bulletins/html/pop_01/pop.html, 2. http://www.america2050.org/northeast.html
Figure 02. Northeast Megapolis Urban Population Growth
URBAN POPULATION GROWTH
15
1.2 - Introduction - Urban Sea Rise Vulnerability
BOSTON’S POPULATION IS
EXPECTED TO INCREASE
120% BY 2100.
1MEANWHILE,
EUSTATIC RISE (SEA RISE)
COULD REVERT THE CITY TO
IT’S
1880 SIZE!
2<
Sources: 1. Kirshen, Knee, and Ruth, Climate Change and Coastal Flooding in Metro Boston, 2008, p. 453. 2. Mapping Boston / edited by Alex Krieger and David Cobb, with Amy Turner, 1999,
URBAN SEA RISE VULNERABILITY
The stakes are too high for trial and error sea rise mitigation tactics. Coastal cities need a framework for long-term resilience that provides some continuity between the city and the sea. The public right to waterfront access as well as safety is long-valued
and too precious to throw away in the face of climate change. In the book Disasters
by Design, Dennis Mileti argues that we need to move beyond current dichotomous
measures for mitigation, like those used in the Maldives, which have a pattern of (1) staggering monetary losses from disasters still increasing, (2) simply postponing losses that will be more catastrophic when they do occur and (3) result in even short term or cumulative environmental degradation and ecological imbalance, which, besides being detrimental to society, also contributes to the occurrence and severity of the next
disaster.3
There are three main reasons why urban areas are particularly vulnerable to sea rise. First, historic development has led to large ares of low lying ground (Figure 05). Second, the dependence of buried and centralized infrastructures - the hazards of which were recently seen in New York City when Hurricane Sandy hit (Figure 01). Third, the lack of a physical buffer or capacity for flooding. There is no where for the water to go, so when a flood occurs, it is never welcome.
On the US East Coast, urban vulnerability is partly due to coastal cities development history. The US ‘Northeast Megapolis’ (refer to Figure 02 - the cities of Boston, New York, Philadelphia and Washington, DC) has a dramatic history of transformation along the waterfront: construction, demolition, and reconstruction – destroying natural flood buffers for the sake of physical and ultimately economic growth. In Boston, for example, the land-making process has completely transformed the coast- wharfing out
by 300% - from 16mi2 to 48mi2 (Figure 03).4 The areas of land that have been added
3. Mileti, Dennis S., Disaster By Design: A reassessment of Natural Hazards in the United States. P. 24.
4. Seasholes, Nancy. Gaining Ground: A history of land-making in Boston. Cambridge: MIT Press, 2003.
boston - 3.57%
7.6 Million people
new york - 3.3%
20.1 Million people
philidelphia - 5.26%
6.5 Million people
washington, dc - 13.21%
8.57 Million people
1 METER SEA RISE [2050] HIGH TIDE [2012]
LOW TIDE (2012)
2 METER SEA RISE [2100]
4.6 METER STORM SURGE [1938] [New England Hurricane]
PROGRAMMED TO WORK WITH FLOODING
16Data published in August, 2012 revealed that the US East coast is showing faster than average and faster than previously
anticipated sea rise. This has led to city planners in Boston finally declaring that sea rise was a ‘Near Term Risk’ in August,
2012.
1Source: 1. http://www.npr.org/2012/08/21/159551828/boston-plans-for-near-term-risk-of-rising-tides
BOSTON SEA RISE = 4 x GLOBAL AVERAGE
17
1.2 - Introduction - Urban Sea Rise Vulnerability
are just above sea level. Given that sea rise due to climate change is expected to reach as much as 0.6 meters by 2050 and over 2.0 meters by 2100, the city as a whole could
revert to it’s 1880 size (Figure 05).5 More than 30% of the neighborhood of East Boston
would be submerged at high tide (not to mention storm surge).
Historical waterfront projects not only represent areas of risk for cities, but also demonstrate a capacity for large-scale transformation of the water’s edge. If designed thoughtfully, sea rise preparation has the potential to be the next phase of their waterfront development lineage. The urban waterfront territory has historically been
and can continue to play a critical role in the coastal city’s economy and identity.6
PHYSICAL & SOCIAL VULNERABILITY
Especially within these low-lying territories, mitigation strategies need to address the ramifications of hazards including land loss, disrupted linkages in transportation networks, and increasing threat of storms to private and public property due to climate change. As seen in NYC during Hurricane Sandy on October 28, 2012, underground public infrastructure systems like subway become very vulnerable to flooding and dependent on effective local scale flood defense strategies. Without the investment of sea rise mitigation infrastructures, cities will find themselves repeatedly paying for
disaster cleanup.7
Similar to complex infrastructure networks, interwoven economic and social ties make cities more vulnerable to sea rise than less densely populated areas. The success of cities is measured by economic growth. Agglomeration benefits due to proximity of activities to one another in a city create a complex web of interrelationships that extends
5. Eaton, Sam. Sea Levels May Rise Faster than Expected, Public Radio International, Decem-ber 6, 2011. http://www.theworld.org/2011/12/sea-levels-may-rise-faster-than-expected/. Accessed November 9, 2012.
6. Desfor, Laidley, Stevens and Schubert. Transforming Urban Waterfronts: Fixity and Flow. 2011, Routledge, New York, NY.
7. Transit systems struggling to restart. Marnie Hunter and Katia Hetter, CNN. Updated 12:55 PM EDT, Tue October 30, 2012. Accessed online November 5, 2012. http://www.cnn. com/2012/10/28/travel/tropical-weather-transportation/index.html
& ADDRESS LOCAL NEEDS FOR RESILIENCE
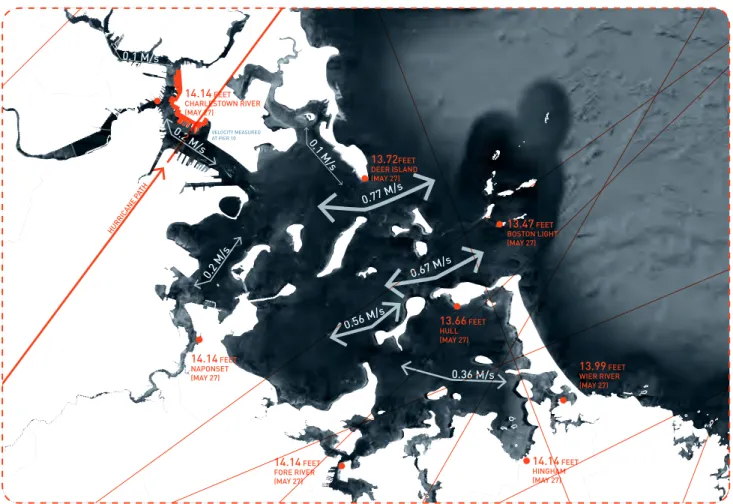
13.47 FEET BOSTON LIGHT (MAY 27) 13.66 FEET HULL (MAY 27) 14.14 FEET HINGHAM (MAY 27) 14.14 FEET FORE RIVER (MAY 27) 14.14 FEET NAPONSET(MAY 27) 13.99WIER RIVER FEET
(MAY 27) 13.72FEET DEER ISLAND (MAY 27) 14.14 FEET CHARLESTOWN RIVER (MAY 27) VELOCITY MEASURED AT PIER 10 * HURRIC ANE P ATH 0.2 M/s 0.2 M/s 0.36 M/s 0.56 M/s 0.1 M/s 0.1 M/s 0.77 M/s 0.67 M/s
It is essential to understand the landmaking history of Boston and have a sense of the timescale at hand to inform future
decisions. It also shows how short-term planning needs to be part of a wholistic plan that takes into consideration future
risks. This thesis project will focus on the main sea rise prediction benchmarks of 2050 and 2100 for planning projections.
Source: http://state_of_coast.noaa.gov/bulletins/html/pop_01/pop.html
CLIMATE CHANGE AND STORMS
19
1.2 - Introduction - Urban Sea Rise Vulnerability
HISTORIC STORMS HAVE
DELIVERED SURGES AS HIGH
AS
4.6 METERS
TO THE BOSTON
COASTLINE (FIGURES 3, 5,6)!
2<
into current and future flood-prone areas. If unaddressed, sea rise could result in productivity decline and negative economic repercussions of land use shift (refer to
section 3.0 for land tenure mapping studies).8 In addition to high economic cost, urban
population growth is anticipated to continue and put pressure on cities to continue to allow development in vulnerable waterfront areas. The influx of people need a place to live and work and it is in the city’s financial interest to grow. This pressure could exacerbate the aforementioned social vulnerabilities.
The slow-onset of sea rise due to climate change makes it less prominent in media and less of a priority to citizens than other more visible safety concerns. Chronic effects of sea rise can lead to greater vulnerability because they are more readily dismissed than catastrophic effects of storm surges from hurricanes. The media coverage of recent coastal storms like Sandy, Katrina, and Ike has begun to raise public awareness to the hazard of coastal living. There has been increasing momentum to taking defensive action along the East Coast at a government level. The sooner action is taken, the better, and more likely that the solution will be able to adjust to climate change in a way that dovetails with the urban context (unlike what has been done in the Maldives). CONCLUSION
We can see that the sum of sea rise vulnerability in the city is a combination of physical and social layers of vulnerability. Such a layered issue inherently demands a layered response. This thesis posits that within the emerging sea rise resilience discourse, what is missing in city context is a means of simultaneously address the needs for resiliency and development capacity. In the urban context, the question is not whether to develop the waterfront, but how. Productive coastal defense will require the hybrid-ization of mitigation tools to create a multi-layered framework for physical sea rise resilience. Social resilience is enhanced by accommodating future development. In this way, the anticipation of climate change can become a catalyst for innovation. This outcome will not happen by chance. Individuals, communities and institutions must choose to make this happen and take action soon.
8. Ghosh, S. N. Flood Control and Drainage Engineering. 2nd ed. Rotterdam ; Brookfield, VT: A.A. Balkema, 1997.
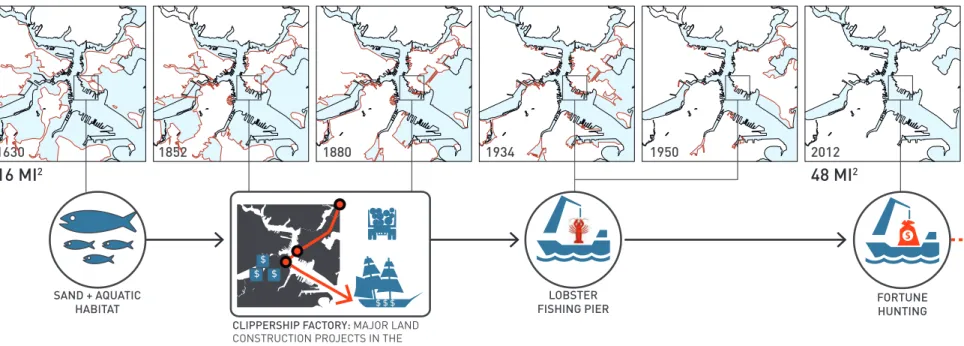
1630 1852 1880 1934 1950 2012 2100
CLIPPERSHIP FACTORY: MAJOR LAND CONSTRUCTION PROJECTS IN THE INTEREST OF PRODUCTION
$
$ $
$ $ $
SAND + AQUATIC
HABITAT FISHING PIERLOBSTER FORTUNE HUNTING RISK DISASTER
16 MI2 48 MI2 20 MI2?
BOSTON LANDMAKING & WATERFRONT HISTORY
It is essential to understand the landmaking history of Boston and have a sense of the timescale at hand to inform future
decisions. It also shows how short-term planning needs to be part of a wholistic plan that takes into consideration future
risks. This thesis project will focus on the main sea rise prediction benchmarks of 2050 and 2100 for planning projections.
source: http://state_of_coast.noaa.gov/bulletins/html/pop_01/pop.html
21
1.2 - Introduction - Urban Sea Rise Vulnerability
1630 1852 1880 1934 1950 2012 2100
CLIPPERSHIP FACTORY: MAJOR LAND CONSTRUCTION PROJECTS IN THE INTEREST OF PRODUCTION
$
$ $
$ $ $
SAND + AQUATIC
HABITAT FISHING PIERLOBSTER FORTUNE HUNTING RISK DISASTER
16 MI2 48 MI2 20 MI2?
The following chapters of this book build a methodical framework for selecting and evaluating combinations of sea rise mitigation strategies that can be applied to work with urban waterfront development in a productive and urban lifestyle enhancing way. Section 1.3 will look at the regulatory framework that helps understand the areas of vulnerability in the city. Chapter two builds an understanding of what it means to be resilient and adaptable as goals for urban sea rise mitigation systems. Chapter three takes on the specific urban context of Boston and the neighborhood of East Boston to observe layers of urban vulnerability and develops parameters for building resilience. In chapter four these criteria are applied to proposed hybrid methods of mitigation and speculates the resultant performance of hybrids of two or more of these approaches. Through the design of these hybrid typologies, Chapter five reflects on how well this thesis answers the question of how to make architecture in a performative environment for climate change.
THESIS QUESTION:
HOW TO MAKE ARCHITECTURE IN A PERFORMATIVE URBAN ENVIRONMENT
FOR SEA RISE?
Sea rise mitigation action will soon be taken in coastal cities and NOW is a critical time for architects to intervene in this process with good design that takes on the issue of sea rise in the city, opportunistically as a catalyst to create a dynamic interface between city and sea.
23
1.3 - Introduction - Existing Regulatory Framework
There are guidelines in place at multiple scales that restrict development in flood-prone areas. On any given building site there are federal, regional, and local acts dictating the physical construction that can occur. Insurance costs in flood areas are also a very influential driver of coastal development. In that way, it building restrictions are partly governed by statistics and historic storm events. Building codes and legislation acts have been passed down through generations and are a form of collective memory and intelligence. They can be used to gain insight to some effective physical flood prevention measures that are already in place as well as the important role that policy will play in the urban resilience-building process. The main challenge of these regulations into future and their applicability to sea rise scenarios is their ability to accommodate uncertainty.
The Flood Control act of 1936 was the first federal regulation of floodplain. It established criteria for a project within a floodplain stating that the benefits ‘must exceed the cost to whomsoever they accrue’. This was aimed at preventing the constructions that manipulate waterflow in ways that put other’s property at risk. Prior to the act, local construction of dams had resulted in the flooding of other people’s land. This law can be extrapolated to sea rise mitigation measures duty today to be considerate of the full impact such to ensure that local actions don’t put others at risk either at present or in the foreseeable future (or has overcapacity for flood to accommodate uncertain future needs).
Today, a national level, The Federal Emergency Management Agency (FEMA) offers guidelines for construction in flood prone areas as part of the National Flood Insurance Program (NFIP). In order to receive flood insurance, structures must comply with their construction guidelines. NFIP ‘Wet Floodplain Requirements Technical Bulletin 7-93’ sets requirements for building within flood prone areas through their ‘Wet Construc-tion Guidelines’. Wet Floodplain ConstrucConstruc-tion is a method of constructing structures that plan for the entry and exit of water into the construction (from foundations, floors, walls, finishes, and electrical). Aside from a few variances, such as seafood processing and other farming activities, the programmed space must be above floodwaters and
the wet areas are reserved for parking and some storage.1 However, they identify
1. Wet Floodproofing Requirements for Structures Located in Special flood Hazard Areas in
EXISTING REGULATORY FRAMEWORK
RESPONSIVE
HARD SOFT
Boston, 1988 England, 1982
Antonio Di Mambro proposes sea gate to control sea rise in Boston Harbor.
Thames River Barrier constructed
BioRock invented, 1979
A great leap forward in artificial reef construction - electromagnetic charges attract reef growing limestone deposits to an underwater cage structure, creating a resilient and soft underwater infrastructure.
Rigs to Reefs, Pensacola, FL, 1979
Rigs to reefs program begins to abandon decommissioned oil rigs.
Floating Dorm, Boston, MA 1960
Designed by George Pilarge, Edward Halsay, and Ted Nederman under Kenzo Tange ‘s guidance. This floating dormitory for the Boston Harbor was to accommodate 25,000 residents.
Floating Villages, Vietnam 1991
The introduction of motorboats drastically changed the lifestyle of locals in Halong Bay, Vietnam. It allowed them to create permanent floating settlements and use motorized boats for fishing.
Artificial reefs invented, Japan 1700’s
first invented in Japan to improve fishing, fist reefs were in the form of rocks and rubble to grow kelp. The technique was later brought to the United States in 1830’s. Building reefs as an ecological endeavor did not begin until 1950.
Netherlands, 1953
Dutch Megastructure project, Deltaworks constructed to respond to 1950’s storm surge.
Boston, 1848
Introduce public water supply, pushing the city outwards to North and South Ends, then Charleston, East Boston, South Boston, and Roxbury.
Boston, 1800’s
Embark on large scale land expansion projects probably modeled after Dutch model of diking, pumping, and draining to reclaim land from the sea
Netherlands, BCE until -1700’s
The dutch began constructing polders for farming long before it was used as flood control.
Boston, MA, 1630
city founded upon hill
CHARLESTON, SC, 1990
a broad buffer of wetland lines the city edge along with flexibly programmed buildings to accommodate periods of inundation on the ground floor. This elasticity allows floodwater to inundate and recede without disturbance.
OSAKA, JAPAN, 1991
Kansai International Airport near Osaka was designed with adjustable columns to compensate for the sinking island.
ZAANDAM, NL, 1998
Recently, England was looking to buy two floating prisons to detain extra criminals.
ROTTERDAM, NL, 2001
The salvage and transport giant, Mammoet van Seumeren floated this 10 storey office building a few dozen miles on a floating foundation.
RISING CURRENTS, NEW YORK, NY, 2010
RISING CURRENTS PROJECTS
Rising Currents proposals exhibit a range of ‘soft’ infrastructure approaches and programs including aquaculture, artificial reef construction, recreation and wetland construction.
Several of the rising currents projects fall into more than one category of approach.
ELIZABETH CITY,VA, 2009
The University of Virginia launched the world’s first floating wetland classroom into the Elizabeth River, USA.
MALDIVES, 2010
Designs for the ‘Floating State of the Maldives’ created as a response to sea rise.
NEW ORLEANS, 2010 VENICE, 2012
Five years after Katrina, the Lake Borgone Surge Barrier is constructed.
The city formed similarly to East Boston completes the ‘MOSE’ surge/ sea barrier. Halvencity in Hamburg was a major
renovation project including terraced public spaces and the waterproofing of existing buildings
ROTTERDAM, 1991
Construction of the Maeslant Barrier begins. The barrier is considered the worlds largest moving structure and was designed to protect Rotterdam from storm surges in foul weather and allowing boat traffic normally.
NETHERLANDS, 2003
Oolderhuuske Marina is a resort which adapted it’s residences to float with seasonal flooding.
‘RAILS TO REEFS’, 2003
100 Redbird subway cars from New York City deployed off the New Jersey Coast. The cars corroded.
NETHERLANDS, 1995 NETHERLANDS, 1990
Aquavista is a housing development in Rotterdam including amphibious and floating structures
NETHERLANDS, 1998
Gouden Kust development included amphibious and floating structures. Local owners invested in their own home.
NETHERLANDS, 2001
Steigereiland, Ijburg included floating structures in the city and a new living paradigm
NETHERLANDS, 2009
Nesselande, Rotterdam included mostly amphibious structures
‘Working Waterline’
‘Water Proving Ground’ ‘New Aqueous City’
‘New Urban Ground’
‘Oyster-tecture’
1990 2000 2010 2012
1600 1700 1800 1900 2050 2100
New England, 1978
During the Blizzard of 1978 fifty foot storm surge completely wiped out houses along the coast.
1978 BLIZZARD: 4.6 M STORM SURGE (MASSACHUSETTS COASTLINE) 1938 ‘LONG ISLE. EXPRESS’ HURRICANE: 3.6 M STORM SURGE 1.2M 1.5M 1.8M 2.1M 0.6 M 0 M 0.9M 0.3 M -0.3 M 1.8 M, INCREASED FREQUENCY OF
STORM SURGE - ONCE IN A CENTURY FLOOD IS EXPECTED TO OCCUR EVERY 2-3 YEARS BY 2050.
ROLE OF DESIGN:
TO VISUALIZE
THIS FUTURE
>
>
>
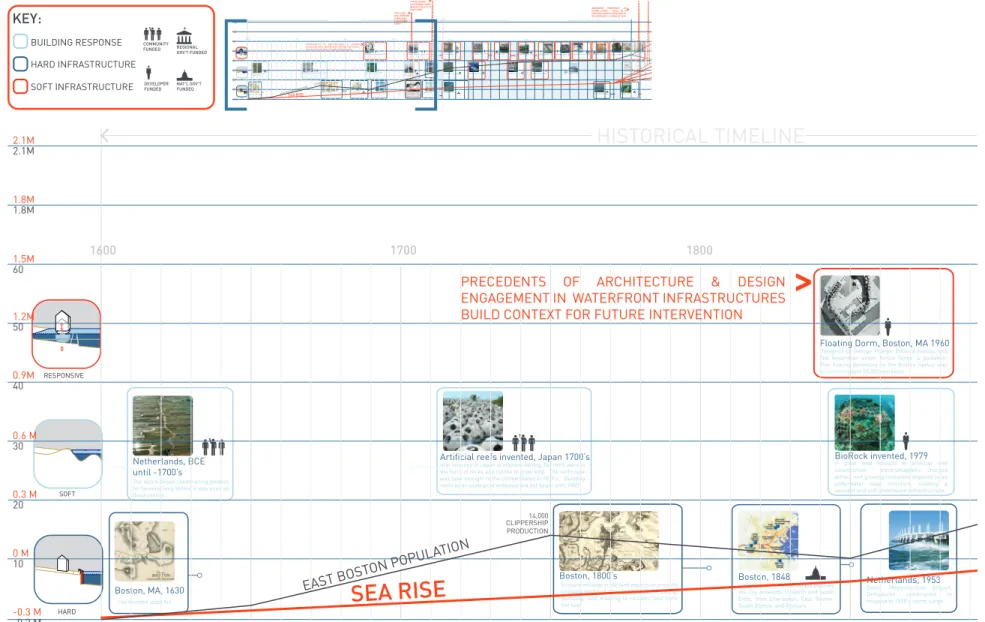
SEA RISE
PRECEDENTS OF ARCHITECTURE & DESIGN ENGAGEMENT IN WATERFRONT INFRASTRUCTURES BUILD CONTEXT FOR FUTURE INTERVENTION
>
50 60 1.8M 2.1M 30 10 40 20 32,941 38,413 CLIPPERSHIP PRODUCTION 14,000 2010 CENSUS: 40,508 PPL POPULATION GOAL: 80,000 DANGER: THE CITY IS LOST10,000 ppl.
-0.3 M
EAST BOSTON POPULA TION EX ODUS DUE TOLAND LOS S + REPERCUS SIONS
EXPANDED CONTEMPORARY TIMELINE
HISTORICAL TIMELINE
0.6M, IPCC, 2007 LOW END, THERMAL EXPANSION ONLY 1M, IPCC, 2007
HIGH END, THERMAL EXPANSION ONLY
BINDSCHADLER AND BURKETT, THEWORLD.ORG - THERMAL EXPANSION + OBSERVED ICE CAP MELTING
2.1+ M
RESPONSIVE HARD SOFT Boston, 1988 England, 1982Antonio Di Mambro proposes sea gate to control sea rise in Boston Harbor.
Thames River Barrier constructed
BioRock invented, 1979
A great leap forward in artificial reef construction - electromagnetic charges attract reef growing limestone deposits to an underwater cage structure, creating a resilient and soft underwater infrastructure.
Rigs to Reefs, Pensacola, FL, 1979Rigs to reefs program begins to abandon decommissioned oil rigs.
Floating Dorm, Boston, MA 1960
Designed by George Pilarge, Edward Halsay, and Ted Nederman under Kenzo Tange ‘s guidance. This floating dormitory for the Boston Harbor was to accommodate 25,000 residents.
Floating Villages, Vietnam 1991
The introduction of motorboats drastically changed the lifestyle of locals in Halong Bay, Vietnam. It allowed them to create permanent floating settlements and use motorized boats for fishing.
Artificial reefs invented, Japan 1700’s
first invented in Japan to improve fishing, fist reefs were in the form of rocks and rubble to grow kelp. The technique was later brought to the United States in 1830’s. Building reefs as an ecological endeavor did not begin until 1950.
Netherlands, 1953
Dutch Megastructure project, Deltaworks constructed to respond to 1950’s storm surge.
Boston, 1848
Introduce public water supply, pushing the city outwards to North and South Ends, then Charleston, East Boston, South Boston, and Roxbury.
Boston, 1800’sEmbark on large scale land expansion projects probably modeled after Dutch model of diking, pumping, and draining to reclaim land from the sea
Netherlands, BCE until -1700’s
The dutch began constructing polders for farming long before it was used as flood control.
Boston, MA, 1630
city founded upon hill
CHARLESTON, SC, 1990
a broad buffer of wetland lines the city edge along with flexibly programmed buildings to accommodate periods of inundation on the ground floor. This elasticity allows floodwater to inundate and recede without disturbance.
OSAKA, JAPAN, 1991
Kansai International Airport near Osaka was designed with adjustable columns to compensate for the sinking island.
ZAANDAM, NL, 1998
Recently, England was looking to buy two floating prisons to detain extra criminals.
ROTTERDAM, NL, 2001
The salvage and transport giant, Mammoet van Seumeren floated this 10 storey office building a few dozen miles on a floating foundation.
RISING CURRENTS, NEW YORK, NY, 2010 RISING CURRENTS PROJECTS
Rising Currents proposals exhibit a range of ‘soft’ infrastructure approaches and programs including aquaculture, artificial reef construction, recreation and wetland construction.
Several of the rising currents projects fall into more than one category of approach.
ELIZABETH CITY,VA, 2009
The University of Virginia launched the world’s first floating wetland classroom into the Elizabeth River, USA.
MALDIVES, 2010
Designs for the ‘Floating State of the Maldives’ created as a response to sea rise.
NEW ORLEANS, 2010 VENICE, 2012
Five years after Katrina, the Lake Borgone Surge Barrier is constructed.
The city formed similarly to East Boston completes the ‘MOSE’ surge/ sea barrier. Halvencity in Hamburg was a major
renovation project including terraced public spaces and the waterproofing of existing buildings
ROTTERDAM, 1991
Construction of the Maeslant Barrier begins. The barrier is considered the worlds largest moving structure and was designed to protect Rotterdam from storm surges in foul weather and allowing boat traffic normally.
NETHERLANDS, 2003Oolderhuuske Marina is a resort which adapted it’s residences to float with seasonal flooding.
‘RAILS TO REEFS’, 2003
100 Redbird subway cars from New York City deployed off the New Jersey Coast. The cars corroded.
NETHERLANDS, 1995 NETHERLANDS, 1990 Aquavista is a housing development in Rotterdam including amphibious and floating structures
NETHERLANDS, 1998
Gouden Kust development included amphibious and floating structures. Local owners invested in their own home.
NETHERLANDS, 2001
Steigereiland, Ijburg included floating structures in the city and a new living paradigm
NETHERLANDS, 2009
Nesselande, Rotterdam included mostly amphibious structures
‘Working Waterline’ ‘Water Proving Ground’ ‘New Aqueous City’ ‘New Urban Ground’
‘Oyster-tecture’
1990 2000 2010 2012
1600 1700 1800 1900 2050 2100
New England, 1978 During the Blizzard of 1978 fifty foot storm surge completely wiped out houses along the coast.
1978 BLIZZARD: 4.6 M STORM SURGE (MASSACHUSETTS COASTLINE) 1938 ‘LONG ISLE. EXPRESS’ HURRICANE: 3.6 M STORM SURGE 1.2M 1.5M 1.8M 2.1M 0.6 M 0 M 0.9M 0.3 M -0.3 M 1.8 M, INCREASED FREQUENCY OF STORM SURGE - ONCE IN A CENTURY FLOOD IS EXPECTED TO OCCUR EVERY 2-3 YEARS BY 2050.
ROLE OF DESIGN: TO VISUALIZE THIS FUTURE > > > SEA RISE
PRECEDENTS OF ARCHITECTURE & DESIGN ENGAGEMENT IN WATERFRONT INFRASTRUCTURES BUILD CONTEXT FOR FUTURE INTERVENTION >
50 60 1.8M 2.1M 30 10 40 20 32,941 38,413 CLIPPERSHIP PRODUCTION 14,000 2010 CENSUS: 40,508 PPL POPULATION GOAL: 80,000 DANGER: THE CITY IS LOST 10,000 ppl. -0.3 M
EAST BOSTON POPULA TION EXODUS DUE TO LAND LOS S + REPERCUS SIONS
EXPANDED CONTEMPORARY TIMELINE
HISTORICAL TIMELINE
0.6M, IPCC, 2007 LOW END, THERMAL EXPANSION ONLY 1M, IPCC, 2007 HIGH END, THERMAL EXPANSION ONLY BINDSCHADLER AND BURKETT, THEWORLD.ORG - THERMAL EXPANSION + OBSERVED ICE CAP MELTING
2.1+ M
KEY:
BUILDING RESPONSE COMMUNITY
FUNDED DEVELOPER FUNDED REGIONAL GOV’T FUNDED NAT’L GOV’T FUNDED SOFT INFRASTRUCTURE HARD INFRASTRUCTURE
CONTEXTUAL TIMELINE - HISTORICAL
RESPONSIVE
HARD SOFT
Boston, 1988 England, 1982
Antonio Di Mambro proposes sea gate to control sea rise in Boston Harbor.
Thames River Barrier constructed
BioRock invented, 1979
A great leap forward in artificial reef construction - electromagnetic charges attract reef growing limestone deposits to an underwater cage structure, creating a resilient and soft underwater infrastructure.
Rigs to Reefs, Pensacola, FL, 1979
Rigs to reefs program begins to abandon decommissioned oil rigs.
Floating Dorm, Boston, MA 1960
Designed by George Pilarge, Edward Halsay, and Ted Nederman under Kenzo Tange ‘s guidance. This floating dormitory for the Boston Harbor was to accommodate 25,000 residents.
Floating Villages, Vietnam 1991
The introduction of motorboats drastically changed the lifestyle of locals in Halong Bay, Vietnam. It allowed them to create permanent floating settlements and use motorized boats for fishing.
Artificial reefs invented, Japan 1700’s
first invented in Japan to improve fishing, fist reefs were in the form of rocks and rubble to grow kelp. The technique was later brought to the United States in 1830’s. Building reefs as an ecological endeavor did not begin until 1950.
Netherlands, 1953
Dutch Megastructure project, Deltaworks constructed to respond to 1950’s storm surge.
Boston, 1848
Introduce public water supply, pushing the city outwards to North and South Ends, then Charleston, East Boston, South Boston, and Roxbury.
Boston, 1800’s
Embark on large scale land expansion projects probably modeled after Dutch model of diking, pumping, and draining to reclaim land from the sea
Netherlands, BCE until -1700’s
The dutch began constructing polders for farming long before it was used as flood control.
Boston, MA, 1630
city founded upon hill
CHARLESTON, SC, 1990
a broad buffer of wetland lines the city edge along with flexibly programmed buildings to accommodate periods of inundation on the ground floor. This elasticity allows floodwater to inundate and recede without disturbance.
OSAKA, JAPAN, 1991
Kansai International Airport near Osaka was designed with adjustable columns to compensate for the sinking island.
ZAANDAM, NL, 1998
Recently, England was looking to buy two floating prisons to detain extra criminals.
ROTTERDAM, NL, 2001
The salvage and transport giant, Mammoet van Seumeren floated this 10 storey office building a few dozen miles on a floating foundation.
RISING CURRENTS, NEW YORK, NY, 2010
RISING CURRENTS PROJECTS
Rising Currents proposals exhibit a range of ‘soft’ infrastructure approaches and programs including aquaculture, artificial reef construction, recreation and wetland construction.
Several of the rising currents projects fall into more than one category of approach.
ELIZABETH CITY,VA, 2009
The University of Virginia launched the world’s first floating wetland classroom into the Elizabeth River, USA.
MALDIVES, 2010
Designs for the ‘Floating State of the Maldives’ created as a response to sea rise.
NEW ORLEANS, 2010 VENICE, 2012
Five years after Katrina, the Lake Borgone Surge Barrier is constructed.
The city formed similarly to East Boston completes the ‘MOSE’ surge/ sea barrier. Halvencity in Hamburg was a major
renovation project including terraced public spaces and the waterproofing of existing buildings
ROTTERDAM, 1991
Construction of the Maeslant Barrier begins. The barrier is considered the worlds largest moving structure and was designed to protect Rotterdam from storm surges in foul weather and allowing boat traffic normally.
NETHERLANDS, 2003
Oolderhuuske Marina is a resort which adapted it’s residences to float with seasonal flooding.
‘RAILS TO REEFS’, 2003
100 Redbird subway cars from New York City deployed off the New Jersey Coast. The cars corroded.
NETHERLANDS, 1995 NETHERLANDS, 1990
Aquavista is a housing development in Rotterdam including amphibious and floating structures
NETHERLANDS, 1998
Gouden Kust development included amphibious and floating structures. Local owners invested in their own home.
NETHERLANDS, 2001
Steigereiland, Ijburg included floating structures in the city and a new living paradigm
NETHERLANDS, 2009
Nesselande, Rotterdam included mostly amphibious structures
‘Working Waterline’
‘Water Proving Ground’ ‘New Aqueous City’
‘New Urban Ground’
‘Oyster-tecture’
1990 2000 2010 2012
1600 1700 1800 1900 2050 2100
New England, 1978
During the Blizzard of 1978 fifty foot storm surge completely wiped out houses along the coast.
1978 BLIZZARD: 4.6 M STORM SURGE (MASSACHUSETTS COASTLINE) 1938 ‘LONG ISLE. EXPRESS’ HURRICANE: 3.6 M STORM SURGE 1.2M 1.5M 1.8M 2.1M 0.6 M 0 M 0.9M 0.3 M -0.3 M 1.8 M, INCREASED FREQUENCY OF
STORM SURGE - ONCE IN A CENTURY FLOOD IS EXPECTED TO OCCUR EVERY 2-3 YEARS BY 2050.
ROLE OF DESIGN:
TO VISUALIZE
THIS FUTURE
>
>
>
SEA RISE
PRECEDENTS OF ARCHITECTURE & DESIGN ENGAGEMENT IN WATERFRONT INFRASTRUCTURES BUILD CONTEXT FOR FUTURE INTERVENTION
>
50 60 1.8M 2.1M 30 10 40 20 32,941 38,413 CLIPPERSHIP PRODUCTION 14,000 2010 CENSUS: 40,508 PPL POPULATION GOAL: 80,000 DANGER: THE CITY IS LOST10,000 ppl.
-0.3 M
EAST BOSTON POPULA TION EX ODUS DUE TOLAND LOS S + REPERCUS SIONS
EXPANDED CONTEMPORARY TIMELINE
HISTORICAL TIMELINE
0.6M, IPCC, 2007 LOW END, THERMAL EXPANSION ONLY 1M, IPCC, 2007
HIGH END, THERMAL EXPANSION ONLY
BINDSCHADLER AND BURKETT, THEWORLD.ORG - THERMAL EXPANSION + OBSERVED ICE CAP MELTING
2.1+ M
25
1.3 - Introduction - Existing Regulatory Framework
several exceptions where working within these guidelines do not suffice. For example, if the rate of rise of water is too fast for people to escape the site, the building must be relocated. This could be prevented if other measures are taken like using natural buffers such as wetland or planted areas to slow the inundation of floodwaters.
At a state level, building codes become an authority. Sections of the Internation-al Building Code (IBC) has been adapted by states to address flooding issues. For example, in Massachusetts, IBC codes 104.10.1 ‘Areas Prone to Flooding’, 107.2.5 ‘Site Plan’ and 110.3.3 ‘Lowest Floor Elevation’, have all been altered to create more
stringent restriction on development within flood prone areas.2 Still, these codes will
not suffice as flooding and storms increase in waterfront zones. Will need to amend these laws to anticipate increased frequency to build resilience and adaptability. More locally along the Boston waterfront, the Massachusetts Public Waterfront Act, Chapter 91, takes precedent. The Act was adopted in 1866 and restricts waterfront developments with the aim to protect the Commonwealth of Massachusetts water bodies from environmental degradation and to preserve them as a publicly accessible
asset.3 By preserving public access, Chapter 91 encourages the public stewardship of
these water’s edge zones, thereby increasing collective sea rise and flood resilience. It also minimizes the variability of the waterfront zone and therefore the possibility that someone can develop the waterfront in a way that will adversely impact those around them.
The aforementioned codes and restrictions were written with seasonal flooding and the occasional storm in mind. Preparations for sea rise differ from contending with tidal and seasonal changes in the level of sea at the land/ sea interface because they introduce the challenge of uncertainty. The existing regulatory framework attempts to build resilience in the built environment to minimize flood risks, but falls short in terms of addressing future uncertainty and only narrowing in on single disciplines. These
accordance with the National Flood Insurance Program. FEMA Technical Bulletin 7-93. 2. Massachusetts Building Code. 8th Edition Base Code. Accessed online: http://www.mass. gov/eopss/consumer-prot-and-bus-lic/license-type/csl/8th-edition-base-code.html. Ac-cessed November 5, 2012.
3. Chapter 91: The Massachusetts Public Waterfront Act. Massachusetts Department of Envi-ronmental Protection. September 2003.
OSAKA, JAPAN, 1991
Kansai International Airport near Osaka was designed with adjustable columns to compensate for the sinking island.
ZAANDAM, NL, 1998
Recently, England was looking to buy two floating prisons to detain extra criminals.
ROTTERDAM, NL, 2001
The salvage and transport giant, Mammoet van Seumeren floated this 10 storey office building a few dozen miles on a floating foundation.
RISING CURRENTS, NEW YORK, NY, 2010
RISING CURRENTS PROJECTS
Rising Currents proposals exhibit a range of ‘soft’ infrastructure approaches and programs including aquaculture, artificial reef construction, recreation and wetland construction.
Several of the rising currents projects fall into more than one category of approach.
ELIZABETH CITY,VA, 2009
The University of Virginia launched the world’s first floating wetland classroom into the Elizabeth River, USA.
MALDIVES, 2010
Designs for the ‘Floating State of the Maldives’ created as a response to sea rise.
NEW ORLEANS, 2010 VENICE, 2012
Five years after Katrina, the Lake Borgone Surge Barrier is constructed.
The city formed similarly to East Boston completes the ‘MOSE’ surge/ sea barrier.
NETHERLANDS, 2003
Oolderhuuske Marina is a resort which adapted it’s residences to float with seasonal flooding.
‘RAILS TO REEFS’, 2003
100 Redbird subway cars from New York City deployed off the New Jersey Coast. The cars corroded.
NETHERLANDS, 1995
Aquavista is a housing development in Rotterdam including amphibious and floating structures
NETHERLANDS, 1998
Gouden Kust development included amphibious and floating structures. Local owners invested in their own home.
NETHERLANDS, 2001
Steigereiland, Ijburg included floating structures in the city and a new living paradigm
NETHERLANDS, 2009
Nesselande, Rotterdam included mostly amphibious structures
‘Working Waterline’
‘Water Proving Ground’ ‘New Aqueous City’
‘New Urban Ground’
‘Oyster-tecture’ 50 60 1.8M 2.1M 30 10 40 20 0 1.2M 1.5M 1.8M 2.1M 0.6 M 0 M 0.9M 0.3 M -0.3 M RESPONSIVE HARD SOFT 2000 2010 2012 2050 2100 1.8 M,
INCREASED FREQUENCY OF STORM SURGE - ONCE IN A CENTURY FLOOD IS EXPECTED TO OCCUR EVERY 2-3 YEARS BY 2050.
ROLE OF DESIGN:
TO VISUALIZE
THIS FUTURE
>
SEA RISE (METERS) 38,413 2010 CENSUS: 40,508 PPL POPULATION GOAL: 80,000 DANGER: 10,000EAST BOSTON POPULA(IN THOUSANDS)TION
EX ODUS DUE TOLAND LOS S + REPERCUS SIONS
EXPANDED CONTEMPORARY TIMELINE
0.6M, IPCC, 2007 LOW END, THERMAL EXPANSION ONLY 1M, IPCC, 2007 HIGH END, THERMAL EXPANSION ONLY BINDSCHADLER AND BURKETT,
THEWORLD.ORG - THERMAL EXPANSION + OBSERVED ICE CAP MELTING
2.1+ M
RESPONSIVE HARD SOFT Boston, 1988 England, 1982Antonio Di Mambro proposes sea gate to control sea rise in Boston Harbor.
Thames River Barrier constructed
BioRock invented, 1979
A great leap forward in artificial reef construction - electromagnetic charges attract reef growing limestone deposits to an underwater cage structure, creating a resilient and soft underwater infrastructure.
Rigs to Reefs, Pensacola, FL, 1979
Rigs to reefs program begins to abandon decommissioned oil rigs.
Floating Dorm, Boston, MA 1960Designed by George Pilarge, Edward Halsay, and Ted Nederman under Kenzo Tange ‘s guidance. This floating dormitory for the Boston Harbor was to accommodate 25,000 residents.
Floating Villages, Vietnam 1991
The introduction of motorboats drastically changed the lifestyle of locals in Halong Bay, Vietnam. It allowed them to create permanent floating settlements and use motorized boats for fishing.
Artificial reefs invented, Japan 1700’s
first invented in Japan to improve fishing, fist reefs were in the form of rocks and rubble to grow kelp. The technique was later brought to the United States in 1830’s. Building reefs as an ecological endeavor did not begin until 1950.
Netherlands, 1953
Dutch Megastructure project, Deltaworks constructed to respond to 1950’s storm surge.
Boston, 1848
Introduce public water supply, pushing the city outwards to North and South Ends, then Charleston, East Boston, South Boston, and Roxbury.
Boston, 1800’s
Embark on large scale land expansion projects probably modeled after Dutch model of diking, pumping, and draining to reclaim land from the sea
Netherlands, BCE until -1700’s
The dutch began constructing polders for farming long before it was used as flood control.
Boston, MA, 1630city founded upon hill
CHARLESTON, SC, 1990
a broad buffer of wetland lines the city edge along with flexibly programmed buildings to accommodate periods of inundation on the ground floor. This elasticity allows floodwater to inundate and recede without disturbance.
OSAKA, JAPAN, 1991
Kansai International Airport near Osaka was designed with adjustable columns to compensate for the sinking island.
ZAANDAM, NL, 1998
Recently, England was looking to buy two floating prisons to detain extra criminals.
ROTTERDAM, NL, 2001
The salvage and transport giant, Mammoet van Seumeren floated this 10 storey office building a few dozen miles on a floating foundation.
RISING CURRENTS, NEW YORK, NY, 2010 RISING CURRENTS PROJECTS
Rising Currents proposals exhibit a range of ‘soft’ infrastructure approaches and programs including aquaculture, artificial reef construction, recreation and wetland construction.
Several of the rising currents projects fall into more than one category of approach.
ELIZABETH CITY,VA, 2009
The University of Virginia launched the world’s first floating wetland classroom into the Elizabeth River, USA.
MALDIVES, 2010
Designs for the ‘Floating State of the Maldives’ created as a response to sea rise.
NEW ORLEANS, 2010Five years after Katrina, the Lake Borgone Surge Barrier constructed. is VENICE, 2012
The city formed similarly to East Boston completes the ‘MOSE’ surge/ sea barrier. Halvencity in Hamburg was a major
renovation project including terraced public spaces and the waterproofing of existing buildings
ROTTERDAM, 1991
Construction of the Maeslant Barrier begins. The barrier is considered the worlds largest moving structure and was designed to protect Rotterdam from storm surges in foul weather and allowing boat traffic normally.
NETHERLANDS, 2003
Oolderhuuske Marina is a resort which adapted it’s residences to float with seasonal flooding.
‘RAILS TO REEFS’, 2003
100 Redbird subway cars from New York City deployed off the New Jersey Coast. The cars corroded.
NETHERLANDS, 1995 NETHERLANDS, 1990 Aquavista is a housing development in Rotterdam including amphibious and floating structures
NETHERLANDS, 1998
Gouden Kust development included amphibious and floating structures. Local owners invested in their own home.
NETHERLANDS, 2001
Steigereiland, Ijburg included floating structures in the city and a new living paradigm
NETHERLANDS, 2009
Nesselande, Rotterdam included mostly amphibious structures
‘Working Waterline’ ‘Water Proving Ground’ ‘New Aqueous City’ ‘New Urban Ground’
‘Oyster-tecture’
1990 2000 2010 2012
1600 1700 1800 1900 2050 2100
New England, 1978 During the Blizzard of 1978 fifty foot storm surge completely wiped out houses along the coast.
1978 BLIZZARD: 4.6 M STORM SURGE (MASSACHUSETTS COASTLINE) 1938 ‘LONG ISLE. EXPRESS’ HURRICANE: 3.6 M STORM SURGE 1.2M 1.5M 1.8M 2.1M 0.6 M 0 M 0.9M 0.3 M -0.3 M 1.8 M, INCREASED FREQUENCY OF STORM SURGE - ONCE IN A CENTURY FLOOD IS EXPECTED TO OCCUR EVERY 2-3 YEARS BY 2050.
ROLE OF DESIGN: TO VISUALIZE THIS FUTURE > > > SEA RISE
PRECEDENTS OF ARCHITECTURE & DESIGN ENGAGEMENT IN WATERFRONT INFRASTRUCTURES BUILD CONTEXT FOR FUTURE INTERVENTION >
50 60 1.8M 2.1M 30 10 40 20 32,941 38,413 CLIPPERSHIP PRODUCTION 14,000 2010 CENSUS: 40,508 PPL POPULATION GOAL: 80,000 DANGER: THE CITY IS LOST 10,000 ppl. -0.3 M
EAST BOSTON POPULA TION EXODUS DUE TOLAND LOSS + REPERC USSIONS
EXPANDED CONTEMPORARY TIMELINE
HISTORICAL TIMELINE
0.6M, IPCC, 2007 LOW END, THERMAL EXPANSION ONLY 1M, IPCC, 2007 HIGH END, THERMAL EXPANSION ONLY BINDSCHADLER AND BURKETT, THEWORLD.ORG - THERMAL EXPANSION + OBSERVED ICE CAP MELTING
2.1+ M
Figure 07. Contemporary Sea Rise Timeline
CONTEXTUAL TIMELINE - CONTEMPORARY
OSAKA, JAPAN, 1991
Kansai International Airport near Osaka was designed with adjustable columns to compensate for the sinking island.
ZAANDAM, NL, 1998
Recently, England was looking to buy two floating prisons to detain extra criminals.
ROTTERDAM, NL, 2001
The salvage and transport giant, Mammoet van Seumeren floated this 10 storey office building a few dozen miles on a floating foundation.
RISING CURRENTS, NEW YORK, NY, 2010
RISING CURRENTS PROJECTS
Rising Currents proposals exhibit a range of ‘soft’ infrastructure approaches and programs including aquaculture, artificial reef construction, recreation and wetland construction.
Several of the rising currents projects fall into more than one category of approach.
ELIZABETH CITY,VA, 2009
The University of Virginia launched the world’s first floating wetland classroom into the Elizabeth River, USA.
MALDIVES, 2010
Designs for the ‘Floating State of the Maldives’ created as a response to sea rise.
NEW ORLEANS, 2010 VENICE, 2012
Five years after Katrina, the Lake Borgone Surge Barrier is constructed.
The city formed similarly to East Boston completes the ‘MOSE’ surge/ sea barrier.
NETHERLANDS, 2003
Oolderhuuske Marina is a resort which adapted it’s residences to float with seasonal flooding.
‘RAILS TO REEFS’, 2003
100 Redbird subway cars from New York City deployed off the New Jersey Coast. The cars corroded.
NETHERLANDS, 1995
Aquavista is a housing development in Rotterdam including amphibious and floating structures
NETHERLANDS, 1998
Gouden Kust development included amphibious and floating structures. Local owners invested in their own home.
NETHERLANDS, 2001
Steigereiland, Ijburg included floating structures in the city and a new living paradigm
NETHERLANDS, 2009
Nesselande, Rotterdam included mostly amphibious structures
‘Working Waterline’
‘Water Proving Ground’ ‘New Aqueous City’
‘New Urban Ground’
‘Oyster-tecture’ 50 60 1.8M 2.1M 30 10 40 20 0 1.2M 1.5M 1.8M 2.1M 0.6 M 0 M 0.9M 0.3 M -0.3 M RESPONSIVE HARD SOFT 2000 2010 2012 2050 2100 1.8 M,
INCREASED FREQUENCY OF STORM SURGE - ONCE IN A CENTURY FLOOD IS EXPECTED TO OCCUR EVERY 2-3 YEARS BY 2050.
ROLE OF DESIGN:
TO VISUALIZE
THIS FUTURE
>
SEA RISE (METERS) 38,413 2010 CENSUS: 40,508 PPL POPULATION GOAL: 80,000 DANGER: 10,000EAST BOSTON POPULA(IN THOUSANDS)TION
EX ODUS DUE TOLAND LOS S + REPERCUS SIONS
EXPANDED CONTEMPORARY TIMELINE
0.6M, IPCC, 2007 LOW END, THERMAL EXPANSION ONLY 1M, IPCC, 2007 HIGH END, THERMAL EXPANSION ONLY BINDSCHADLER AND BURKETT,
THEWORLD.ORG - THERMAL EXPANSION + OBSERVED ICE CAP MELTING
2.1+ M
27
1.3 - Introduction - Existing Regulatory Framework
regulations are further illustration of the lack of coordination between architecture and other flood mitigation strategies. What is needed is a coordinated interdisciplinary approach for coastal development. FEMA provides construction guidelines for building in the flood zones, Chapter 91 acknowledges the broader impact of development in these areas, and local building codes attempt to restrict development, but what is lacking is a way of bringing various protective measures together to form a holistic, sustainable waterfront sea rise strategy.
CONCLUSION
Combining this knowledge of contemporary precedents, the issues of urban vulner-ability, and current regulatory framework in place, this thesis seeks to contributes two things to the field of urban sea rise mitigation; (1) it identifies the need for layered approach to address layered problem of urban sea rise and (2) proposes a preliminary qualitative method of anticipating or predicting how layers of such a mitigation strategy will perform together.
Thesis also makes a contribution by addressing some of the shortcomings of the precedents shown on this timeline (Figures 06-07) which: treated architecture and in-frastructure separately, did not take advantage of the dynamic nature of ocean and had no apparent anticipation of action of time on the projects. To better integrate these layers, the project takes on multiple scales from the urban edge to building. The urban plan that has helped to locate a project site and in turn, the architecture project has then given a better understanding of the conditions created by the urban intervention.
GLOBAL
WARMING
SEA RISE
FLOODING CITY WATERFRONT
CURRENT SOLUTION LIMITATIONS
PROPOSED APPROACH
APPROACH STUDY
HARD EDGE MITIGATION - REACTIVE RESPONSE POST DISASTER RESPONS(IBILITY)
ARCHITECT BEAUTIFIES MITIGATION RESPONSIBILITY
ADAPTIVE MITIGATION
ARCHITECTURE + INFRASTRUCTURE HYBRID HARD + SOFT SOLUTIONS SUSTAINABLE DEFENSE EXPIRATION DATE FINANCIAL COST LEVEE EFFECT
HAZARDS
LAND LOSS TRANSPORTATION DAMAGE CULTURAL HERITAGEECONOMIC REPRUCUSSIONS/ LAND USE SHIFT PRODUCTIVITY DECLINE
POPULATION DECLINE
PHILOSOPHY:
ROLE OF THE ARCHITECT ADAPTABILITY
TECHNOLOGY:
PRECEDENTS
SURVEY TOOLS FROM OTHER DISCIPLINES
FINANCE:
PRODUCTIVE PROGRAMS SELF-SUFFICIENTCY
LITERATURE REVIEW
PEER REVIEW JOUNALS IPCC 2007
GREY PAPERS BOOKS WEBSITES
LOCAL AGENCIES (CZM, BHA) UNIVERSITY STUDIES (TUFTS SOIL) GIS, MASSGIS
DATA SOURCES/
RESEARCH TOOLS
HUMAN RELEASED CO2RESEARCH METHODOLOGY
29
2.1 - Research - Criteria for Resilience & Adaptability
There are multiple and contending definitions of what resilience and adaptability are in the context of sea rise and climate change. This chapter will define these terms as gradients of performance with regards to climate change (gradual sea rise) and storms (sudden inundation). The assumption is made that existing sea rise mitigation tools, like those used in the Maldives, Chapter 1.1, are all striving to achieve resilience and adaptability, and that they can be characterized as achieving some level of each. In Appendix 6.1, the following definitions of ‘Low’, ‘Medium’, and ‘High Resilience’ and ‘Low’, ‘Medium’, and ‘High Adaptability’ are applied to the full range of mitigation tools, thus allowing for qualitative comparison of these tools as well as inference into how they would perform as hybrids.
The hypothesis of this thesis is that when these usually independently employed mitigation techniques are used together to create a sectionally layered approach, the resulting performance is greater than the sum of parts. By partnering with other sea rise mitigation measures; architecture can contribute to sea rise adaptability and resilience by addressing the need for development and infrastructure stewardship by occupying waterfront zones.
URBAN RESILIENCE
Resilience is the ability of a system to maintain it’s structure, identity, feedback and
function when subject to disruptive forces.1 A few synonyms of the word ‘resilient’
are: bouncy, buoyant, effervescent, elastic, hardy, plastic, pliable, rebounding, springy, stretchy, strong, supple, and tough. Definition of successful urban sea rise resilience as ‘bouncing back’ does not accurately reflect the realities of post-disaster scenario. After a disaster has taken place, a hurricane, Nor’easter, etc., the affected community rebuilding activities undertaken present community members with a new reality that
differs in several fundamental ways from that prevailing pre-disaster.2
For the purposes of this paper, the term ‘resilience’ is used to describe those
charac-1. Walker, B., et al. “Resilience, Adaptability and Transformability in Social--Ecological Sys-tems.” Ecology and society 9.2 (2004): 5
2. Paton, Douglas and Johnson, David. Disaster Resilience: An Integrated Approach. Charles C Thomas Publisher, Ltd. Springfield, Illinois 2006.
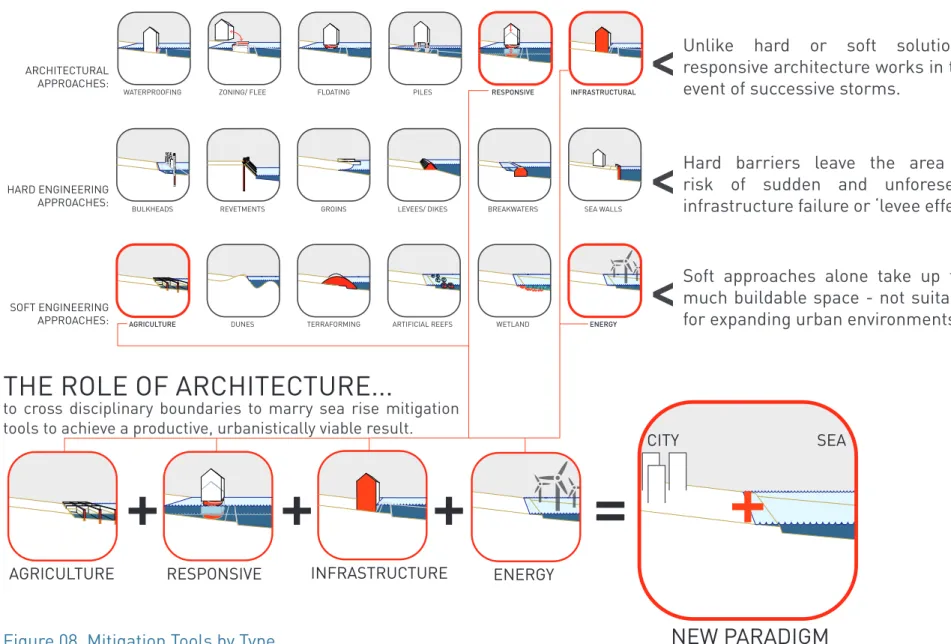
HARD ENGINEERING APPROACHES: ARCHITECTURAL APPROACHES: SOFT ENGINEERING APPROACHES:
BULKHEADS REVETMENTS GROINS LEVEES/ DIKES BREAKWATERS SEA WALLS
AGRICULTURE DUNES TERRAFORMING ARTIFICIAL REEFS WETLAND ENERGY
WATERPROOFING ZONING/ FLEE FLOATING PILES RESPONSIVE INFRASTRUCTURAL
AGRICULTURE ENERGY CITY SEA
NEW PARADIGM
RESPONSIVE+
+
+
=
+
INFRASTRUCTURETHE ROLE OF ARCHITECTURE...
TOOLS OF SEA RISE MITIGATION
Hard barriers leave the area at
risk of sudden and unforeseen
infrastructure failure or ‘levee effect’
Unlike hard or soft solutions,
responsive architecture works in the
event of successive storms.
<
<
<
Soft approaches alone take up too
much buildable space - not suitable
for expanding urban environments.
Figure 08. Mitigation Tools by Type
to cross disciplinary boundaries to marry sea rise mitigation tools to achieve a productive, urbanistically viable result.
31
2.1 - Research - Criteria for Resilience & Adaptability
teristics that can be cultivated in a mitigation strategy to better withstand a disaster as well as recover quickly from it. In contrast with ‘risk management’ and reactionary or recovery approaches, resilience identifies and enhances positive attributes of an ecosystem. In Risk Society, Urlich Beck argues that we have become paralyzed by efforts to manage risk, inhibiting our ability as a society to respond to hazards in resilient
ways.3 An important part of building resilience is social awareness and education to
avoid this paralysis.
This thesis uses the six traits that characterize resilience as defined by Wildavsky.4
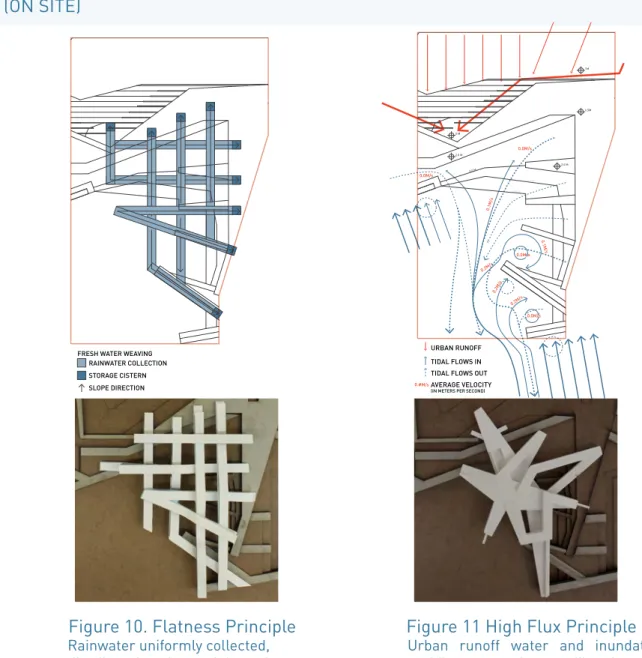
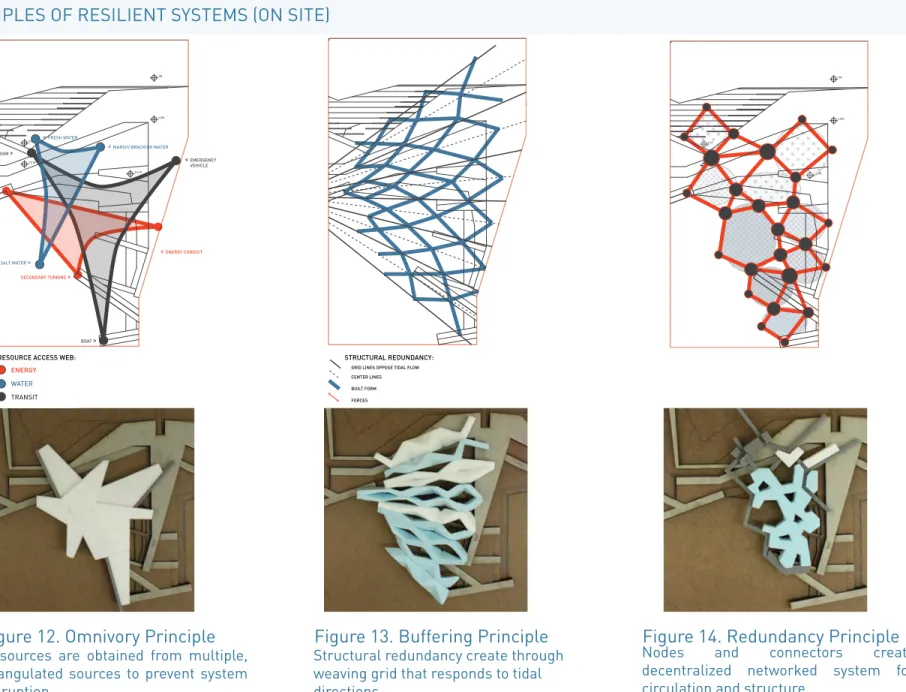
First is the ‘Homeostasis’ principle, which holds that the system is maintained by feedback loops between it’s components(Figure 09). These feedback loops signal changes and enable learning. Second is the ‘Omnivory’ principle, which holds that external shocks are mitigated by the diversification by which resources are delivered (Figure 12). Thus, the more diverse the resources, the less likely the supply of vital systems will falter. For example, the incorporation of decentralized energy systems can increase resilience by providing alternative energy modes if the centralized urban energy distribution is impaired by fallen branches in a storm. Third is the ‘High Flux’ principle, which holds that the faster resources move through a system, the more likely they are to be available at any given time (Figure 11). An example of this in sea rise tools is an efficiently designed wetland where water filters through it so quickly that it increases the resilience of that land in a flood or storm scenario. Fourth is the ‘Flatness‘ principle, which proposes that the reduction of hierarchy in a system (Figure 10) makes the whole system more resilient. A direct application of this principle might be in the structural system for a surge breaker. Tetrapods, a type of breakwater, make resilient surge breakers because each unit is able to take on as much as the next. This allows the whole to gradually shift and adapt to tidal and storm forces. The fifth principle is the ‘Buffering’ principle, which refers to the surplus or slackness in a system (Figure 13). A tidal basin, which has overcapacity to satisfy some tributary area, is an example of this principle. The sixth and final principle is the ‘Redundancy’ principle, by which interchangeable parts allow vital functions to continue while formerly redundant elements take on new functions (Figure 14). Piggybacking on the previous example, if
3. Beck, Ulrich. Risk Society: Towards a New Modernity. London: Sage Publications, 1992. 4. Barnett, Jon. “Adapting to Climate Change in Pacific Island Countries: The Problem of Un-certainty.” World Development 29.6 (2001): 977-93.
REFER TO APPENDIX 6.1 FOR A COMPREHENSIVE CATALOG OF SINGLE MEANS MITIGATION TOOLS BY DISCIPLINE & THEIR ADAPTABILITY / RESILIENCE RATING .
<
PRINCIPLES OF RESILIENT SYSTEMS (ON SITE)
1M 6.5M -5.0 M 0.0 M -8.0 M 2.0 M 2.0 M 0 M URBAN RUNOFF TIDAL FLOWS IN TIDAL FLOWS OUT AVERAGE VELOCITY (IN METERS PER SECOND) 0.#M/s 0.2M/s 0.2M/s 0.2M/s 0.0M/s 0.0M/s 0.0M/s 0.1M/s 0.1M/s 0.0M/sFRESH WATER WEAVING RAINWATER COLLECTION STORAGE CISTERN SLOPE DIRECTION MARSH GEOLOGY PUMP STATION WATER RESOURCES RECREATION AQUACULTURE 2 BUILDING TECHNOLOGY AQUACULTURE 1 ENERGY + PHYSICS CHEMISTRY WETLAND BIOLOGY AVERAGE VELOCITY ~0.0 M/s (slow) ~0.1 M/s ~0.2 M/s ~0.3 M/s (fast) DEPTH >0.0 M (shallow) -5 TO -0.0 M -9 TO -5.0M < -9.0 M (deep)
Figure 09. Homeostasis Principle
Urban runoff water and inundation rapidly conveyed, readily absorbed and filtered through loop system. Rainwater uniformly collected,
distributed and stored through non-heriarchical grid.
System is lens for unique site conditions for educational study - creating dynamic homeostasis.

![[PDF] Architecture générale des réseaux informatiques - cours informatique](data:image/gif;base64,R0lGODlhAQABAIAAAP///wAAACH5BAEAAAAALAAAAAABAAEAAAICRAEAOw==)