Aircraft Engine Performance Improvements Using Multistage Compressors with Actively Controlled Stall Lines
by
Kevin Robert Tow
S.B. Aeronautics and Astronautics Massachusetts Institute of Technology
(1989)
Submitted in Partial Fulfillment of the
Requirements for the degree of
MASTER of SCIENCE in MECHANICAL ENGINEERING at the
Massachusetts Institute of Technology
February 1994
© Kevin R. Tow, 1994 all rights reserved
The author hereby grants to MIT permission to reproduce and to distribute copies of this thesis in whole or in part.
/3
-..1Signature of Author r -- -
-Department of Mechanical Engineering
,a
'
o)
January 14,1994Certified by
Certified by
*.. -I ... ,V.9~ '-- - )" I ' -r-- -.--- .
- Alan H. Epstein
Professor of Aeronautics and Astronautics
. .. ... - . .
David ( n Wilson
- wh >-f XA,
chanic;
gineering
Accepted by
--
-- .. o... 7:7':i:~}~;:}~;:, ,4 U ~ , dn Sonin
e4p t; m" '
Chairman, G ate Office r -?a aC'~ 19hDepartment .. of Mechanic,: .nigineering
__I __
Aircraft Engine Performance Improvements Using Multistage Compressors with Actively Controlled Stall Lines
Abstract
Recent experiments have demonstrated that a compressor stall line may be suppressed by active control schemes. The instability suppression results in a higher stall line by reducing the stalling flow coefficient of the compressor stage characteristic. This study examined potential applications of this technology to aircraft engines having
multistaged axial-flow compressors. The primary focus of the analysis was to implement active stability control as a retrofit or upgrade to an existing engine configuration. Specifically, the effect of active control providing assumed levels of 5% and 20%
additional stability margin on a baseline low bypass ratio, afterburning turbofan engine has been evaluated. The additional stall margin was applied in two ways: first, compressor component efficiency was optimized at the expense of stability margin; second, both fan and high pressure compressor pressure ratios were increased. In both cases, overall stall margin otherwise sacrificed was provided by active control.
On a component level, optimizing the core compressor variable stators improved efficiency by .5% to 1.0% for rotor speeds in the typical range of operation. The corresponding decrease in stall margin ranged from -4.0% to -5.0%.
On an engine system level, the effect of higher pressure ratio operation depended on the engine power setting and flight condition. When active control provided 5%
additional stall margin, significant performance benefits (particularly cruise specific fuel
consumption (SFC)) were achieved. Along a 35,000 ft/.85 MN cruise operating line, for example, a 5% higher core operating line improved SFC by -.74% to -.82%. Installed SFC would improve further because the accompanying increase in engine inlet flow at these conditions would decrease the aircraft spillage drag.
At high power, a design point cycle study indicated that higher cycle pressure ratios caused both performance benefits and penalties. The penalties may only be eliminated if additional engine configuration changes are also made. Improving SFC at constant thrust or improving thrust at constant SFC, for example, would require lower
At high power operation throughout the flight envelope, the effect of higher pressure ratios depended on the region of the flight envelope and whether the fan or compressor was actively controlled. For the engine studied, three distinct regions of operation occurred. At intermediate rated power (IRP), as core compressor pressure ratio was raised 5%, the effect on thrust in each region was: -1.5% to -2.5% (fan stall margin limited region, characterized by low Mach number/ high altitude operation); 0.0% to -.5%
(turbine inlet temperature limited region); and -2.0% to -7.7% (compressor discharge temperature limited region, characterized by high Mach number operation). At maximum
afterburner operation, the effect on thrust was: -.6% to -1.55% (fan stall limited region); +.1% to +.8% (T41 limited region); and -1.2% to -4.3 % (compressor discharge
temperature limited).
At high power, increased fan pressure ratios affected the fan stall limited region only. IRP thrust in this region improved up to 8.0%; maximum afterburner thrust
increased up to 5.4%.
For the engine configuration studied, available stall margin above 5% could not be used by raising either the fan or compressor pressure ratios due to the presence of other cycle limits. Further increases in fan pressure ratio were restricted by minimum bypass ratio and/or minimum exhaust nozzle area constraints. Further increases in core compressor pressure ratios also resulted in significant thrust losses due to extended regions where operation was limited by compressor discharge temperature.
For active control stall margin contributions above 5%, preliminary design applications would achieve larger benefits than existing configurations. During the developmental phase, the design may be tailored to maximize the benefits of the available
stall margin.
Thesis Supervisor: Alan H. Epstein
Title: Professor of Aeronautics and Astronautics Thesis Reader: David Gordon Wilson
Acknowledgments
This project has been a learning and rewarding experience- one filled with both high points and low points. I'd like to take this opportunity to acknowledge those individuals who made the high points possible and the low points temporary.
Thanks to Alan Epstein, my thesis supervisor, for his technical guidance during this project. He deserves much of the credit for formulating the topic of this research.
Thanks to Dick Davis, Principal Engineer, General Electric Aircraft Engines, for his boundless enthusiasm and constructive advice. Those who know him will undoubtedly notice his influence on this work.
Thanks to David Gordon Wilson for serving as my thesis reader and for providing encouragement and constructive feedback during this
analysis.
I gratefully acknowledge the support of the General Electric Company for
sponsoring this research. Thanks to Glen Allen, Fred Pineo, Ken Zagray, Peter Hull, and Lee Weider for their patience and tolerance as I negotiated my way through the Advanced Courses. In addition, special thanks to all those who were willing to listen to, and to answer my many questions: Mike French, Ron Giffen, Dave Fink, Fred Ehrich, Brian Acampa, Chuck Christopherson, Sandy Moltz, Jim Geiger, John Moulton, Todd
Spezzaferro, Mark Prell, Bob Vandermolen, Dan Gilmore, Stu Bassler, Harold Brown, W. Hosny, and Bob Howell.
A warm thanks to my family whose contribution of support and encouragement cannot be overestimated- Mom, Dad, Cheryl, Lena, and Darrick.
A special thanks to my grandparents: Mr. Chin Wah Bow, Mr. Tso Wai Lam, and Mrs. Sun Ho Chin- from whom I learned so much through the unspoken word and to whom I respectfully dedicate this work.
Table of Contents
Abstract ... 2 Acknowledgments ... ... 4 Table of Contents ... 5 List of Figures ... 8 List of Tables ... 11 Nomenclature ... 12 1. Introduction . ... 14 2. Background ... 18 2.1 Introduction ... 182.2 Compressor Instability Phenomena ... ... 18
2.3 Stability Audit ... 22
2.4 Advanced Control Technologies ... 24
2.4.1 Stall Avoidance ... ... 24
2.4.2 Active Control of Stall Line Position ... ... 25
3. Analytical Model ling ... 30
3.1 Compressor Model ... 30
3.1.1 Definitions ... ... .... 34
3.2 Cycle Design Point Model ... 34
3.2.1 Baseline Model ... 34
3.2.2 Cycle Model Degrees of freedom ... 36
3.2.3 Definitions ... ... .... 39
3.3 Cycle Off Design Point Model ... 40
3.3.1 Control Modes ... 40
4. Compressor Component Analysis ... 47
4.1 Introduction ... 47
4.2 Background ... 48
4.3 Stall Margin Gain for a Lower Stalling Flow Coefficient ... 49
4.4 Optimizing Core Compressor Variable Stators ... . 55
4.5 Comparisons to other Compressor Designs ... 57
4.6 Discussion and Conclusions ... 57
5. Cycle Design Point Analysis ... 61
5.1 Introduction . ... 61
5.2 Method ... 61
5.3 Higher Pressure Ratio Operation ... 65
5.4 Design Trades ... 65
5.5 Conclusions ... 68
6. Cycle Off Design Analysis: Higher Pressure Ratio Operation ... 71
6.1 Introduction ... 71
6.2 Figures of Merit ... 73
6.2.1 Aircraft Mission Profiles ... 73
6.2.2 Cycle Design Limits ... ... 76
6.3 Method for Achieving Higher Pressure Ratio Operation ... 78
6.4 Results ... 80
6.4.1 Higher Pressure Ratio Operation Core Compressor ... 81
6.4.2 Higher Pressure Ratio Operation Fan ... 93
6.5 Conclusions ... 106
7. The Effect of Compressor Efficiancy Improvements on Cycle Off Design Performance .... .. ... 108
7.1 Introduction... ... 108
7.2 Method ... 109
7.3 Results ... 111
7.3.1 Cycle Sensitivity Factors ... 111
7.3.2 Optimizing Core Variable Stators ... 114
7.4 Conclusions ... ... ... 116 __
8. Recommendations for Future Research ... 119
8.1 Introduction ... 119
8.2 Additional Benefits of Applying Active Control on Existing Configurations 120 8.2.1 Reduced Rotor Speeds ... 120
8.2.2 Lower LPT Temperature ... 120
8.2.3 Transient Performance ... ... 121
8.3 Benefits of using Active Control on Developmental Engines at the Preliminary Design Level ... 121
8.3.1 Designing New Compressors to Maximize Efficiency ... 121
8.3.2 Designing New Compressors to Minimize Weight ... 121
8.3.3 Active Control as an Alternative to Variable Stators ... . 123
9. Summary of Conclusions ... 124
9.1 Introduction ... ... 124
9.2 Compressor Optimization Results ... 124
9.3 Design Point Cycle Analysis Results ... 125
9.4 Off Design Cycle Results of Higher Pressure Ratios ... 125
9.4.1 Higher Core Compressor Pressure Ratio ... 126
9.4.2 Higher Fan Pressure Ratio ... ... 126
9.5 Off Design Cycle Results with Improved Compressor Efficiency ... 127
10. References . ... 129
Appendix A: The Effect of Higher Cycle Pressure Ratios on Exhaust Temperature and Pressure ... 133
List of Figures
Figure 2-1 Figure 2-2 Figure 2-3 Figure 2-4 Figure 2-5 Figure 3-1 Figure 3-2 Figure 3-3 Figure 3-4 Figure 3-5 Figure 3-6 Figure 4-1 Figure 4-2A Figure 4-2B Figure 4-2C Figure 4-3 Figure 4-4 Figure 4-5 Figure 5-1 Figure 5-2 Figure 5-3 Figure 5-4Typical Compressor Map ... Compressor Map with a Stall Line Knee ... Stability Audit ... Active Control of Surge in a Centrifugal Compressor ... Stage Characteristic: Active Control of Rotating Stall in a
3 Stage Compressor ...
Fan Performance Map ... High Pressure Compressor Performance Map ... Stall Margin Definitions ... Mixed Flow Turbofan: Engine Flow Path Station
Designations ... Turbine Temperature Technology Progress ... Block Diagram of Cycle Deck Calculation Procedure ...
Calculation of Flow Coefficient and Pressure Coefficient... New Stall Line after Extrapolation of the Stage
Characteristics ... Extrapolated Stall Line at 90% Speed ... Extrapolated Stall Line at 70% Speed ... Typical Variable Stator vs Corrected Speed Howell
Diagram ... Core Compressor Howell Diagram ... Potential Efficiency Gains for Different Compressors ...
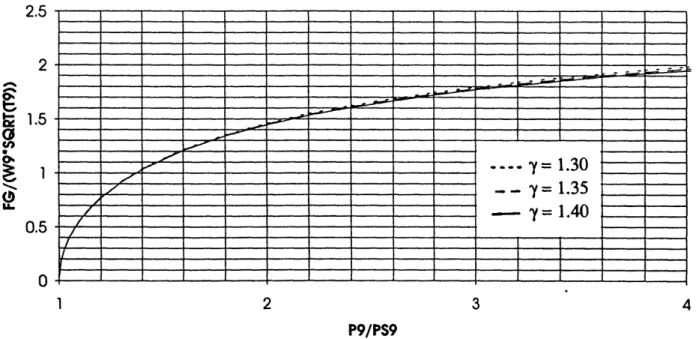
Ideal Gross Thrust Function ... Typical Specific Fuel Consumption vs. Specific Thrust
Carpet Plot ... SFC vs Specific Thrust at Various Levels of Pressure Ratio
and Bypass Ratio ... Cycle Design Trades: Improved SFC at constant Thrust and
Improved Thrust at constant SFC ...
20 20 23 29 29 32 33 35 38 42 44 50 51 52 52 54 56 58 64 66 67 69
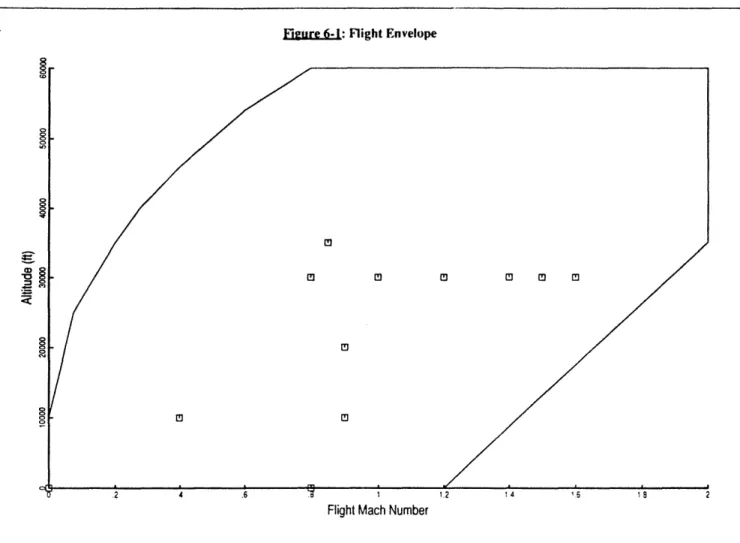
Figure 6-1 Figure 6-2 Figure 6-3 Figure 6-4 Figure 6-5 Figure 6-6A Figure 6-6B Figure 6-7 Figure 6-8 Figure 6-9 Flight Envelope ... Summary of Engine System Design Limits ... Raising HPC Operating Line using HPT and LPT
Nozzle Areas ... Turbine Temperature Profile vs Inlet Temperature: Higher
Core Compressor Pressure Ratios ... Thrust Impact at IRP due to Raising Core Operating
Line 5% ...
Turbine Discharge Temperature Profile: T56 vs T2 for a 5% High Core Operating Line at IRP ... Turbine Discharge Temperature Profile: BPR vs T2 for a
5% High Core Operating Line at IRP ... T3 Limited Operation Covers a Larger Portion of the Flight
Envelope as Core Pressure Ratio is Raised ... Raising Core Pressure Ratio by 5%: Part Power
Benefit at SLS... Raising Core Pressure Ratio by 5%: Part Power
Benefit at 35,000 ft/ .85 MN ... Figure 6-10 Figure 6-11 Figure Figure Figure 6-12 6-13 6-14 Figure 6-15 Figure 6-16
Raising Fan Pressure Ratio: T41 vs T2 Profile at IRP... Raising Fan Pressure Ratio by 5%: Change in Exhaust
Temperature ... ... Raising Fan Pressure Ratio by 5%: Thrust Contour Plot ... Raising Fan Pressure Ratio by 20%: Thrust Contour Plot ... Raising Fan pressure Ratio: T41 vs T2 profile during
Afterburning Operation (with BPR limit) ...
Raising Fan Pressure Ratio: Thrust Contour Plot with
Region that is BPR Limiting ... Region of Envelope in which Minimum BPR Eventually
Supersedes Minimum Fan Stall Margin as the Limiting
Cycle Constraint... 75 77 77 82 84 86 87 89 92 92 94 95 97 98 100 101 102
Figure 7-1 Figure 7-2 Figure Al- Figure A1-2 Figure A1-3 Figure A1-4 Figure A1-5
SLS Operating Line: SFC vs FN with Optimized Core
Variable Stators ... 35,000 ft/.85 MN Operating Line: SFC vs FN with
Optimized Core Variable Stators ...
Temperature vs Entropy Diagram Indicating Excess Cycle Exhaust Pressure and Temperature... Turbine Exhaust Temperature and Pressure After an Increase in
Compressor Pressure Ratio at Constant T41 and BPR ... The Lower Turbine Inlet Entropy Tends to Lower the Turbine Exhaust Pressure ... The Higher Turbine Inlet Pressure Tends to Increase the Exhaust
Pressure ... Exhaust Pressure will Increase or Decrease Depending
on the Magnitude of the Increase in Compressor
Pressure Ratio ... 117 117 134 134 137 137 139
List of Tables
Table 3-1 Table 6-1 Table 6-2 Table 6-3 Table 7-1 Table 7-2 Table 7-3 Table 7-4A Table 7-4B Table 9-1Comparison of the Features of Design Point Cycle Programs and Off Design Cycle Decks ... Part Power Performance Improvements for a 5% Higher Core Operating Line ... Performance Improvements at 35,000 ft/.85 MN/IRP ... Performance Improvements at 30,000 ft/.80 MN/Max AB ...
Engine Performance Sensitivities to Component Efficiency Improvements: SLS/STD/IRP ... Engine Performance Sensitivities to Component Efficiency
Improvements: SLS/STD/Max AB ... Engine Performance Sensitivities to Component Efficiency
Improvements: 35,000 ft/ .85 MN/ 80% IRP thrust ... Key High Power Mission Points with Optimized Core
Variable Stators ... Key Part Power Mission Points with Optimized Core
Variable Stators ...
The Results of Active Control on Both the Fan and Core Compressors ... 37 93 105 105 113 113 113 115 115 128
Nomenclature
Speed of sound at the nozzle exit plane High Pressure Turbine Nozzle Throat Area Low Pressure Turbine Nozzle Throat Area
Afterburner
Adaptive Engine Control Systems Altitude
Bypass Ratio
Engine Pressure Ratio Gross engine thrust Net engine thrust
Enthalpy
Highly Integrated Digital Electronic Control
Specific enthalpy
High Pressure Compressor High Pressure Turbine Inlet Guide Vane
Intermediate Rated Power Low Pressure Turbine
Aircraft Flight Mach number
Mach number at nozzle exit plane Rotor Speed
Rotor Speed of the fan
Rotor Speed of the compressor Fan pressure ratio
Core pressure ratio
High Pressure Turbine inlet pressure Low Pressure Turbine inlet pressure Nozzle throat total pressure
Total pressure at nozzle exit plane Core compressor corrected speed
Fan corrected speed
Pressure Ratio
Bypass duct static pressure prior to mixing Core stream static pressure prior to mixing Static pressure at nozzle exit plane
Entropy
Compressor exit entropy
Turbine inlet entropy Specific fuel consumption a9 A41 A49 AB ADECS ALT BPR EPR FG FN H HIDEC h HPC HPT IGV IRP LPT MN MN9 N N2 N25 P21Q2 P3Q25 P41 P49 P8 P9 PCN25R PCN2R PR PS16 PS56 PS9 S S3 S4 SFC ft/sec in2 in2 ft lbf lbf BTU BTU/Ibm rpm rpm rpm psia psia psia psia % psia psia psia BTU/OR BTU/OR BTU/OR lbm/(lbf hr) ___
SL Sea Level
SLS Sea Level Static flight condition
SM Stall Margin %
SR Specific Range
STD Standard Day Inlet Conditions
T2 Engine inlet temperature °R
T3 Core compressor discharge temperature °R
T41 High Pressure Turbine inlet temperature °R
T49 Low Pressure Turbine inlet temperature °R
T8 Nozzle throat total temperature °R
T9 Total temperature at nozzle exit plane °R
TS9 Static temperature at nozzle exit plane °R
U Rotor wheel speed ft/sec
V9 Flow velocity at nozzle exit plane ft/sec
Vk Flight Velocity knots
W2 engine inlet physical flow ibm/sec
W25 core compressor physical flow lbrn/sec
W25R Core compressor corrected flow lbm/sec
W2R Engine inlet corrected flow ibm/sec
W41 High Pressure Turbine inlet flow ibm/sec
W49 Low Pressure Turbine inlet flow lbm/sec
W8 Nozzle throat physical flow ibm/sec
W9 Nozzle exit physical flow lbm/sec
WFM Main combustor fuel flow bnm/hr
(I Flow coefficient
Work Coefficient
Y' Pressure Coefficient (Ah/U2)
rip Polytropic efficiency
Y Ratio of specific heats
R Gas constant
rlfan Fan adiabatic efficiency
r1core Comp. adiabatic efficiency
TrHPr HPT efficiency
TlLr LPT efficiency
Tlprop Propulsive efficiency
1ltherm Thermal efficiency
Chapter 1:
Introduction
Active control is a general term which describes the use of feedback logic to achieve a desired operating condition. Sensors monitor the magnitude of an appropriately selected physical parameter. As required, signals are sent to an actuator which drives the system to the desired operating condition. An example in turbofan engines is using fuel flow to control fan speed. A sensor monitors the rotor speed; as the speed deviates from
the desired value, more or less fuel is added.
With the development of high response electronics, the application of advanced control schemes toward actively suppressing stall was initiated by Epstein, et. al. in the 1980's (reference 1-1). For compressors with actively controlled stall lines, sensors monitor the unsteady flow oscillations characteristic of an impending stall- precursors which would otherwise increase in magnitude and cause surge or rotating stall (reference
1-1, 1-2). Actuators modify the dynamic response of the unsteady flow by applying perturbations which dampen the oscillations and suppress its growth. Among the actuators studied include throttle valves, bleed valves, fuel flow modulation, and high frequency inlet guide vane manipulation. Selection of appropriate actuator/sensor combinations are discussed in reference 1-3.
This study is motivated by the need to quantify how gains in compressor stall margin may be exploited in an engine system. Because of the existence of other design
constraints such as peak pressures and temperatures, the full benefits of increased stall
margin are not readily apparent. In addition, there are subtle, but important, advantages
and disadvantages to the various approaches to applying the added stall margin in the design process.
The primary focus of the analysis was to implement active stability control as a
retrofit or upgrade to an existing engine configuration. For this study, a level of additional stall margin provided by active control has been assumed. To cover a range of benefits
that may eventually be realized, 5% and 20% stall margin gains have been examined. The study made no assumption regarding the specific method of active control
utilized-whether it be inlet guide vane manipulation, flow injection, etc. In addition, potential compressor efficiency losses and/or gains due to the control actuators were assumed
negligible.
Chapter 2 further elaborates upon previous advanced stall control applications on
aircraft engines. Included are stall avoidance methodologies which use advanced control schemes to improve detection and avoidance of aerodynamic instabilities. Active stall
control incorporates a different philosophy: the aerodynamic instability line is not only avoided, but also suppressed. The result is an extended region of safe operation.
Chapter 3 outlines the analytical models used in this study. For the compressor, the application of component performance maps is reviewed. For the engine cycle, the
cycle design point program and the more elaborate thermodynamic cycle deck are
introduced. The differences between these cycle models are summarized.
This thesis investigated how active control offers performance benefits on two levels. First, on a component level, Chapter 4 examines potential improvements in compressor aerodynamic performance. With active control schemes, the required overall stall margin is provided by two sources: "conventional stall margin" provided by current
lower conventional stall margin goals and improve pressure rise, flow, and/or efficiency. The stall margin otherwise sacrificed is provided by active control. Hence, compressor
efficiency is improved while maintaining the same net stall line. This component level analysis focused on tuning variable stator settings to improve efficiency while lowering the conventional stall margin.
On an engine system level, both cycle design point and cycle off design studies
were conducted to assess the impact of using active control to raise fan and compressor pressure ratios. The design point analysis, discussed in Chapter 5, was made to identify the various cycle trends which occur with the higher pressure ratio operation. The off design analysis models a baseline, low bypass ratio afterburning turbofan to quantify the engine performance changes due to both higher compressor pressure ratios (Chapter 6) and efficiencies (Chapter 7). In doing so, engine performance improvements throughout the flight envelope and at both high power and part power conditions have been
quantified.
A consequence of this research was that several additional applications of actively controlled compressors were identified. However, addressing these additional topics was beyond the scope of this study. These topics are suggested as areas of future research in
Chapter 8.
Chapter 9 summarizes the conclusions of this study. In short, the largest improvements in high power afterburning thrust were achieved when active control permitted higher pressure ratios across both the fan and core compressor. Further, significant subsonic cruise fuel consumption benefits were realized. However, the use of active control to tune variable stators for best efficiency can only be justified if done in conjunction with the higher pressure ratio application. By itself, the performance improvement of optimizing the variable stators on a baseline engine design were not enough to warrant the use of active control.
The presence of other cycle limits (such as turbine temperatures, compressor temperatures and bypass ratio) prevented the best optimization of the additional stall margin on the baseline engine configuration. Greater performance benefits would be
Chapter 2:
Background
2.1 IntroductionCurrently, compressor operating lines are positioned to maximize performance
while satisfying cycle design constraints. One important limit is stall margin; i.e., the
maximum allowable operating pressure ratio relative to the stall pressure ratio. This chapter reviews the phenomena of compressor stall and the traditional means used to avoid this situation. In addition, various applications of advanced control methods are discussed. A summary of recent analytical and experimental active control studies is also
included.
2.2 Compressor Instability Phenomena
A compressor in aerodynamic instability may manifest itself in two ways: surge stall which is characterized by one dimensional, axisymmetric, axial oscillations; and
rotating stall which is a localized instability characterized by circumferential flow oscillations. Both forms are unacceptable in terms of aerothermal performance and
structural integrity. Stall will manifest itself as either surge or rotating stall based on the coupled dynamics of the compressor/combustor system (reference 2-1).
Although several analytical models have been developed to predict the stalling point, commonly used methods are the empirical correlations developed by Lieblein
(reference 2-2) and Koch (reference 2-3). The former method correlates the stall point of
a stage to a limiting diffusion factor (D Factor). The D Factor is a function of the
aerodynamic velocity triangles and the stage solidity and is related to the blade boundary
layer thickness. The latter method applies two dimensional diffuser correlations to
determine the stalling static pressure rise capability of compressor stages. Both methods
predict that stall occurs due to a limiting stage. The potential stabilizing influence of
adjacent stages (reference 2-4) is not modelled directly. Other models attempt to account
for this effect by modelling the overall compression system dynamics to determine when stall occurs (reference 2-5, 2-6). Even with these different models, however, extensive stall line testing is required to verify new compressor designs.
For multistage compressors, the overall stall line shown in Figure 2-1 is influenced
by how the enthalpy rise is distributed, or stacked, across the stages. Applying the stage
limiting stall criteria conceptually demonstrates how stage matching affects stall line
position in a multistage compressor. The overall stall line is limited by the stage(s) having
the least stall margin (reference 2-7). In general, at high rotor speeds, the rear stages are
stall limiting; at low speeds, the front stages are limiting. Hence, optimizing the stall line at
high speeds negatively impacts low speed stall margin, and vice versa. As a result,
depending on how the aerodynamicist ultimately designs the work distribution among the
individual stages, the stall line may exhibit a knee, or pinch point. This characteristic is
indicated on a compressor map by the abrupt change in the slope of the stall line (see Figure 2-2).
To maximize the stable operating region, several traditional compressor design options are available. These options include judicious selection of the aerodynamic design point (reference 2-9); low aspect ratio blades and high solidity designs (references
2-10, 2-11, 2-12); low tip clearances; casing treatment; optimized velocity triangles; and
I
!iD
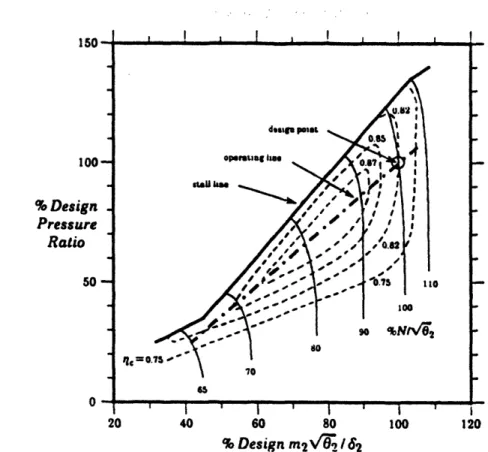
- I I i ' I 20 40 60 % Design ' I ' 80 100 m2V' 162 120Figure 2-l: Typical Compressor Map (reference 3-3)
OVERALL CIARAGTRISTICS I 2 III vi e a mm SE SPEED MASS FLOW
Figure 2-2: Compressor Map with a Stall Line Knee (reference 2-7)
20 100-% Design -Pressure Ratio 50-0 design plI opesaing Ilo _ staU 10 80 qI 70 65 1 .0 - I _ I _ __ L _ I I I , I I I I I
The compressor design point is often at pressure ratios well above the intended range of operation (reference 2-7). This design trade is characteristic of highly loaded
stage designs in which a high priority is placed on minimizing the number of stages and the
weight of the compressor. To achieve the required stall margin if the design point is placed in the region of operation, the loading on each stage would have to be reduced. Hence, to operate at the same required overall cycle pressure ratio, more stages would be required.
Unlike industrial gas turbine applications, an aircraft engine compressor must
maximize performance over a range of operating speeds. Because of the increase in
pressure ratio with succeeding stages, the stage inlet density is higher than the inlet density of the preceding stage. In reference 2-7, Stone further elaborates on the cause of stage
mismatching in a multistage compressor. Stone describes a simple model which indicates
that rear stages tend to be stall limiting above design speed and front stages tend to be stall
limiting below design speed.
To avoid the stall line knee (Figure 2-2), three different approaches have historically been used. First, interstage bleed valves were often required to unload the front stages and prevent premature stalls. Second, dual spool designs improved stall margin by unloading stall limiting front stages by running them to a slower rotor speed. Finally, variable stators were used to allow the compressor to achieve the higher stall line without the performance penalty associated with bleeding air or the mechanical complexity of the dual rotor configuration. The variable stators essentially modify the velocity
triangles at low power to alleviate the stage mismatch dilemma.
The use of variable stators provides more off design stall margin rd potentially greater efficiency than compressors without any variable geometry. However, although
efficiency is improved relative to the fixed geometry compressor, the maximum potential
2.3 Stability Audit
Once the stall line has been established, the maximum operating pressure is
dictated by stall margin requirements. The magnitude of this limit is determined
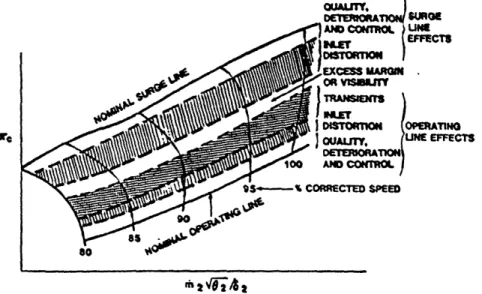
analytically by superposition of the various elements which degrade stability. Among the various factors include:
· engine deterioration- for example, as component efficiencies decrease, operating lines rise to hold performance.
· engine-to-engine manufacturing variation-stall lines and operating lines are representative of statistically average compressor performance;
· transient operation- acceleration of the compressor rotor requires unbalanced torque between the compressor and the turbine;
· tip clearances - leakage across the tip from the blade pressure side to suction side generates blockage and increased end wall loading.
· inlet distortion- non uniform pressure and velocity profiles cause extreme
local incidence angles.
As indicated by Figure 2-3, these factors influence the operating line, the stall line, or both. To assure stall free operation, the stall margin stack is based on worst case scenarios. Hence, the stack includes the effects of statistical uncertainty as well as maximum inlet distortion levels.
TS
Distortion effects often contribute significantly to the stall margin requirement,
especially for high performance military fighters. High angle of attack operation and other intricate flight maneuvers cause inlet flow separation which results in non-uniform
inlet flow. The spatial differences (circumferential and/ or radial distortion) in velocity
and pressure cause sections of the blading within a stage to operate at lower flow coefficients and hence points along the stage characteristic closer to stall. To minimize inlet distortion, proper engine/aircraft integration requires that the inlet be sized to avoid
or minimize inlet flow separation during these maneuvers. As such, the minimum inlet size
is often not dictated by the maximum engine airflow condition, but instead by the size resulting in the maximum acceptable level of flow distortion. Thus, the distortion tolerance of the engine has a direct effect on the size and weight of the aircraft.
2.4 Advanced Control Technologies
2.4.1 Stall Avoidance
The use of advanced control systems on aircraft engines has been investigated as a means to remove unnecessary conservatism from the stability stack. Several approaches
have been studied to apply controls technology to improve engine performance.
Previous efforts have focused on exploiting situations in which less compressor stall margin was required. These stall avoidance methods use sophisticated control logic to add flexibility to the engine control schedules. During non-stall limiting scenarios, real-time control inputs tune baseline schedules which had been designed for worst case stall
situations. For example, one phase of the Highly Integrated Digital Electronic Control (HIDEC) program tested an Adaptive Engine Control Systems (ADECS) on an F-15 aircraft (reference 2-13). The control system actuated the variable area exhaust nozzle to increase fan pressure ratio when excess stall margin was available due to the absence of inlet distortion. The up trim was based on inlet distortion correlated as a function of
resulted in a maximum increase in intermediate rated thrust of +12% (25,000 ft/.6 MN).
Other improvements to performance included the rate of climb, the time to climb, and the flight acceleration.
Follow up studies included performance seeking control algorithms which optimized control schedules to achieve optimum values of thrust, fuel burn, or turbine temperature based on actual engine operating conditions (reference 2-14, 2-15, 2-16). Flight testing resulted in up to 15% increases in thrust; reducing low pressure turbine inlet
temperature by 100 OR at high altitudes; and reducing fuel consumption up to 2%. Another approach applied a stall detection control scheme to avoid an instability
(reference 2-17). The compressor on a J85 engine was trimmed to higher pressure ratios having lower levels of stall margin. An array of pressure transducers sensing for
unsteady pressure signals characteristic of rotating stall actuated interstage bleed valves prior to an impending stall. The interstage bleed valves opened to prevent throttling into the stall region. Engine testing successfully demonstrated the concept although the stall control system did not anticipate and prevent stall completely.
2.4.2 Active Control of Stall Line Position
The methods described above use control sophistication to optimize control schedules. The added flexibility regains the performance otherwise sacrificed during non-stall limiting scenarios. The concept of active stall control, however, increases the
stall margin inherent to the system by suppressing the transition from stable to unstable operation. Hence, the stall line of a given compressor is effectively raised and more
margin is available for all flight conditions including those currently stall limited. Thus, for
several reasons, the potential benefits of active control include and exceed the benefits of the approaches described above.
rise using a variable exhaust nozzle. Active control, however, would extend this benefit
to fixed exhaust area fans and compressors.
Second, performance benefits would not depend on specific destabilizing elements being absent. This characteristic becomes more important for next generation military
fighters which emphasize low observable features. The stealth characteristics of the complex inlets cause levels of distortion which exist over the entire flight envelope even
during benign flight maneuvers.
Third, active control offers the advantage of being appropriate during the
preliminary design of the engine and/or aircraft. Because the stall margin inherent to the
system is increased, the additional margin may be incorporated into the baseline engine
design. Potential applications to reduce weight include using fewer stages to achieve the same overall pressure rise and smaller engine inlets if the compressor can accommodate higher levels of inlet distortion.
The concept of active control was first initiated by Epstein, et al in the 1980's (reference 1-1). Since then, several experiments have successfully demonstrated the concept of active control. Surge suppression on centrifugal compressors resulted in a 25% reduction in the stalling flow coefficient (Figure 2-4) and 10% additional shaft power (reference 2-18). Rotating stall was delayed to a flow coefficient 20% lower than the baseline in a single stage low speed axial compressor (2700 rpm, .245 tip Mach number; reference 2-19). The experiment manipulated high frequency inlet guide vanes to suppress rotating stall.
More recent research has applied control technology to a 3 stage, low speed compressor (2400 RPM, 660 mm tip diameter; reference 2-20). By using a
circumferential array of hot wires to sense axial velocity disturbances and inlet guide vanes to damp the 1st and 2nd spatial modes, the stalling flow coefficient was reduced by
8%. As shown by the stage characteristic from the experiment, stall was suppressed until
Hosny, et al (reference 2-5) conducted an analytical study investigating active stabilization in multistage axial compressors using stator angle settings as the control actuator. The study modelled an 8 stage compressor design with IGV and third, fourth
and fifth stage interstage bleed capabilities. Performance above the baseline stall line was
calculated by extrapolating the stage characteristics. For this study, each stage was modelled as a discrete volume to form a matrix of equations which represented overall
compression system behavior. Among the conclusions include:
· at 100% speed, a .3% maximum increase in overall stall margin was calculated. · at 87% speed, a 2% maximum increase in overall stall margin was calculated. · at 87% speed and a mismatched stage loading distribution (due to interstage
bleed), significant stall margin improvements are achieved.
Past engine system studies include reference 2-21 and 2-22. In reference 2-21, Brown, et al calculated the decrease in take off gross weight based on an assumed stall
margin improvement and aircraft design sensitivity factors. In reference 2-22, Seymour
assessed the benefits of a 20% stall margin (defined as [(PRstall/PR)(W/Wstall)-J) improvement for an afterburning turbofan engine at discrete design point locations
(design bypass ratio =1.0). Potential aircraft range and weight savings due to operation in the region above the existing stall line were quantified by extrapolating the shape of the
speed lines. The potential benefits of a 20% reduction in stall margin include an 11.2% increase in mission radius and a 5.3% increase in net thrust at 36089 ft and .90 Mach number.
In addition to these engine system studies, active control has potential benefits to the aircraft system. Currently, for high performance military applications, the engine inlet is sized to achieve levels of inlet distortion which are acceptable to the engine. As a result,
the higher levels of spillage drag. Previous aircraft systems studies predict substantial aircraft range improvements if this design compromise becomes less stringent (reference 2-23). For this application, the stall margin otherwise sacrificed by the higher inlet distortion index would be provided by active control (reference 2-24).
Issues addressed in this thesis build upon these earlier efforts. This study extends the analysis to engine performance improvements throughout the flight envelope including comparisons at both high power and part power conditions. In addition, engine cycle limits are identified which limit the benefits of active control on a baseline engine
configuration. These cycle limits explain the fundamental cause for both the benefits and penalties of applying active control. In doing so, the study qualitatively identifies the
aircraft applications for which active control is an attractive design option. Furthermore, this study identifies additional design changes which must accompany the use of active control in order to maximize the benefits of additional stall margin on an engine system.
For this analysis, a low bypass ratio, afterburning turbofan was selected as the baseline engine configuration- a configuration typical of high performance military fighter applications. These aircraft require challenging levels of stall margin due to the high levels of inlet distortion present during fighter aircraft operation. Hence, active control is
c 1.8. 1.4 1.0 8 0.6. 0.06 0.10 0.14 0.18 0.22 0.26 Flow Cofoeffient.
Fiure 2-4: Active Control of Surge in a Centrifugal Compressor (reference 1-2)
a;% 1.04. =_ I t 1.02. . 1.0 -0.98. -*3 QX0 I ' 0.4
U
L * No Control0.92 * 1st Harmonic Control Only
f
I 1st l & 2nd Hncm z Controla 3.9
-0.4 0.44 0.48 052 0.56 0.6 Flow Coefficient
Figur&e 2: Stage Characteristic: Active Control of Rotating Stall in a 3 Stage
Compressor (reference 2-20)
I-be '°Oo °°OG oo 0 .o Oo O oPo a oLNatural Surge Boundary * Control ° NoControl , , , ... , ... I I · r I ^ 0%Chapter 3:
Analytical Models
This section describes the analytical tools which were used in this study. Both the mechanics of the models and the necessary assumptions are described for the compressor and engine. Three analytical tools are described:
· Compressor component performance modelling;
· Cycle design point modelling used to identify cycle trends. Design point models are commonly used during the preliminary design phase of engine cycles. Performance sensitivities based on a single operating condition are assessed. For this model, the engine hardware configuration has not been defined in the design process; hence, the designer may specify the flow areas needed to achieve the desired thermodynamic properties.
· Cycle off design modelling used to quantify engine performance for a specified baseline engine configuration. The model quantifies performance at a variety of important flight conditions and power settings.
3.1 Compressor Modeling
The fan used in this study was a multistage design with inlet guide vanes (IGV) and variable stators. The high pressure compressor was also a multistage design with IGV and variable stators. Fan and compressor aerodynamic performance were modelled
using component maps. The component maps modelled the relationship of pressure ratio,
adiabatic efficiency, flow and rotor speed. The performance maps used in this study
represent analytical predictions for compressor performance. Although the designs are not based on specific test data, they are derived from previous designs upon which a large
experience base exists.
The baseline fan and compressor map values, in nondimensional form, are shown in Figures 3-1 and 3-2, respectively. Pressure ratio is expressed as a function of corrected
flow with lines of constant corrected speed and adiabatic efficiency superimposed on the plot. By convention, corrected parameters are used to generalize the data over a range of different inlet conditions. The stall line shown is indicative of clean inlet conditions.
Compressor component performance maps are based on a reference operating
condition. The reference flight condition is generally sea level static conditions since most
compressor verification testing is done at this condition. However, to predict performance at other altitudes and Mach numbers, pertinent adjustments to the baseline map
performance must be made. One effect which is commonly modelled is the change in the flow Reynolds number. Modifiers to flow, efficiency, and/or pressure ratio are applied to account for different boundary layer behavior.
In addition to a reference flight condition, the map data is indicative of a reference stator variable geometry schedule. An additional adjustment is made, when appropriate, for operation at off nominal variable geometry schedules. These modifiers are determined analytically using stage stack analyses and/or experimentally from test data. For this study, the effects of varying the variable geometry schedules are taken from sensitivity factors from compressors with similar aerodynamic characteristics as the compressor used in this study.
,u!od a3ua8J9aa e o0 pOaz!leJON O!: a8jnssaJd Q a c) m
c
0
o
a) CO c U-0)U, Cl ma) co U-a) . . CD CZIZ m iL co
0 8 c Co 0o
z
0 c, 0 <>Pressure Ratio Normalized to a Reference Point C)
0
0z
a
20 ;D CD -D0 a 0 CD Er S -nT CD. Pa CD :3 CD30
C) CD03
0
-0
Cs Ca0-0
CD _0 _ __ I_ .23.1.1 Definitions
Several definitions for stall margin are used in industry. In this analysis, the
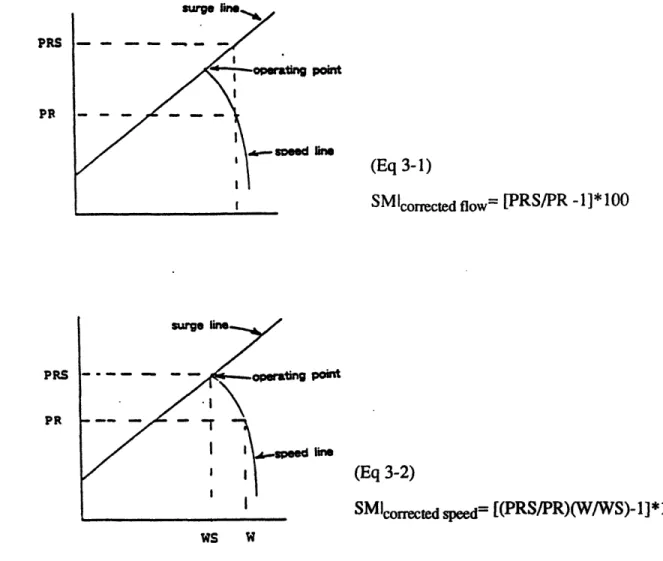
compressor stall margin is defined at constant flow;i.e., (3-1) SMIcoecte dflow=[ PRIsIPRIol -1] * 100
where PRIs= stall line pressure ratio PRIoI= operating line pressure ratio
This definition was selected because the effect of distortion on stall margin (distortion
indices) are specified at constant flow (reference 3-1).
Another definition commonly used is stall margin at constant speed which includes the change in compressor flow between the operating point and the stall point (eq 3-2). The differences between these definitions are shown graphically in Figure 3-3.
(3-2) SMIcorece dspeed=[(PRsl/PRIol)( 100lolWlsl)- 1]*
where PRIs= stall line pressure ratio PRo10=operating line pressure ratio Wlo l= the operating line flow
WIs= the stall line flow
3.2 Design Point Program
3.2.1 Baseline selection
A baseline engine configuration was selected to establish reference levels of engine performance. The selected baseline cycle is a low bypass ratio, mixed flow, afterburning turbofan (Figure 3-4). This configuration was selected because it is typical of high performance military fighter applications. The selection was motivated by the fact that
high performance military fighters frequently are designed to stall margin limits due to high
levels of inlet distortion. Hence, active control is potentially a suitable candidate for this
lin (Eq 3-1) SMIcorrected flow= [PRS/PR -1]*100 in (Eq 3-2) SMIcorrectedspeed= [(PRS/PR)(W/WS)- 1]*100 WS W
Figure 3-3: Stall Margin Definitions (reference 2-22)
PRS
PR
PRS
When appropriate, conclusions have been generalized to encompass other engine configurations. In explaining the phenomena based on thermodynamic fundamentals, guidelines have been established for applying active control benefits to different aircraft
applications.
Initial parametric studies were conducted on an engine design point program (reference 3-2). Design point programs, commonly used during the preliminary design phase of an engine, provide a flexible tool to determine cycle performance sensitivities
(reference 3-3). The usefulness of the design point analysis lies in the fact that several
thermodynamic properties may be held constant while pertubating a single thermodynamic
input property.
Unlike more elaborate cycle decks, design point programs model "rubber engines"; i.e., configurations in which the hardware geometry- turbine nozzle areas, mixing plane areas, and exhaust nozzle area- have not been defined in the design process. Hence, design point programs isolate the effect of changing a single thermodynamic property and
eliminate the secondary thermodynamic effects associated with the cycle rebalancing to
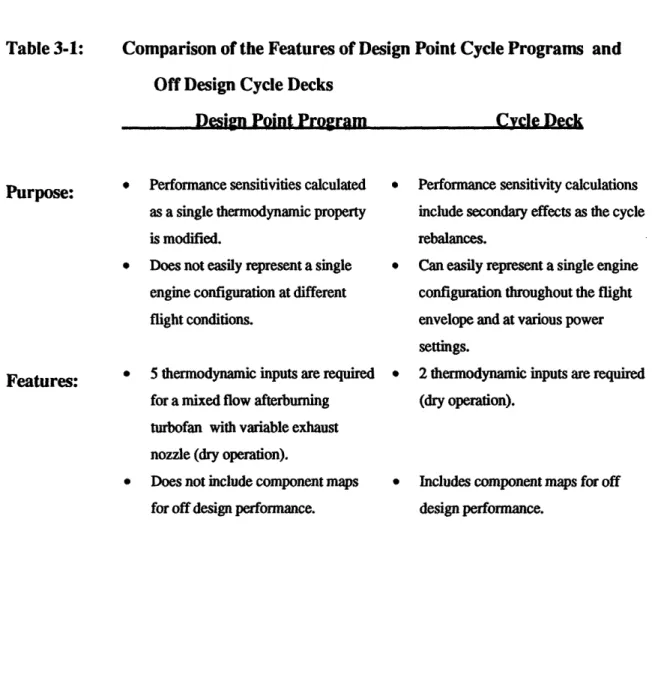
match specified duct areas. Table 3-1 summarizes the primary differences between the design point program and the more sophisticated off design cycle deck.
3.2.2 Cycle model degrees of freedom
The required number of thermodynamic inputs to the design point program is specified by dimensional analysis. Dimensional analysis expresses a system of equations as unique functions of the minimum number of independent variables. For a cycle with fixed geometry (that is, all duct areas are defined), the turbofan engine has one degree of freedom during dry operation and two degrees of freedom during afterburning operation. Hence, during dry operation, specifying a single independent variable (for example, main combustor fuel flow) defines all other thermodynamic properties in the cycle.
A variable exhaust nozzle area (A8) configuration requires an additional degree of
freedom. This area may be scheduled explicitly. Alternatively, because of the
interdependence of the cycle properties, the area may be indirectly specified by defining,
for example, a target turbine temperature corresponding to that exhaust area.
Table 3-1: Comparison of the Features of Design Point Cycle Programs and
Off Design Cycle Decks
ipaion Pint Prnaram lvIelP nIcPk
Performance sensitivities calculated as a single thermodynamic property is modified.
* Does not easily represent a single engine configuration at different flight conditions.
* 5 thermodynamic inputs are required for a mixed flow afterburning turbofan with variable exhaust nozzle (dry operation).
· Does not include component maps for off design performance.
* Performance sensitivity calculations include secondary effects as the cycle rebalances.
* Can easily represent a single engine configuration throughout the flight envelope and at various power settings.
· 2 thermodynamic inputs are required (dry operation).
· Includes component maps for off design performance.
Purpose:
Features:
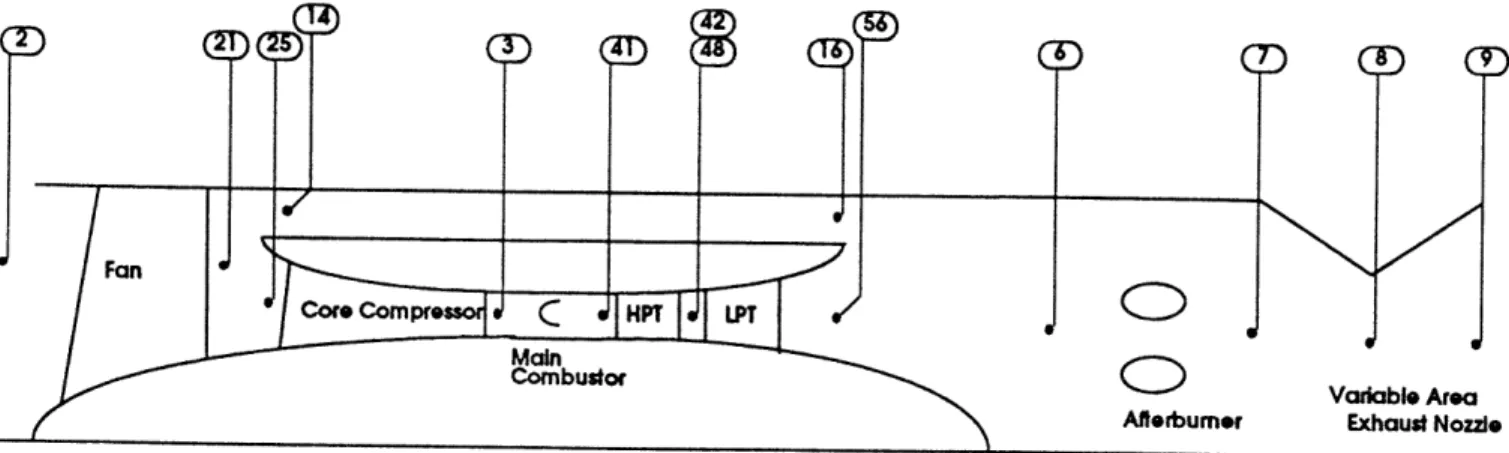
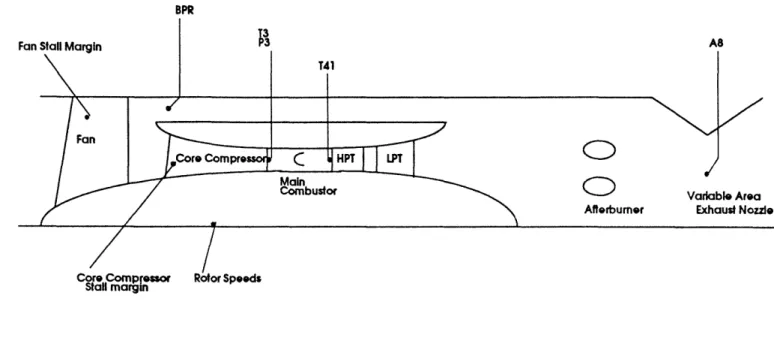
Engine Flowpath Station Designations P&W F100 (reference 3-6) Station N, 2 21 25 3 41 42 48 14 16 56 6 7 8 9 Description Engine Inlet Fan Exit
Core Compressor Inlet Core Compressor Exit HPT Inlet
HPT Exit LPT Inlet
Bypass Duct Inlet Bypass Duct Exit Core Stream Exit Afterburner Inlet Nozzle Inlet Nozzle Throat
Engine Exhaust Plane
Figure A: Mixed Flow Turbofan: Engine Flow Path Station Designations
During the preliminary design of an engine cycle, additional degrees of freedom
exist because the duct areas have yet to be defined. For the mixed flow turbofan (Figure
3-4), the cycle designer must specify 5 areas: 2 turbine nozzle areas, the area of the
bypass duct, the area of the core stream at the mixing plane, and the exhaust nozzle area. Again, because of the interdependence of the cycle properties, specifying the
thermodynamic properties is equivalent to defining the areas. By convention cycle properties such as compressor pressure ratios are defined because they have more
engineering aerothermal meaning and offer better insight into the mechanics of the cycle.
3.2.3 Definitions
Specific Fuel Consumption (SFC) is a measure of how efficiently the engine burns
fuel. The parameter is defined as the ratio of total fuel flow (main combustor and
afterburner) divided by net engine thrust. Because it is desirable for fuel flow to be low for a given level of thrust, a lower SFC means better performance.
(3-3) SFC=WFT/FN
where WFT is fuel flow FN is engine net thrust
The specific thrust (FN/W2) is the engine net thrust divided by the engine inlet flow. This parameter is often used during the preliminary design phase of the engine.
The overall efficiency of the gas turbine cycle is the product of the cycle's overall thermal efficiency and the propulsive efficiency. These two efficiencies have
diverging influences: propulsive efficiency increases with decreasing exhaust velocity (v9)
; thermal efficiency increases with higher compressor exit temperature (T3) ( reference
overall efficiency
(3-4) 7loverallmlth,oq prop
where lprop= propulsive efficiency 1th,=overall thermal efficiency * propulsive efficiency
(3-5) 1lprop = [useful work supplied to aircraft Akinetic energy of the propellant]
= (FN) (Vfl)
W9(V9)2/(2g)-W 1 (Vfl)2/(2g)
where FN is the net thrust Vfl is the flight velocity W1 is the engine inlet flow W9 is the engine exhaust flow
V9 is the engine exhaust velocity * thermal efficiency
(3-6) rlth,o = Wnet/Qin
= W9(Y92/(2g)-Wl(V 1I/2g
(WFT)(FHV) where Wnet is the net work
Qin is the heat input
WFT is the combustor fuel flow
FHV is the fuel heating value
3.3 Engine Cycle Deck for Off Design Analysis
3.3.1 Cycle Control Modes
The cycle deck calculates the thermodynamic cycle properties at off design
conditions. Unlike the design point analysis described above, however, the engine
hardware configuration has been defined; hence, fewer degrees of freedom exist. For the baseline afterburning turbofan with variable exhaust nozzle, the control system specifies two parameters during dry operation and three parameters during augmented operation.
For this study, idealized control modes have been adopted. The first mode defined the engine inlet flow as a function of engine inlet conditions. This mode was
assumed to have already been optimized for the baseline configuration.
The second control mode was turbine inlet temperature (T41). For this study, a maximum turbine temperature representative of the current state of the art was selected (Figure 3-5). At high power, the cycle deck solved this maximum temperature unless other cycle properties became limiting. In this study, two factors which caused T41 to operate below its maximum level were fan stall margin and compressor discharge temperature (T3).
In actual engine control systems, T41 is not measured directly because
instrumentation cannot survive in the severe temperature environment at that flow path
station. Hence, turbine temperature is indirectly specified by a different thermodynamic
property. These actual control modes are tailored to satisfy fan stall margin, T41, T3, and other limits as appropriate.
3.3.2 Cycle Mechanics
The component modelling within the cycle deck address nonstandard, non ideal operating conditions. For example, the compressors and turbines have maps to define the component performance. As described in Section 3.1, the cycle model modifies the turbomachinery components map values for nonstandard conditions which include the effects of Reynolds number, humidity, tip clearances, and deviations from the nominal
TURBINE-INLET TEMPERATURE. To4 :MPRESSOR-INLET TEMPERATURE. TO ;OR T.: 300K 27C 540R · 80F T' -_80 COATED CARBON-CARBON COATED ZIRCONIA -470 /1 .? SIN!GLE CRYSTAL rCEr ERAMICS =E: ERAMICS BLADE /COOLING
-EYEQATURE 0t -AU FOR
,%COAT ED ME.
JPVPE TEMPELt%=?E -VIT
:=OR C.oED-C'-GAS-TURIINE E4GINE _~iSS -60 -4.0 950 '960 1970 r80 !990o YEAR
Eigure -5: Turbine Temperature Technology Progress (reference 2-11)
C F 2000- -3500 i 4800-4 ,-3000 4600- w I: 4 z a: 'aJ I-d w w z I.-w z co 1400 --2500 1200-4 1000-4 800- 500 t~,,,, 7r, ·s3
Empirically based modifiers are also applied to model the combustion process and
flow through the various ducts. These factors include:
· combustor heat loss- energy convected from the gas generator to the
bypass duct;
* stratification- the non-uniform radial profile of temperature and pressure exiting the fan;
· mixing of the bypass and core streams- conservation of momentum and energy calculation as the bypass air is reintroduced into the primary flow path.
· cooling and leakage flows- including overboard leakage, internal bore
cooling, and turbine nozzle and blade cooling;
· pressure losses- due to friction, diffusion, and heat addition.
· installation effects-compressor bleed flow and horsepower extraction to power aircraft accessories.
· exhaust nozzle aerodynamics - modelling of overexpanded and underexpanded operation.
Figure 3-6 is a block diagram of the cycle deck calculation procedure.
Mathematically, the cycle solution is achieved by solving a system of equations formed by combining the control inputs with boundary conditions dictated by first principles.
Because the governing equations cannot be expressed in closed form, the solution is obtained by iteration. To expedite the calculation process, the cycle deck applies the
LL
0
z
(Dc
a
Un CL0
.lI
-Q en (na
CZ C Xo 00
Eo
0
O
C CE
I
r
-I a) CQ-2
0
C a) E c) ZI a) N N0
z
CIZ
C) w X LL*
(I).
L-a):
I- rzE: '(' crCZ L.CZ. "I-
0-.
a
.
m.
asr
1 .i C) en a) j o0 E0
n-a)a)
C0)
a>C
C)
O: ) 7u
.a w L. 10 QIr
.o
4'.. E ea.
aC C 4C
C
4-' ._ C)L
__
I - ! I _ - l-F I ! ! --- - !l -I·i
L ... 1 -- ----11go
10-~ wThe boundary conditions assure that the conservation of mass and the conservation of energy are maintained through the engine. The following elaborates on the boundary conditions and the criteria for converged solutions.
High Pressure Compressor (HPC) inlet flow: The inlet flow to the HPC is calculated independently two ways: the flow that is calculated from the component
map; and the flow that is passed from the upstream station. The boundary condition is
satisfied when both solutions agree within an acceptable tolerance.
Turbine flow functions: Conservation of mass at the high pressure turbine (HPT)
and the low pressure turbine (LPT) rotor inlets are similarly satisfied by comparing the map value to the flow passed from the upstream station.
Nozzle Throat: Conservation of mass at the throat is determined in a slightly different manner. Upstream conditions provide one value of flow. The other value is
associated with the static quantities at the throat. These static quantities depend on whether or not the throat is choked and are related to properties at the discharge plane.
Match plane static pressure balance: For unchoked bypass duct operation, the model iterates until the bypass duct discharge static pressure (PS 16) equals the core duct exit static pressure (PS56).
3.3.3 Cycle Model Inputs
Altitude, Mach number, and ambient temperature define the engine's operating point in the flight envelope. However, to completely define the engine operating
condition, the effects of engine/aircraft integration must be modelled. These installation effects include engine bleed flow, engine horsepower extraction, and inlet ram recovery. The aircraft uses engine bleed flow and engine rotor work to power its onboard accessories. For this study, the bleed flow is modelled by a constant 3.5% (of the core
Ram recovery models the total pressure loss in the inlet as a function of flight speed. The cycle model defines the pressure recovery as a function of Mach number per the standard MIL-E- 5008C.
Chapter 4:
Optimizing Compressor
Component Performance
4.1 IntroductionCompressor aerodynamic design involves compromises among pressure rise, flow,
efficiency and overall stall margin. Hence, optimized levels of efficiency, flow and/or
pressure rise may be sacrificed in order to achieve satisfactory levels of stall margin. However, with active control schemes, the required overall stall margin is provided by two sources: "conventional stall margin" provided by current compressor design techniques; and "control stall margin" provided by actively suppressing stall initiation. Because
control stall margin is available, the design is not subject to the compromises traditionally needed to meet stall margin goals; as a result, the designer can optimize the compressor for pressure rise, flow and/or efficiency.
For the same net stall margin (SMI tota), the presence of the stall margin provided by active control allows the conventional stall margin (SMIconv) to decrease by one of two methods. First, for the same aerodynamic stall line (PRIsiconv= constant), the operating line pressure ratio (PRIo0 ) is increased while the conventional stall margin is decreased (SMIconv; eq 4-1). Stall margin otherwise sacrificed is provided by active
(PRIsl,conv is lower) which allows a decrease in conventional stall margin. Again, active control provides the stall margin otherwise sacrificed.
(4-1) SMlconv= (isi, conv - 1) * 100
PRIol
(4-2) SMI tota= SMIconv + SMIac
where PRIsl,conv is the conventional stall pressure ratio established by traditional techniques.
PRIol is the operating line pressure ratio
SMIconv is the conventional stall margin provided by traditional techniques.
SMIac is the stall margin provided by active control SMItota is the net stall margin
This chapter focuses on the latter method: a lower conventional stall line pressure ratio is acceptable when used with active control. The benefit is an improvement in
component efficiency. These efficiency benefits are later applied to the engine in Chapter
7 to quantify the impact of improved compressor efficiency on system level performance. Chapters 5 and 6 analyze the impact of the other method: maintaining the same conventional stall pressure ratio and instead raising the operating pressure ratio.
4.2 Background
As discussed in Chapter 2, variable stators are a common solution for improving the stall line during low speed operation on multistage compressors. For example,
reference 4-1 details a design in which the desired operating line intersected the stall line at low speeds. Inlet guide vanes and 4 stages of variable stators were required to make the
compressor viable. Further, as stated in Chapter 2, variable stators are designed to provide adequate stability margin and not necessarily to maximize efficiency.
The following analysis explores how active control can improve compressor performance. First, the magnitude of potential stall margin gains has been estimated
the use of actively controlled compressors to eliminate efficiency compromises has
been evaluated. The variable stators have been defined to maximize efficiency; stall
margin otherwise sacrificed would be provided by active control.
4.3 Stall margin gain for a lower stalling flow coefficient
Active control experiments demonstrated a reduction in the stalling flow coefficient by 8% to a characteristic slope (dY"/d) of .9 on a 3 stage axial flow
compressor (reference 2-20). Studies by Hendricks, et al (reference 4-2) indicate that stall may be suppressed to a characteristic slope of up to 4 on high speed multistage machines.
These magnitudes have been applied to the fan and compressor in this study to quantify the stall margin gain (stall margin at constant corrected flow, eq. 3-1). The method for converting pressure ratio and corrected flow into compressor stage characteristics (P' vs cb) is shown in Figures 4-1. The method assumes perfect gas properties, standard day inlet conditions, and no inlet swirl.
First, the performance maps (pressure ratio vs flow) were converted to its compressor characteristic equivalent (a' vs (). Second, the characteristics at different
speeds were extrapolated to a positive slope to determine the new stalling pressure and flow coefficients. The extrapolation was conducted assuming symmetric stage
characteristics (reference 4-3). Finally, knowing the new pressure and flow coefficients, the new stall pressure ratio was calculated and plotted on the component map (Figure 4-2A).
_ I J-O 5"O ca C CDW .o 7t C(D O 3 ., cO CD O 3 O L j -OO
0
(A D -a (D 0 0 :3 C4 L I O a_ O-CQ 4-(D II"CK g
cK C) O (D O '-1 B0 < z 3 · : 11 0 ,z,,0 CD ( (D ° D (a n a - _ <n a 0 -o~ nY 8 a W &-q CD C CD 0 CA) O Q>)
-* -n
Co C 0 q i3 P0.
o10 030
a =-ttq 11 _ C(D -4 a 4(D C -4-(D Ielt
3' C1 B. C. m r-o -1 ri, cr o C)D C C CQ;'< .
o d0 o _ Oc) O D D C.. I 0 (D o D30 (i
-0X.+.r +
0
17 11 'at>
11
h_I(I
. 50_ I
i ii 7 ~~~~~~~~~ . - -~~C I I ^t -- 2, 21
I W~C ; - . , I I -W W -C,l
) E~ `C -- p~P--- -- -1
mc o a) .) CD C.) a) o a) CD cr-0 _0a) CN ca E 00 3 hi 0u. lp 0 a,
lu!od oauaJeJ e o01 paz!leWlJON O!i: aJnssaJd
*.. c) CD euCu I- u * -w 3 4-C CQ W _ C __
The extrapolation of the compressor characteristics were done for three cases: * Extending Dstal1until dTP'/d became greater than 0.0.
* Extending Istal1 until dt/d4O became equal to 3.0. * Extending Dstall until dT'/db became equal to 6.0.
From Figure 4-2A all the cases resulted in approximately the same increase in overall stall
margin: 0.0% at 100% speed and 2.5% at 70% speed. Reductions in the stalling flow
coefficient as the slope was increased to more positive values was offset by the losses in pressure coefficient.
The magnitudes of the improvement in stability are consistent with reference 2-5 for a well matched multistage compressor. Although relatively small, reference 2-5 predicts that the gain in stall margin should increase as the stages become more mismatched; a situation which would exist if variable stators are adjusted to maximize
efficiency.
The magnitude of stall suppression that will ultimately be realized on high speed multistage configurations depends on future development of the technology. For this reason, this study did not directly apply the estimated stall margin gain based on the above calculation. Instead, a range of stall margin was assumed: 5% and 20% levels of control
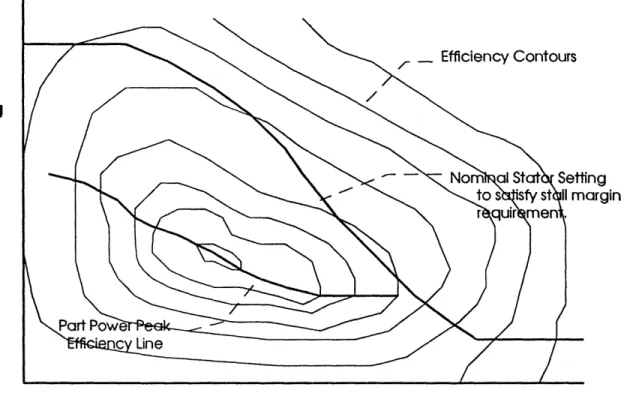
Angle Setting of Variable Stator Efficiency Contours ing argin
Corrected Rotor Speed
Figure 4-3: Typical Variable Stator vs Corrected Speed Howell Diagram
4.4
Optimizing Core Variable Stators
The potential improvement in efficiency and the influence of variable stator
position are demonstrated by a typical Howell compressor diagram (Figure 4-3). Figure 4-3 plots the variable stator angle as a function of corrected rotor speed with efficiency contours superimposed. As illustrated, the nominal stator angle does not coincide with the line of peak efficiency. The deviation is generally greatest at lower speeds. At these operating conditions, the variable stators sacrifice efficiency to alleviate stage mismatch
and to provide the required stability margin.
Core compressor efficiency was optimized by applying empirically based variable
stator modifiers on the baseline component maps. To cover a range of relevant operating speeds, the optimized variable stator schedule was defined by running a series of cycle points principally along an intermediate rated power (IRP) acceleration at 35,000 ft (MN
from .2 to 2.0). For the compressor used in this study, Figure 4-4 compares the location of the peak efficiencies relative to the baseline stator schedule at sea level static (SLS) operation. Note that larger angle adjustments were required at part power operation
where the greatest potential efficiency gains may be achieved.
Applying sensitivity factors which degraded the stall line for changes in the stator
schedule resulted in a loss in stall margin of 4% to 5%. Although a maximum efficiency
improvement of 6% was possible at very low rotor speeds (Figure 4-5), the efficiency increase (Arl) for typical operating speeds ranged from .005 to .01.
The results of this analysis should be a conservative estimate of potential compressor efficiency improvements. Redefining both the stator and blade velocity diagrams during the preliminary design phase, for example, would produce larger gains in