HAL Id: halshs-02110792
https://halshs.archives-ouvertes.fr/halshs-02110792
Submitted on 25 Apr 2019HAL is a multi-disciplinary open access archive for the deposit and dissemination of
sci-L’archive ouverte pluridisciplinaire HAL, est destinée au dépôt et à la diffusion de documents
To cite this version:
Nicolas Scelles, Christophe Durand, Thierno Bah, François Rioult. Intra-match competitive inten-sity in French football Ligue 1 and rugby Top 14. International Journal of Sport Management and Marketing, Inderscience, 2011, 9 (3-4), pp.154-169. �10.1504/IJSMM.2011.041569�. �halshs-02110792�
Intra-match competitive intensity in French football
Ligue 1 and rugby Top 14
Nicolas Scelles* and Christophe Durand
UFR STAPS, Campus II,
Université de Caen Basse-Normandie,
2 Boulevard du Maréchal Juin, 14032 Caen Cedex, France E-mails: nicolas.scelles@unicaen.fr
E-mail: nicolasscelles@hotmail.com E-mail: christophe.durand@unicaen.fr *Corresponding author
Thierno Souleymane Bah and François Rioult
UFR Sciences, Département Mathématiques et Mécanique, Bâtiment Sciences 3, Campus II,
Université de Caen Basse-Normandie,
Boulevard du Maréchal Juin, 14032 Caen Cedex, France E-mail: balde_thiernosouleymane@yahoo.fr
E-mail: Francois.Rioult@info.unicaen.fr
Abstract: This article develops a new dimension of competitive balance: intra-match level. In addition, it combines stakes and reversals as well as outcome uncertainty to create a new concept: competitive intensity. Intra-match competitive intensity was measured in French football Ligue 1 over the period 1993–2008 and rugby Top 14 over the period 2001–2008. The results show the regularity of intra-match uncertainty in Ligue 1 over the period 1993–2008 and the positive impact of the bonus system which was instituted in Top 14 in 2004–2005. Indeed, Top 14 intra-match competitive intensity surpassed Ligue 1’s (which was previously higher) over the sub-period 2004–2008.
Keywords: competitive balance; CB; intra-match level; stakes; reversals; outcome uncertainty; competitive intensity; CI; football; rugby; bonus; France, sport management and marketing.
Reference to this paper should be made as follows: Scelles, N., Durand, C., Bah, T.S. and Rioult, F. (xxxx) ‘Intra-match competitive intensity in French football Ligue 1 and rugby Top 14’, Int. J. Sport Management and Marketing, Vol. X, No. Y, pp.000–000.
Biographical notes: Nicolas Scelles holds a Doctorate in Sciences and Technics of Physical and Sports Activities (STAPS) from the University of Caen Basse-Normandie and a Contractual in the Unit of Teaching and Research (UFR) STAPS at the University of Paris Sud 11. His area of specialisation is professional sports political economics. His thesis carries on competitive intensity which is landed through two levels: intra-match and intra-championship. The problem of his work consists in wondering about rules which allow optimising competitive intensity of professional sports leagues and the feasibility of their setting up considering leagues and clubs officials perception.
Christophe Durand holds a Doctorate in Management Sciences and a Professor at the UFR STAPS, University of Caen Basse-Normandie. His areas of specialisation are professional sports political economics: professional sports leagues regulation, relations between professional sport and public sphere, physical and sports activities factor of socio-economic development, ethics in governance and marketing strategy of sports organisations. He leads a double approach – economic and political – in the perspective of a comparative initiative according to three axes: temporal, spatial and inter-sports. He is a member of the marketing commission of the French professional league of basketball (Ligue Nationale de Basket).
Thierno Souleymane Bah is Master 2 student in MASS (Social Sciences Applied Mathematics) at the UFR Sciences of the University of Caen Basse-Normandie. He has made statistical tests of this article during his internship of master 1 MASS.
François Rioult holds a Doctorate in Computer Science and an Associate Professor at the UFR Sciences, University of Caen Basse-Normandie. His research interests are: data mining and knowledge discovery in databases, missing values in databases, algorithmical aspects of data mining – condensed representations, bioinformatics (gene expression data analysis) and machine learning, classification, clustering. He is a Reviewer for IEEE Transactions on Knowledge and Data Engineering. Between 1990 and 2000, he was a Sound-Engineer for French television, cinema and music bands.
1 Introduction
In professional sports economics, the concept of competitive balance (CB) is currently well documented (Andreff, 2008; Eckard, 2001, 2003; Groot, 2008; Humphreys, 2002; Késenne, 2000; Michie and Oughton, 2004; Sanderson and Siegfried, 2003; Schmidt and Berri, 2001; Szymanski, 2003; Zimbalist, 2002). It postulates the necessity of equilibrium of the teams in a league to guarantee outcome uncertainty and thus generate public demand. CB has been regularly considered in the decisions taken by the officials of the leagues. It justifies the exemption system vis-à-vis antitrust laws that the American leagues have obtained in 1961 (sports broadcasting act). In the academic literature, CB is studied through four temporal scales of uncertainty: before kick-off for a match, during a season, at the end of a season and over several seasons so as to establish whether there is an absence of regular domination or not [Szymanski, (2003), pp.1153–1156].
The first innovation to be introduced in this article is the calculation of a fifth scale of measurement: intra-match CB, that is to say the CB during a match. To our knowledge, only Falter and Pérignon (2000) have integrated a factor related to this level of analysis. Their study dealt with the evolution of goal differential between the teams per quarter of an hour in football. They did not therefore put forward an intra-match CB measurement.
In addition to enhancing CB, we seek to go beyond this concept. In order to do so, we shall use the notion of competitive intensity (CI) which was proposed by Kringstad and Gerrard (2004, 2005). According to them, apart from the degree of equality of teams’ playing strengths (or CB), audiences are also interested in the prizes that may be distributed within the framework of the league [Kringstad and Gerrard, (2007), p.27]. Consequently, CI relates to stakes of European selection, relegation to inferior divisions,
etc. [Cavagnac and Gouguet, (2006), p.11]. Kringstad and Gerrard (2007) select two different indicators as leagues are North American (closed) or European (opened with promotions and relegations). For the American leagues, Kringstad and Gerrard use classically the Herfindahl index to analyse the distribution of the participants in playoffs. The Herfindahl index represents the sum of the squares of the parts of presences in playoffs of every team. The sum of the parts of presences is equal to 1. For the five major European leagues of football, Kringstad and Gerrard choose the rate of relegation of the teams recently promoted.
Kringstad and Gerrard rely on original measures with regard to those pre-existent by privileging the access to key places: qualified for playoffs or relegation. Nevertheless, a limit which can be mentioned is that the analysis concerns several seasons considered each as a homogeneous group synthesised by the final standings. They do not thus allow to inform about the progress of the championships game week after game week. However, it is possible that from the principle of Kringstad and Gerrard CI, it can be proposed measures getting at once outcome uncertainty and the sports stakes in a dynamic perspective during a season. This is one of our objectives.
Besides, we think that reversals must be incorporated, for they are vectors of the league standing effect proposed by Neale (1964, p.3) in a classical article: “there is excitement in the daily changes in the standings or the daily changes in possibilities of changes in standings. The closer the standings, and within any range of standings the more frequently the standings change, the larger will be the gate receipts”. We therefore, consider CI to be a function of three key factors:
1 stakes felt by consumers 2 degree of uncertainty 3 reversals.
It is necessary to have perceived stakes, close AND evolving scores.
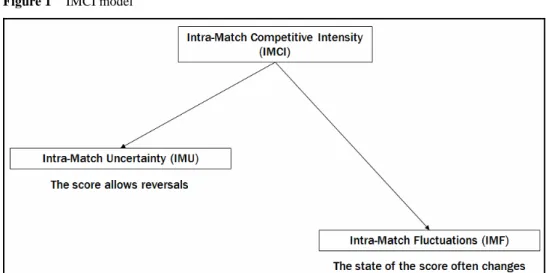
In this article, we shall set out a model for intra-match CI (IMCI). The model combines the percentage of game-time with the gap between two teams’ scores, that don’t exceed a certain threshold (uncertainty) and fluctuations of situation (reversals). These components are linked to the stakes of the match since they depend on the potential allocation of points for the championship and the possibility of changing its course. The two variables have been called ‘percentage of game-time with possibility of rapid fluctuation of state of score’ and ‘average fluctuations of state of score’ respectively. They must be calculated according to a common interval of time to enable comparison between sports with matches of unequal length. Simply put, the two variables correspond to intra-match uncertainty (IMU) and intra-match fluctuations (IMF) respectively. We believe that there is a hierarchy between the two variables, and that IMU is of prime importance, trumping that of IMU because we regard maintaining uncertainty for as long as possible to be more important than reversals (Figure 1). To justify this hierarchy, we can envisage two situations:
• the first corresponds to a match with few fluctuations but an uncertainty which is maintained until the end
• the second coincides with a match rich in fluctuations in his first part but without uncertainty is his second part.
Figure 1 IMCI model
The first situation seems better to guarantee the public interest during the entire match. The structure of this article is two-fold. In the first part, we shall clarify the IMCI model. In the second part, we shall apply this model to two French leagues: football Ligue 1 over the period 1993–2008 (n = 5,330 matches) and rugby Top 14 over the period 2001–2008 (n = 1,290 matches). The first aim is to determine whether there are temporal differences in IMCI for each league. In Ligue 1, the retained period has no outstanding evolution (except the move from two-point to three-point victory in the standings in 1994–1995). In Top 14, however, the retained period is marked by the institution of a bonus system in 2004–2005. The second goal is to compare the two leagues.
2 IMCI model
2.1 State of score
In a league, the state of score at any given moment represents a potential allocation of points in the standing for the two competing teams, or it can mean the potential extra time for those sports where equality at the end of the prescribed time breeds additional game-time. State of score isn’t the score: evolution of the latter does not necessarily coincide with a change of state of score (for example, the move from 2–0 to 2–1 in football without a bonus system). For the calculation of IMU, we take into account the evolution of the state of score and not the evolution of score. As a general rule, the state of score corresponds to at least three possibilities: advantage for the home team, a draw, advantage for the away team. More states of score will be generated if the number of points taken to the standing is influenced by a bonus system (see box).
Bonus systems in French professional sports leagues
Bonus systems were introduced by the organisers of professional sports leagues to improve the offensive quality of matches and to increase their stakes beyond the mere quest for victory or a draw. They are not a new invention. A bonus system was in force in the French football championship over the period 1973–1976. During the season 1973–1974, each team scoring at least three goals during the game-time of a single match was awarded one additional point in the standing. Over the following two seasons, bonus points were awarded only for victories with at least three goals between the two teams. Nevertheless, the system was then abandoned until rugby Top 14 used it for the 2004–2005 season, based on the model of the one instituted a year earlier by the European Rugby Cup (ERC) for continental competitive sports, itself reproducing the principle of the bonus applied in the Super 12 (international competitive sports opposing Australian, South African and New Zealand teams). Indeed, French national rugby league (Ligue nationale de rugby, LNR) has decided to allocate one offensive bonus point to teams scoring at least four tries (for the teams scoring at least three more tries than their adversaries since 2007–2008) and one defensive bonus point to teams losing with a maximum difference of seven points between the two teams.
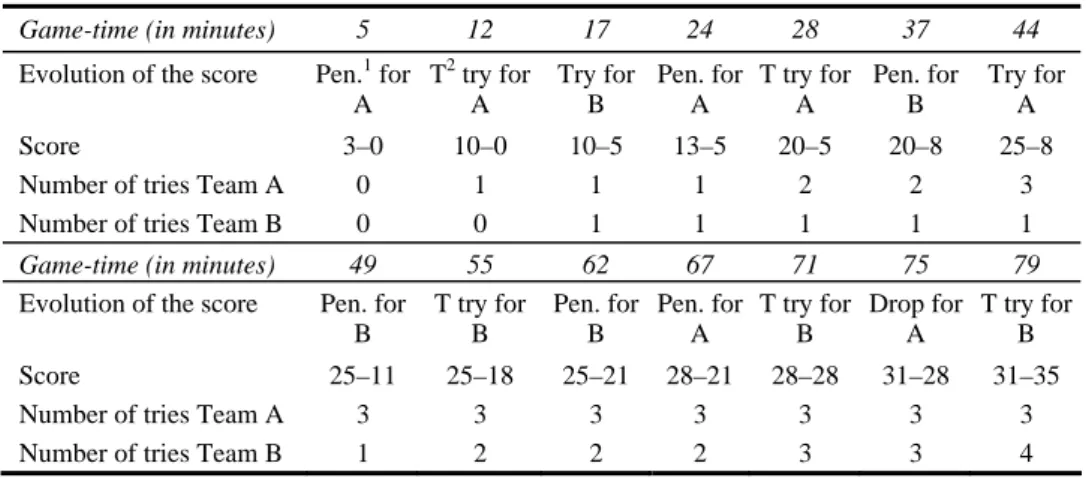
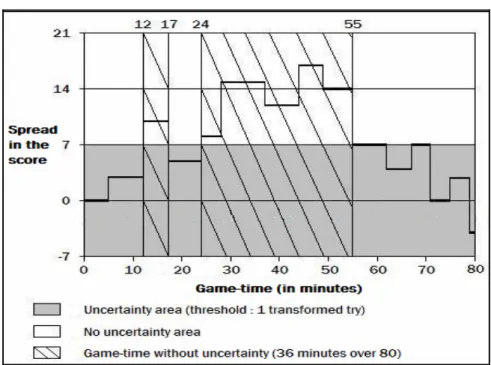
The impact of bonus on IMCI in rugby is presented in Figure 2. We can see there are more situations with possibility of fluctuations at the next evolution of score than without bonus where the only possibility is that the spread of score is not superior to seven points. Consequently, we can expect that uncertainty is stronger with bonus. To illustrate this, we can take the example of a given match. The evolution of score is indicated in Table 1. Figures 3 and 4 correspond to comparative diagrams of the match without and with bonus points. Without bonus (Figure 3), there is uncertainty (no more than a spread of seven points between the two teams) only during 44 minutes over 80. With bonus (Figure 4), there is uncertainty during 71 minutes over 80. So bonus has a positive impact on uncertainty in the case of this match.
The French professional football league (Ligue de football professionnel, LFP) considered reinstating the bonus system for the sports standing of Ligues 1 and 2 before finally settling on a solution which didn’t influence these standings in 2006–2007: the offensive Challenge. This allows sums of money to be attributed to teams at the end of the season, according to the standing they have in this challenge. Thus, €16.7 m was distributed among Ligue 1 teams and €3.5 m among Ligue 2 teams at the end of the 2006–2007 seasons. The change in relation to the points attributed for sports standing is as follows: three points for the team winning with at least a two goal difference and two points for the team that winning with a one goal difference compared to three points in both cases at the sports standing.
Table 1 Examples of evolution of the score for a rugby match
Game-time (in minutes) 5 12 17 24 28 37 44 Evolution of the score Pen.1 for
A T2 try for A Try for B Pen. for A T try for A Pen. for B Try for A Score 3–0 10–0 10–5 13–5 20–5 20–8 25–8 Number of tries Team A 0 1 1 1 2 2 3 Number of tries Team B 0 0 1 1 1 1 1 Game-time (in minutes) 49 55 62 67 71 75 79 Evolution of the score Pen. for
B T try for B Pen. for B Pen. for A T try for B Drop for A T try for B Score 25–11 25–18 25–21 28–21 28–28 31–28 31–35 Number of tries Team A 3 3 3 3 3 3 3 Number of tries Team B 1 2 2 2 3 3 4 Notes: 1Penalty; 2transformed
Figure 2 Bonus impact on the possibilities of state of score fluctuations at the next change of score in French rugby Top 14 over the period 2004–2007
Figure 3 Game-time and possibilities (or not) for state of score fluctuation at the next change of the score without bonus
Figure 4 Game-time and possibilities (or not) for state of score fluctuation at the next change of the score with bonus, 2004–2007 version
2.2 Intra-match uncertainty
In the same way that defenders of CB claim that uncertainty is necessary to generate a strong audience, the IMCI model rests on the following axiom: audiences will prefer to attend matches where the possibility of quick IMU is maintained for a long time rather than ones where this potentiality disappears too quickly. This could explain the extra interest in football in Europe, for which the popular saying is that ‘in one match, anything is possible’, in comparison with other sports, like basketball, where the audience often anticipates that the weaker team may at best ‘limit the damage’ without for as much maintaining suspense for a long time. To refine the IMU component, it is useful to set the gap as the score where possibility of quick IMU is thought to arise. This possibility is a function of the average number of changes of score per three-minute interval for a given sport. This interval has been judged relevant by experts of football, rugby and basketball during interviews, in particular to avoid the phenomena of channel-hopping for the broadcast matches: if it can have a reversal there in the three minutes, the TV viewer is not going to change channel. For example, with a mean of 2.21 goals per game of 90 minutes in French football Ligue 1 over three seasons (2003–2006), the average number of changes of score per interval of three minutes is 2.21/90 * 3 = 0.074 (Table 2). This suggests that it is highly improbable for there to be two changes of score during the next three minutes and therefore that a team with a gap of two goals will be able to equalise.
Table 2 Average number of changes of score per three-minute interval in the first division of French professional team sports leagues and in NFL over the period 2003–20061 Leagues Number of changes of score over an interval of three minutes
Football Ligue 1 0.074 Rugby Top 14 Between 0.24 and 0.57
Basketball Pro A Between 3.92 and 11.75 Handball Division 1 2.59
Ice hockey Ligue Magnus 0.34
NFL Between 0.26 and 1.04
It is absolutely essential to distinguish sports where the score evolves in a uniform way from those where it doesn’t. In football, handball or ice hockey, the score evolves goal by goal (uniformity). In rugby, basketball or American football however, the scores do not evolve in a uniform way. In these sports, the possibilities of scoring with the same action are the following:
• in rugby, three points (penalty or drop), five points (try without transformation) and seven points (transformed try)
• in basketball, one point (one free throw), two points (basket in the racket or two free throws) or three points (basket outside the racket). We can exclude the possibility of scoring four points in the same action (one basket at three points plus one free throw) because of the extreme rarity of such a case
• in American football, two points (safety), three points (field goal), six points (touchdown without transformation), seven points (touchdown with field goal or extra point) and eight points (touchdown followed by another touchdown or two-point conversion).
The possibility of scoring an un-fixed number of points in the same action requires a bracket of average changes of score to be calculated. For BB Pro A, an average of 11.75 points is scored every three minutes. This is equivalent to 11.75 baskets at 1 point (only individual free throws) or 3.92 baskets at three points (only baskets outside the racket) at either end. In any case it is perfectly possible for a team trailing by six points (tow baskets at three points) to equalise quickly (in less than one minute) in BB.
On the basis of the preceding elements and after interviews with experts, two referential possibilities of quick IMU thresholds can be distinguished:
• in sports with fewer than an average of one change of score every three minutes (football, American football, ice hockey, rugby), the possibility of quick IMU arises when the state of score can be modified by THE next change of score2
• in sports with an average of more than two changes of score every three minutes (basketball, handball), the possibility of quick IMU arises when the state of score can be modified by the next or the following two changes of score.
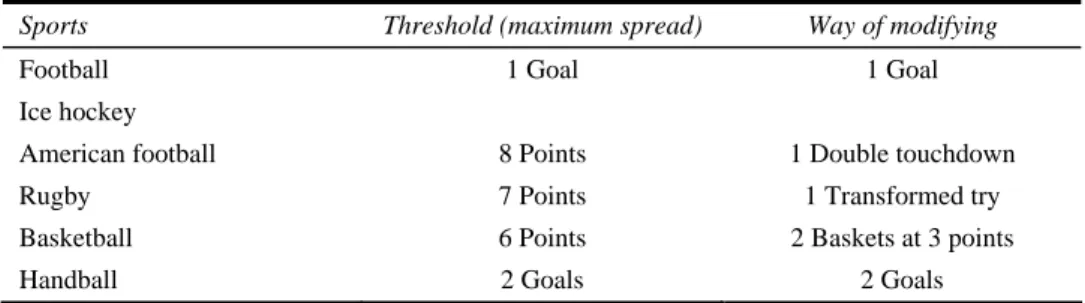
Table 3 Possibility of quick intra-match fluctuation thresholds without bonus and ways of modifying state of score rapidly for each sport
Sports Threshold (maximum spread) Way of modifying Football
Ice hockey
1 Goal 1 Goal
American football 8 Points 1 Double touchdown Rugby 7 Points 1 Transformed try Basketball 6 Points 2 Baskets at 3 points
Handball 2 Goals 2 Goals
2.3 Intra-match fluctuations
IMU and uncertainty are complementary. This may be demonstrated through the example of the French football premier league, Ligue 1. The latter has been criticised by the media for the strong tendency of its matches to end in no score draws which is, from a certain point of view, a score where uncertainty is permanent! During the 2005–2006 season, 13.4% of matches ended in a 0–0 tie. We may note that over the period 2002–2007, the percentage is 12.5% versus 8.6% over the period 1997–2002, that is to say there is a slight increase.
Frequent nil-nil draws may at first sight seem ideal from the point of view of IMU insofar as the latter seems not to be interrupted, especially since the state of score can shift to either side at any time. Nevertheless, accumulation of 0–0 ties reduces the possibility of changes of score during matches, in the audience’s perception and suggests that it is likely that audiences will fall in number as this accumulation intensifies. It justifies the utility of integrating IMU in order to obtain increased adaptation of the IMCI model, with the assigned objective of giving information about appeal generated for the audience. To support this statement, one may note that Loret (1995, p.295) refers to IMU as a variable that may serve to explain audience interest: “as a general rule, the sports most appreciated by television viewers are those which allow for greatest fluctuation of the score. This fluctuation is indeed the only possibility of reversal or swift evolution of the game, thus making them all the more dramatic and so all the more spectacular”. So the ideal match offers permanent uncertainty and is rich in fluctuations.
3 Applications: the cases of French football Ligue 1 and rugby Top 14
3.1 French football Ligue 1 over the period 1993–2008
Figures 5 and 6 represent IMU and fluctuations respectively in Ligue 1 over the period 1993–2008 (n = 306 or 380 matches by season)3. Uncertainty fluctuates between roughly 85% and 90%: only the 1994–1995 season has an uncertainty inferior to 85% (84.3%) and only the 2000–2001 season has an uncertainty superior to 90% (90.02%). So we can conclude that there is a high level of regularity of IMU. This is corroborated by a statistical test of inter-season difference: it is not significant for a 5% risk of error (percentage * volume p value > 0.05, see Table 4)4. The weighted mean of IMU adds up to 1.53. Of the 15 values, 11 are between 1.47 and 1.59 (that is to say they vary up to 5%
from the mean). For the seasons concerned, there is some regularity of IMU. However, of the four remaining seasons, two display IMU which are slightly greater than the mean (seasons 1999–2000 and 2000–2001 with IMU of 1.69 and 1.79 respectively), one displays IMU lower than the mean which are slightly greater than 5% (the 2002–2003 season with IMU of 1.45) and one has IMU slightly below the mean (the 2005–2006 season with IMU of 1.41). The 1999–2000, 2000–2001 and 2005–2006 seasons have the highest mean number of goals for the first two and the lowest for the latter. However, classifying seasons according to IMU does not produce exactly the same pattern as classification according to the mean number of goals.
Figure 5 IMU in Ligue 1 over the period 1993–2008
Figure 6 IMU in Ligue 1 over the period 1993–2008
Table 4 Results of the statistical test for Ligue 1 over the period 1993–2008
Parameter Estimation Standard error Test value t P. value
Intercept 1,824.1257 268.273 6.80 <.0001 Percentage 1.9005 3.061 0.62 0.5473 Volume –308,565.2258 1,532,902.118 –0.20 0.8441 Percentage * volume 4,304.8302 17,891.768 0.24 0.8143
3.2 French rugby ‘Top 14’ over the period 2001–2008
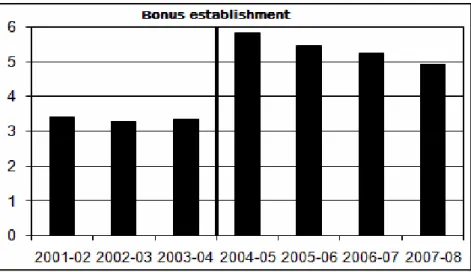
Figures 7 and 8 represent IMU and fluctuations respectively in the Top 14 over the period 2001–2008. Uncertainty is between 60% and 65% over the sub-period 2001–2004 whereas it is between 85% and 95% over the sub-period 2004-2008. There is therefore a strong increase between the two sub-periods, which is confirmed by the statistical test of inter-sub-period differences: it is significant for an error risk of 5% (percentage * volume p value < 0.05, see Table 5). Similarly, there is a clear increase in IMU between 2001–2004 and 2004–2008. In fact, it went from below 3.5 over the sub-period 2001–2004 to close to or greater than five over the sub-period 2004–2008. Consequently, we can conclude that the bonus system had a positive impact on Top 14 IMCI. It may also be an explanatory factor of the increase in demand in Top 14 since 2004.
Figure 7 IMU in Top 14 over the period 2001–2008
Table 5 Result of the statistical test for Top 14 over the period 2001–2008
Parameter Estimation Standard error Test value t P. value
Intercept 2.9569308 0.7380756 4.01 0.0025 Percentage –0.0328478 0.0083434 –3.94 0.0028 Volume –829.7159994 285.3190450 –2.91 0.0156 Percentage * volume 14.3086414 5.4172957 2.64 0.0247
3.3 Comparison between ‘Ligue 1’ and ‘Top 14’
On the basis of our data, we can compare Ligue 1 and Top 14 over the period 2001–2008 by separating the sub-periods 2001–2004 and 2004–2008. Over the first sub-period, Ligue 1 has a better IMU score whereas Top 14 has better IMU score. Now uncertainty is of prime importance. So Ligue 1 has a better IMCI than Top 14 over the sub-period 2001–2004. Over the sub-period 2004–2008, Ligue 1 and Top 14 have relatively similar uncertainty but Top 14 has an IMU value that is three to four times greater than Ligue 1’s. So Top 14 has a better IMCI value than Ligue 1 over the sub-period 2004–2008. Consequently, the bonus system has allowed Top 14 to surpass Ligue 1 in terms of IMCI.
4 Conclusions
IMCI enhances the measures adopted in the literature to deal with outcome uncertainty. Moreover, it constitutes an appropriate way of judging the efficacy of bonus systems. The results set out in this article show the benefits of the bonus system for French rugby Top 14 in improving interest in matches. Bonus could be a trail in the promotion of football attractiveness through rules that increase goal scoring [Andreff and Raballand, (2009), p.28].
IMCI is a useful measure but its isolated examination is insufficient for a really pertinent assessment of the appeal of a competition. In addition to being uncertain and rich in reversals, a match must offer a stake in relation to the standing of the league. Consequently, intra-championship CI must be tackled in conjunction with IMCI.
Acknowledgements
The authors would like to thank François Kauffmann (Associate Professor in Mathematics) for his useful help.
References
Abdi, H. and Williams, J.L. (2010) ‘Principal component analysis’, Wiley Interdisciplinary Reviews: Computational Statistics, Vol. 2, in press, available at
http://www.utdallas.edu/~herve/abdi-wireCS-PCA2010-inpress.pdf (accessed on 6 July 2010). Andreff, W. (2008) ‘Équilibre compétitif et contrainte budgétaire dans une ligue de sport
professionnel: Vers une meilleure gouvernance du football français’, La lettre de l’AFSE, Vol. 72, pp.1–26, available at http://www.afse.fr/lettres/Lettre-72.pdf (accessed on 8 December 2008).
Andreff, W. and Raballand, G. (2009) ‘Is European football future to become a bothering game? About clubs’ loss minimising objective’, Paper presented at the First European Conference in Sports Economics, September 14–15, Paris.
Cavagnac, M. and Gouguet, J-J. (2006) ‘Talent sportif et équilibre compétitif: Une approche par la théorie des jeux’, Revue Juridique et Économique du Sport, No. 79, pp.7–31.
Eckard, E.W. (2001) ‘Baseball blue ribbon economic report: solutions in search of a problem’, Journal of Sports Economics, Vol. 2, No. 3, pp.213–227.
Eckard, E.W. (2003) ‘The Anova-based competitive balance measure: a defense’, Journal of Sports Economics, Vol. 4, No. 1, pp.74–80.
Falter, J-M. and Pérignon, C. (2000) ‘Demand for football and intramatch winning probability: an essay on the glorious uncertainty of sports’, Applied Economics, Vol. 32, No. 13, pp.1757–1765.
Groot, L. (2008) Economics, Uncertainty and European Football: Trends in Competitive Balance, Edward Elgar, Cheltenham, UK/Northampton, MA.
Humphreys, B.R. (2002) ‘Alternatives measures of competitive balance in sports leagues’, Journal of Sports Economics, Vol. 3, No. 2, pp.133–148.
Késenne, S. (2000) ‘Revenue sharing and competitive balance in professional team sports’, Journal of Sports Economics, Vol. 1, No. 1, pp.56–65.
Kringstad, M. and Gerrard, B. (2004) ‘The concepts of competitive balance and uncertainty of outcome’, International Association of Sports Economists Conference Paper, 0412.
Kringstad, M. and Gerrard, B. (2005) ‘Theory and evidence on competitive intensity in European soccer’, International Association of Sports Economists Conference Paper, 0508.
Kringstad, M. and Gerrard, B. (2007) ‘Competitive balance in a modern league structure’, Communication abstract at the North American Society for Sport Management Conference, May 30–June 2, Ft. Lauderdale, Florida, available at
http://www.nassm.com/files/conf_abstracts/2007_1715.pdf (accessed on 12 June 2007). Loret, A. (1995) Génération glisse, Autrement, Paris.
Michie, J. and Oughton, C. (2004) ‘Competitive balance in football: trends and effects’, Research Paper 2004 No. 2. Birkbeck, University of London, available at
http://www.football-research.bbk.ac.uk/docs/competitivebalance.pdf (accessed on 19 October 2005).
Neale, W.C. (1964). ‘The peculiar economics of professional sports: a contribution to the theory of the firm in sporting competition and in market competition’, The Quarterly Journal of Economics, No. 78, Vol. 1, pp.1–14.
Sanderson, A.R. and Siegfried, J.J. (2003) ‘Thinking about competitive balance’, Journal of Sports Economics, Vol. 4, No. 4, pp.255–279.
Schmidt, M.B. and Berri, D.J. (2001) ‘Competitive balance and attendance: the case of major league baseball’, Journal of Sports Economics, Vol. 2, No. 2, pp.145–167.
Szymanski, S. (2003) ‘The economic design of sporting contests’, Journal of Economic Literature, Vol. 41, No. 4, pp.1137–1187, available at
http://www.vanderbilt.edu/Econ/faculty/Vrooman/econdesign.pdf (accessed on 15 January 2006).
Zimbalist, A.S. (2002) ‘Competitive balance in sports leagues: an introduction’, Journal of Sports Economics, Vol. 3, No. 2, pp.111–121.
Notes
1 Period 2004–2006 for NFL. Volleyball Pro A was not retained because of the variability of the length of matches which complicates the calculation of the number of changes of score over an interval of three minutes.
2 Even if the bracket of average changes of score every three minutes has an upper limit of 1.04 in American football, it is surprising that there are only safeties during a season. So we can classify American football among sports with an average of less than one change of score every three minutes.
3 A sample table of our data (excel files) is given in Appendix 1.
4 The statistical modelling, carried out using statistical analysis system (SAS) and principal component analysis (PCA), is explained in Appendix 2. See Abdi and Williams (2010) for more explanations about PCA.
Appendix 1
Sample table of our data (IMU in French football Ligue 1 on the season 2005–2006)
Appendix 2
Statistical modelling
In order for the data to be compatible with data analysis software, we must transform it into matrices of distance so as to observe the similarity or the dissimilarity between variables (the closer two variables are to one another, the more they are linked). Once the matrices of dissimilarity have been obtained, we can then search for individual coordinates to make a projection of the points. This process gives rise to multidimensional positioning, whose aim is to represent a table of dissimilarity in a space of fixed dimensions in order for canonical Euclidean distances to be matched to the matrix of dissimilarity as closely as possible.
Ascendant hierarchical classification is then determined in order to first group together the two closest points within the same class. This process is repeated until groupings are complete. This classification corresponds to Ward criterion which consists in minimising the interclass inertia loss resulting from the aggregation of two individuals or one individual to an individual’s group.
The following stage is principal component analysis (PCA) which allows an essentially graphic description of the information contained in large data tables. One of the key points of PCA is proper value. This is the variance of the corresponding principal component (summarised inertia or information by the considered factorial axis). So the sum of proper values represents the total variance to be summarised. PCA provides a histogram of proper values, which makes it possible to check the quality of the summary on the different factorial axes and so to determine the number of axes that should be kept. The PCA result allows singular values to be retrieved because they are linked to proper values (being their square root). We grouped these singular values together in a single table. We then entered the average percentages of game-time with possibility of quick fluctuation of state of score (IMU) into another table and concatenated the two tables to obtain a single table containing the information required to carry out the statistical test (IMU, singular values and volumes).
The test for statistical significance required us to carry out a linear regression of the year variable from the IMU variables and volumes. We thus sought to obtain estimates of the variable in order to explain year according to the values of explanatory IMU variables and volumes (percentage * volume). We are therefore able to test the following two hypotheses:
H0 There is no year effect. H1 There is year effect.
To do so, the Student test was used. H0 was rejected when |Tobs| > T (read) or when p value < 0.05 with a one in five-in-a-hundred chance of error. In this case, we have concluded that the test is significant and so that there is year effect.