HAL Id: hal-02611797
https://hal.univ-lorraine.fr/hal-02611797
Submitted on 18 May 2020
HAL is a multi-disciplinary open access archive for the deposit and dissemination of sci-entific research documents, whether they are pub-lished or not. The documents may come from teaching and research institutions in France or abroad, or from public or private research centers.
L’archive ouverte pluridisciplinaire HAL, est destinée au dépôt et à la diffusion de documents scientifiques de niveau recherche, publiés ou non, émanant des établissements d’enseignement et de recherche français ou étrangers, des laboratoires publics ou privés.
dysfunction affecting post-myocardial infarction
patients: An explanatory study
Olivier Huttin, Damien Mandry, Batric Popovic, Patrick Rossignol, Freddy
Odille, Emilien Micard, Zohra Lamiral, Faiez Zannad, Nicolas Girerd,
Pierre-Yves Marie
To cite this version:
Olivier Huttin, Damien Mandry, Batric Popovic, Patrick Rossignol, Freddy Odille, et al.. Plasma Galectin-3 predicts deleterious vascular dysfunction affecting post-myocardial infarction patients: An explanatory study. PLoS ONE, Public Library of Science, 2020, 15 (5), pp.e0232572. �10.1371/jour-nal.pone.0232572�. �hal-02611797�
RESEARCH ARTICLE
Plasma Galectin-3 predicts deleterious
vascular dysfunction affecting
post-myocardial infarction patients: An explanatory
study
Olivier Huttin1,2, Damien Mandry3,4, Batric Popovic1,2, Patrick Rossignol1,5,6,
Freddy Odille3,5, Emilien Micard3,5, Zohra Lamiral5, Faïez Zannad1,2,5, Nicolas Girerd1,2,5,
Pierre-Yves MarieID1,7*
1 Universite´ de Lorraine, INSERM, UMR-1116, Nancy, France, 2 Department of Cardiology, CHRU-Nancy, Universite´ de Lorraine, Nancy, France, 3 Universite´ de Lorraine, INSERM, UMR-1254, Nancy, France, 4 Department of Radiology, CHRU-Nancy, Universite´ de Lorraine, Nancy, France, 5 Universite´ de Lorraine, CHRU-Nancy, INSERM, CIC 1433, Nancy, France, 6 FCRIN INI-CRCT, Nancy, France, 7 CHRU-Nancy, Universite´ de Lorraine, Nuclear Medicine & Nancyclotep Imaging Platform, Nancy, France
Abstract
Objectives
In a previous analysis of a post-myocardial infarction (MI) cohort, abnormally high systemic vascular resistances (SVR) were shown to be frequently revealed by MRI during the healing period, independently of MI severity, giving evidence of vascular dysfunction and limiting fur-ther recovery of cardiac function. The present ancillary and exploratory analysis of the same cohort was aimed at characterizing those patients suffering from high SVR remotely from MI with a large a panel of cardiovascular MRI parameters and blood biomarkers.
Methods
MRI and blood sampling were performed 2–4 days after a reperfused MI and 6 months thereafter in 121 patients. SVR were monitored with a phase-contrast MRI sequence and patients with abnormally high SVR at 6-months were characterized through MRI parameters and blood biomarkers, including Galectin-3, an indicator of cardiovascular inflammation and fibrosis after MI. SVR were normal at 6-months in 90 patients (SVR-) and abnormally high in 31 among whom 21 already had high SVR at the acute phase (SVR++) while 10 did not (SVR+).
Results
When compared with SVR-, both SVR+ and SVR++ exhibited lower recovery in cardiac function from baseline to 6-months, while baseline levels of Galectin-3 were significantly dif-ferent in both SVR+ (median: 14.4 (interquartile range: 12.3–16.7) ng.mL-1) and SVR++ (13.0 (11.7–19.4) ng.mL-1) compared to SVR- (11.7 (9.8–13.5) ng.mL-1, both p<0.05). Plasma Galectin-3 was an independent baseline predictor of high SVR at 6-months (p =
a1111111111 a1111111111 a1111111111 a1111111111 a1111111111 OPEN ACCESS
Citation: Huttin O, Mandry D, Popovic B, Rossignol P, Odille F, Micard E, et al. (2020) Plasma Galectin-3 predicts deleterious vascular dysfunction affecting post-myocardial infarction patients: An explanatory study. PLoS ONE 15(5): e0232572.
https://doi.org/10.1371/journal.pone.0232572
Editor: Giuseppe Andò, University of Messina, ITALY
Received: October 27, 2019 Accepted: April 16, 2020 Published: May 11, 2020
Peer Review History: PLOS recognizes the benefits of transparency in the peer review process; therefore, we enable the publication of all of the content of peer review and author responses alongside final, published articles. The editorial history of this article is available here:
https://doi.org/10.1371/journal.pone.0232572
Copyright:© 2020 Huttin et al. This is an open access article distributed under the terms of the
Creative Commons Attribution License, which permits unrestricted use, distribution, and reproduction in any medium, provided the original author and source are credited.
Data Availability Statement: All relevant data are within the paper and Supporting Information files. Funding: The funders had no role in study design, data collection and analysis, decision to publish, or
0.002), together with the baseline levels of SVR and left ventricular end-diastolic volume, whereas indices of MI severity and left ventricular function were not. In conclusion, plasma Galectin-3 predicts a deleterious vascular dysfunction affecting post-MI patients, an obser-vation that could lead to consider new therapeutic targets if confirmed through dedicated prospective studies.
Introduction
In the previous “REMI” (relation between aldosterone and cardiac REmodeling after Myocar-dial Infarction) cohort, a lower recovery in cardiac function was documented in patients for whom systemic vascular resistances (SVR) were abnormally high during the post-myocardial infarction (MI) healing period, independently of MI severity and in spite of the commonly prescribed vasodilator regimens (Angiotensin Converting Enzyme Inhibitors (ACEI) or Angiotensin Receptor Blockers (ARBs)) [1]. Such patients with high SVR may be difficult to detect after MI, as well as in the more general setting of heart failure, hypertension being fre-quently masked by decreases in cardiac contractility and stroke volume [1,2]. In these situa-tions, it is likely that SVR measurements by non-invasive techniques [1–4] may help in assessing the usefulness of further decreasing SVR by vasodilating treatments. Such decreases in SVR were indeed previously shown to provide proportional enhancements in cardiac out-put after MI [5].
Furthermore, the mechanism of this vascular dysfunction, leading to high SVR in spite of post-MI vasodilator treatment, warrants further clarification. It is likely that the renin-angio-tensin-aldosterone system (RASS), a key modulator of vascular function and ischemic remod-eling, should be assessed in this setting [6,7], as well as certain biomarkers of inflammation and fibrosis. This is particularly the case of Galactin-3, a plasma biomarker of cardiovascular inflammation and fibrosis [8], which is an established predictor of cardiac remodeling and outcome of post-MI patients and which was recently shown to be linked to SVR in certain populations with inflammatory diseases [9]. This analysis should also consider certain hemo-dynamic factors, especially the fact that higher SVR are required for maintaining a sufficiently high blood pressure (BP) in patients presenting the lowest stroke volumes [3,5,10,11].
In light of the above, this ancillary and exploratory analysis of the “REMI” post-MI cohort [1] was aimed at characterizing those patients suffering from high SVR remotely from MI with a large a panel of cardiovascular MRI parameters and blood biomarkers.
Material and methods
Study population
As previously described in detail for this “REMI” (relation between aldosterone and cardiac REmodeling after Myocardial Infarction) cohort [1], patients successfully treated by primary percutaneous transluminal coronary angioplasty for a first MI and with an initial occlusion or sub-occlusion of the MI-related coronary artery at angiography, were prospectively included. Main exclusion criteria were: any other significant cardiac disease, any contraindication to MRI, absence of sinus cardiac rhythm, a multivessel disease at coronary angiography, and a
>12h delay-time between the onset of chest pain and reperfusion.
All subjects gave signed informed consent to participate. The study protocol complied with the principles of the Declaration of Helsinki, was approved by the local Ethics Committee preparation of the manuscript. Academic fundings
were obtained through the French “Programme Hospitalier de Recherche Clinique” (2010) and the RHU FIGHT-HF program (ANR-15-RHU-0004) Competing interests: The authors have declared that no competing interests exist.
(Comite´ de Protection des Personnes EST-III, agreement n˚ 2009-A00537-50) and registered on the ClinicalTrials.gov site (NCT01109225). The protocol of the REMI study is available as
S2 Protocol.
Study design
Blood sampling and cardiovascular MRI were performed at 2 to 4 days after acute MI reperfu-sion and 6 months (± 15 days) later. Patients showing abnormally high SVR at 6 months were compared with the other study patients for MRI parameters of cardiac and vascular function and of infarct size, as well as for plasma biomarkers of heart failure (Brain Natriuretic Peptide (BNP)), myocardial necrosis (peak Creatine Kinase-MB and Troponin) and systemic inflam-mation and/or RASS activation (C-Reactive Protein, Neutrophil Gelatinase-Associated Lipo-calin (NGAL [12]), Galectin-3 [13], active Renin and Aldosterone [6]. Glomerular filtration rate (eGFR) was estimated in ml/min per 1.73 m2body surface area with the CKD-EPI equa-tion [14].
Cardiovascular MRI
As detailed previously [1,3,4], MRI exams were performed on a single 3.0 Tesla magnet (Signal HDxt, GE Healthcare, Milwaukee, Wisconsin) with a cardiac coil. Systolic, diastolic and mean brachial blood BP were measured with an automated sphygmomanometer (Maglife C, Schiller Medical, Wissembourg, France). Three measurements were obtained during each MRI exami-nation and mean values were stored for analyses herein.
A steady-state free precession pulse sequence was used to assess cardiac function in contig-uous short axis planes, as previously detailed [3,4], and LV end-diastolic volume, end-systolic volume, LV mass and ejection fraction were obtained using dedicated software (MASS research v2013-exp™, Medis, Leiden University Medical Center, The Netherlands). The LV concentric remodeling index was computed as the LV mass over end-diastolic volume ratio [1,3,4].
The MI area was analyzed on 8 to 10 short axis slices covering the LV volume and on verti-cal and horizontal mid-ventricular long-axis slices, which were all recorded with a
T1-weighted segmented phase-sensitive inversion-recovery (PSIR) sequence, 10 to 15 minutes after the injection of a gadolinium-labeled tracer (0.1 mmol.kg-1body weight of Dotarem1, GUERBET, France). The MI volume was considered as that showing a late gadolinium enhancement by visual analysis and was expressed in % of the total LV volume by using a 17-segment LV division and while taking into account the number of quartiles involved in each segment [1]. The MI volume with microvascular obstruction was determined as that showing a central hypo-enhancement within the bright signal of delayed enhancement [1].
Aortic stroke volume (SV) indexed to body surface area was determined in the ascending aorta by using a velocity-encoded phase-contrast gradient-echo sequence and the “CV flow” quantification software (Leiden University Medical Center, Medis, The Netherlands) [1,3,4]. Indexed SV was used to calculate cardiac index (SV x heart rate) and systemic vascular resis-tance (SVR: mean BP / cardiac index). SVR values above 40 mmHg.min.m2.L-1were consid-ered as abnormal. This threshold corresponds to the upper limit of the 95% confidence interval in an already-described normal population of 100 subjects with comparable age range and MRI protocol as that in the population of subjects in the current study [3].
Statistical analyses
All analyses were performed using the SAS software version 9.4 (SAS Institute Inc., Cary, NC, USA). The two-tailed significance level was set at P <0.05.
Continuous variables are expressed as median with interquartile range (Q1 –Q3) and cate-gorical variables as frequencies (percentages). Comparisons of characteristics between SVR groups were carried out using non parametric Kruskall-Wallis tests for continuous variables and Fisher’s exact tests for categorical variables.
Associations between the baseline characteristics and the SVR status were additionally assessed using univariable and multivariable ordinal logistic regression models with baseline characteristics as explanatory variables and the three SVR categories as outcome variable, namely SVR- (as reference category), SVR+ and SVR++. Odd ratios (ORs) are reported with 95% confidence interval. Overall p-values of univariable logistic regressions were corrected for multiple testing using a false discovery rate (FDR) of 5%, applying the Benjamini–Hochberg procedure.
Assumption of log linearity for continuous variables was verified using restricted cubic spline with 3 knots. When log linearity was not met, variables were dichotomized according to the median.
A multivariable ordinal logistic regression model was built using a backward selection pro-cedure (p-to-remove = 0.10 because of the small sample size) applied to variables with cor-rected overall p-values less than 0.20 at univariable logistic regression analyses.
Results
Baseline patient characteristics
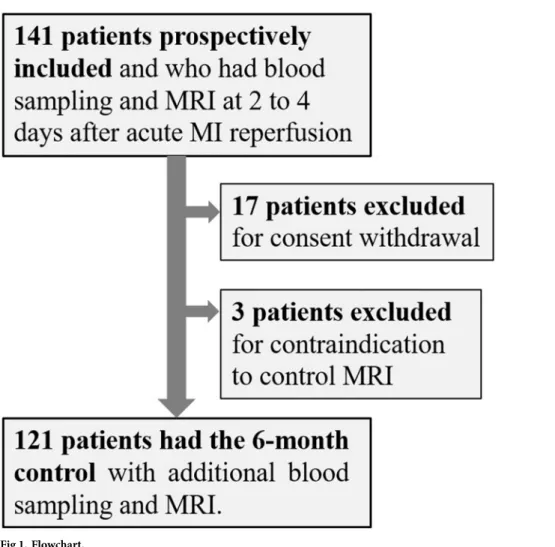
A total of 141 patients were initially included. However, MRI was not performed at 6 months in 3 patients due to contraindications and another 17 due to consent withdrawals, thereby leaving 121 patients for the final analysis (see flowchart inFig 1). Median age was 57.7 years (interquartile range: 49.0–63.2 years), 18 (15%) were women and the MI-related vessel was the left anterior descending artery in 63 patients (52%).
Six-month evolution
At 6 months, 101 of the 121 patients (84%) were under beta-blocker treatment and 104 (86%) were under ACEI although only half received the recommended prescribed dose targeted in post-MI trials. Only 6 patients (5%) received mineralocorticoid receptor antagonist treatment.
In the overall population, there were significant improvement in cardiac function with increases from baseline to 6 months in LV ejection fraction (42.8% (37.6%-48.2%) vs. 49.9% (42.8%-54.8%), p < 0.001) and in cardiac index (in L.min-1.m-2: 2.40 (2.15–2.71) vs. 2.58 (2.37–2.97), p < 0.001), together with a significant decrease in SVR (in mmHg.min.m2.L-1: 39.4 (31.7–44.0) vs. 34.8 (29.8–40.2), p = 0.001). SVR were normal at 6 months in 90 patients (SVR- group), but abnormally high in 31 (26%), among whom 21 already had high SVR at baseline (SVR++ group) while the remaining 10 did not (SVR+ group).
As detailed inTable 1, the SVR-, SVR+ and SVR++ groups were comparable in terms of medical regimen with high rates for beta-blockers and ACEI in all groups. However, when compared with SVR-, both SVR+ and SVR++ had evidence of a lower cardiac recovery from baseline to 6 months with a lower increase in LV ejection fraction (for the difference between 6 months and baseline, SVR+: +2.7% (-2.0% - 5.3%) and SVR++: +4.5% (0.8% - 8.4%) vs. SVR-: +8.7% (4.0% - 12.8%), both p � 0.05) and with a lower cardiac index achieved at 6 months (in L.min-1.m-2: SVR+: 2.12 (1.94–2.38) and SVR++: 2.14 (1.92–2.47) vs. SVR-: 2.70 (2.47–3.12), both p < 0.05) (Table 2).
Baseline predictors of abnormally high SVR at 6 months
Although patient distribution between the SVR-, SVR+ and SVR++ groups was significantly related to several baseline variables (see Tables1and2), only the baseline level of Galectin-3 was significantly different in both SVR+ (14.4 (12.3–16.7) ng.mL-1) and SVR++ (13.0 (11.7– 19.4) ng.mL-1) compared to SVR- (11.7 (9.8–13.5) ng.mL-1, both p < 0.05).
In addition, patients from the SVR++ group had a high rate of history of hypertension (52%,Table 1) and a particular hemodynamic profile at baseline involving not only higher SVR, but also higher LV concentric remodeling, smaller LV end-diastolic volumes and smaller stroke volumes (Table 2).
By contrast, the SVR-, SVR+ and SVR++ groups were comparable for all baseline indices of MI severity and cardiac function–i.e. Creatine Kinase-MB and Troponin peaks, BNP level, MRI areas of MI or microvascular obstruction, and LV ejection fraction (Tables1and2).
Finally, in ordinal logistic regression analyses (Table 3), univariable baseline predictors of SVR+ and SVR++ patients were: plasma Galectin-3, a LV end-diastolic volume < 90 mL.m-2, a diastolic blood pressure > 70 mmHg, and all SV-derived parameters (SV, cardiac index, SVR). The three best independent baseline predictors selected through multivariable analysis were plasma Galectin-3 (p = 0.010), a LV end-diastolic volume < 90 mL.m-2(p = 0.022) and SVR (p = 0.003) (Table 3). These 3 selected parameters remained unchanged when age and/or renal function (estimated by the glomerular filtration rate) were forced into the model. Fig 1. Flowchart.
Discussion
The main findings of the present study are that patients at risk of suffering from high SVR after 6 months of post-MI treatment: 1) did not have higher MI severity or LV dysfunction at baseline, as assessed by cardiac enzymes and MRI variables, and 2) may be predicted at base-line by Galactin-3 plasma level.
High SVR are mainly due to structural and functional changes in small arteries with a con-stant decrease in lumen diameter and possible increases in wall thickness and wall fibrosis. All of these structural changes are commonly documented during the normal aging process, together with an increase in the stiffness of large arteries, and may be accelerated by hyperten-sion and various metabolic and inflammatory disorders [15]. However, SVR may also increase in response to various neurohormonal factors such as those triggered for increasing perfusion pressures in hypovolemic shock or heart failure [5].
A vascular dysfunction, leading to high SVR, was already shown to be potentially delete-rious in post-MI patients, due to increased LV wall stress [5,16] and, as observed in the pres-ent study cohort, likely limiting subsequpres-ent recovery in LV ejection fraction and cardiac output. An at-least partial recovery of cardiac function is a common observation during the post-MI healing period [1] and is also a consequence of the prescribed vasodilator therapies with the increase in stroke volume and cardiac output being proportional to the decrease in SVR [5].
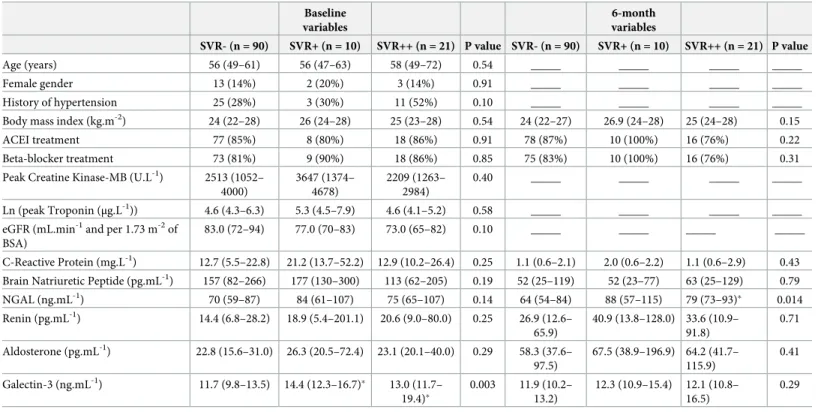
Table 1. Comparisons of clinical variables and blood biomarkers between patients with normal SVR at 6 months (SVR-), those with abnormal SVR only at 6 months (SVR+) and those with abnormal SVR both at baseline and 6 months (SVR++).
Baseline variables 6-month variables SVR- (n = 90) SVR+ (n = 10) SVR++ (n = 21) P value SVR- (n = 90) SVR+ (n = 10) SVR++ (n = 21) P value Age (years) 56 (49–61) 56 (47–63) 58 (49–72) 0.54 _____ _____ _____ _____ Female gender 13 (14%) 2 (20%) 3 (14%) 0.91 _____ _____ _____ _____ History of hypertension 25 (28%) 3 (30%) 11 (52%) 0.10 _____ _____ _____ _____ Body mass index (kg.m-2) 24 (22–28) 26 (24–28) 25 (23–28) 0.54 24 (22–27) 26.9 (24–28) 25 (24–28) 0.15 ACEI treatment 77 (85%) 8 (80%) 18 (86%) 0.91 78 (87%) 10 (100%) 16 (76%) 0.22 Beta-blocker treatment 73 (81%) 9 (90%) 18 (86%) 0.85 75 (83%) 10 (100%) 16 (76%) 0.31 Peak Creatine Kinase-MB (U.L-1) 2513 (1052–
4000) 3647 (1374– 4678) 2209 (1263– 2984) 0.40 _____ _____ _____ _____ Ln (peak Troponin (μg.L-1)) 4.6 (4.3–6.3) 5.3 (4.5–7.9) 4.6 (4.1–5.2) 0.58 _____ _____ _____ _____ eGFR (mL.min-1and per 1.73 m-2of
BSA)
83.0 (72–94) 77.0 (70–83) 73.0 (65–82) 0.10 _____ _____ _____ _____ C-Reactive Protein (mg.L-1) 12.7 (5.5–22.8) 21.2 (13.7–52.2) 12.9 (10.2–26.4) 0.25 1.1 (0.6–2.1) 2.0 (0.6–2.2) 1.1 (0.6–2.9) 0.43 Brain Natriuretic Peptide (pg.mL-1) 157 (82–266) 177 (130–300) 113 (62–205) 0.19 52 (25–119) 52 (23–77) 63 (25–129) 0.79 NGAL (ng.mL-1) 70 (59–87) 84 (61–107) 75 (65–107) 0.14 64 (54–84) 88 (57–115) 79 (73–93)� 0.014 Renin (pg.mL-1) 14.4 (6.8–28.2) 18.9 (5.4–201.1) 20.6 (9.0–80.0) 0.25 26.9 (12.6– 65.9) 40.9 (13.8–128.0) 33.6 (10.9– 91.8) 0.71 Aldosterone (pg.mL-1) 22.8 (15.6–31.0) 26.3 (20.5–72.4) 23.1 (20.1–40.0) 0.29 58.3 (37.6– 97.5) 67.5 (38.9–196.9) 64.2 (41.7– 115.9) 0.41 Galectin-3 (ng.mL-1) 11.7 (9.8–13.5) 14.4 (12.3–16.7)� 13.0 (11.7– 19.4)� 0.003 11.9 (10.2– 13.2) 12.3 (10.9–15.4) 12.1 (10.8– 16.5) 0.29
ACEI, Angiotensin Converting Enzyme Inhibitors; BSA: body surface area; eGFR, estimated glomerular filtration rate; NGAL, Neutrophil Gelatinase-Associated Lipocalin.
�: p<0.05 for comparisons of SVR+ or SVR++ vs. SVR-, and
†: p<0.05 for comparisons of SVR++ vs. SVR+ at the same time point (baseline or 6 months).
The present observation of a strong and independent relationship between elevated plasma Galectin-3 and increasing SVR was also documented recently, but in a very different cohort of patients with low-grade systemic inflammation (long-standing rheumatoid arthritis) [9]. This relationship is further strengthened by prior observations that plasma Galectin-3 is indepen-dently related to various systemic arterial diseases in asymptomatic individuals (aortic stiff-ness, atherosclerosis) [9,17,18].
Galectin-3 is mainly expressed in fibroblasts, endothelial cells as well as in inflammatory cells such as activated macrophages, and is considered a key link between inflammation and fibrosis for the cardiovascular system [8]. While Galectin-3 is a profibrotic agent in itself, it also mediates aldosterone-induced fibrosis within the vessels, as well as within the heart and kidney [13]. It additionally regulates chronic vascular inflammation, promoting osteogenic differentiation of vascular smooth muscle cells and vessel calcification [19], and furthermore acts as an amplifier of inflammation in atherosclerotic plaque progression through macro-phage activation and monocyte chemoattraction [20].
In clinical routine, Galectin-3 can be used to improve risk stratification in heart failure patients [21], and its predictive value for adverse cardiovascular events has also been demon-strated in non-heart failure patients [22].
Table 2. Comparisons of hemodynamic and cardiovascular MRI variables between patients with normal SVR at 6 months (SVR-), those with abnormal SVR only at 6 months (SVR+) and those with abnormal SVR both at baseline and 6 months (SVR++).
Baseline variables 6-month variables SVR- (n = 90) SVR+ (n = 10) SVR++ (n = 21) P value SVR- (n = 90) SVR+ (n = 10) SVR++ (n = 21) P value Heart rate (bpm) 64 (57–72) 67 (61–73) 62 (59–71) 0.70 58 (52–62) 55 (53–57) 55 (53–61) 0.38 Systolic blood pressure (mmHg) 125 (110–139) 111 (101–126) 138 (123–149)† 0.019 124 (115–134) 129 (122–143) 150 (140–163)� <
0.001 Diastolic blood pressure (mmHg) 73 (65–82) 65 (61–70) 79 (73–85)† 0.005 68 (63–75) 76 (66–84) 80 (72–90)� <
0.001 Mean blood pressure (mmHg) 90 (81–102) 83 (75–89) 99 (91–105)† 0.005 86 (80–95) 93 (84–105) 104 (95–114)� <
0.001 LV ejection fraction (%) 43 (37–48) 42 (33–49) 43 (39–47) 0.91 51 (45–56) 42 (37–50)� 49 (44–52) 0.034 LV end-diastolic volume (mL.m-2) 94 (83–105) 92 (86–104) 82 (69–87)�† < 0.001 99 (85–107) 88 (83–100) 87 (75–92)� 0.005 LV end-systolic volume (mL.m-2) 53 (44–63) 54 (46–63) 45 (39–51)� 0.004 47 (39–58) 50 (43–61) 43 (35–50) 0.21 LV mass (g.m-2) 55 (49–60) 53 (49–58) 52 (47–56) 0.39 46 (42–52) 43 (39–48) 46 (41–49) 0.46 LV concentric remodeling index 0.58 (0.53–
0.64) 0.56 (0.54–0.58) 0.63 (0.58–0.73)� 0.029 0.47 (0.42– 0.53) 0.49 (0.41–0.53) 0.56 (0.52– 0.59)� 0.003 MI volume at MRI (% of LV) 21 (12–31) 26 (7–34) 22 (13–28) 0.87 13 (7–24) 20 (7–28) 12 (10–19) 0.66 Microvascular obstruction (% of LV) 2 (0–9) 4 (0–12) 0 (0–9) 0.82 _____ _____ _____ _____
Stroke volume index (mL.m-2) 39.7 (34.0– 43.9) 38 (32–43) 33.8 (28.2–37.0)� 0.003 48.6 (44.8– 53.9) 42.4 (34.3–45.2)� 38.6 (32.1– 45.4)� < 0.001 Cardiac index (L.min-1.m-2) 2.52 (2.18–
2.82) 2.41 (2.31–2.67) 2.22 (1.96– 2.31)�† 0.002 2.70 (2.47– 3.12) 2.12 (1.94–2.38)� 2.14 (1.92– 2.47)� < 0.001 SVR (mmHg.min.m2.L-1) 36.7 (31.1– 42.8) 34.1 (29.8–35.8) 44.5 (42.9– 47.7)�† <0.001 31.8 (28.2– 35.4) 42.4 (40.7–48.7)� 48.5 (43.9– 52.1)� <0.001
LV, left ventricle; MI, myocardial infarction; NS, non significant with a p value < 0.10; SVR, systemic vascular resistance
�: p<0.05 for comparisons of SVR+ or SVR++ vs. SVR-, and
†
: p<0.05 for comparisons of SVR++ vs. SVR+ at the same time point (baseline or 6 months).
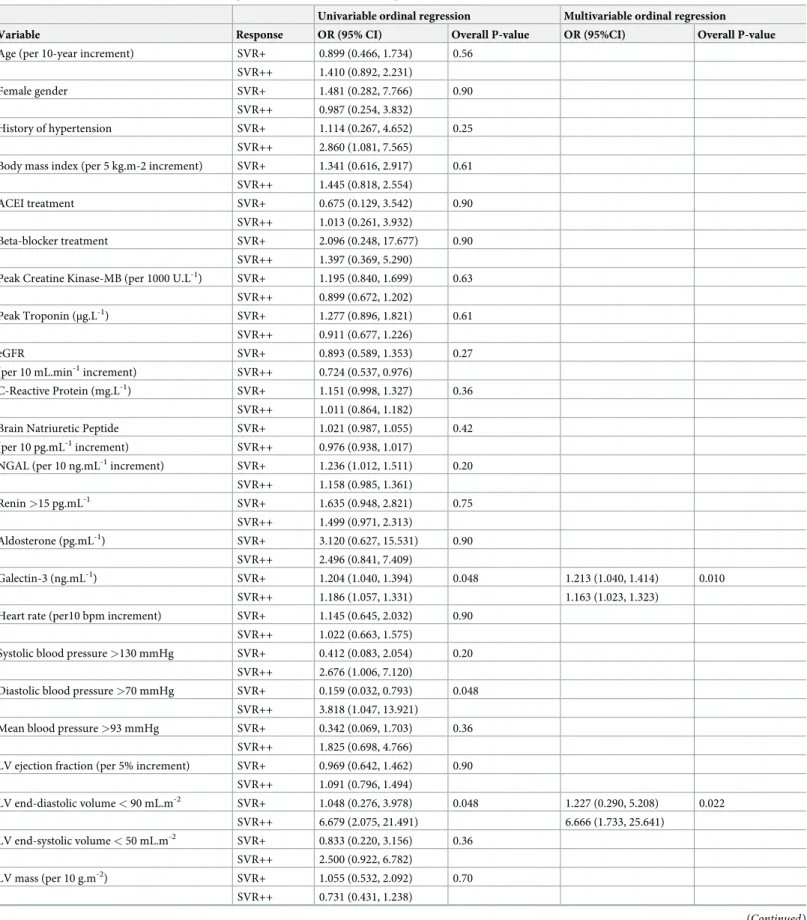
Table 3. Univariable and multivariable baseline predictors of SVR+ and SVR++ patients with odds ratios (OR) and 95% confidence intervals. Univariable ordinal regression Multivariable ordinal regression Variable Response OR (95% CI) Overall P-value OR (95%CI) Overall P-value Age (per 10-year increment) SVR+ 0.899 (0.466, 1.734) 0.56
SVR++ 1.410 (0.892, 2.231)
Female gender SVR+ 1.481 (0.282, 7.766) 0.90
SVR++ 0.987 (0.254, 3.832)
History of hypertension SVR+ 1.114 (0.267, 4.652) 0.25 SVR++ 2.860 (1.081, 7.565)
Body mass index (per 5 kg.m-2 increment) SVR+ 1.341 (0.616, 2.917) 0.61 SVR++ 1.445 (0.818, 2.554)
ACEI treatment SVR+ 0.675 (0.129, 3.542) 0.90
SVR++ 1.013 (0.261, 3.932)
Beta-blocker treatment SVR+ 2.096 (0.248, 17.677) 0.90 SVR++ 1.397 (0.369, 5.290)
Peak Creatine Kinase-MB (per 1000 U.L-1) SVR+ 1.195 (0.840, 1.699) 0.63 SVR++ 0.899 (0.672, 1.202)
Peak Troponin (μg.L-1) SVR+ 1.277 (0.896, 1.821) 0.61 SVR++ 0.911 (0.677, 1.226)
eGFR SVR+ 0.893 (0.589, 1.353) 0.27
(per 10 mL.min-1increment) SVR++ 0.724 (0.537, 0.976)
C-Reactive Protein (mg.L-1) SVR+ 1.151 (0.998, 1.327) 0.36 SVR++ 1.011 (0.864, 1.182)
Brain Natriuretic Peptide SVR+ 1.021 (0.987, 1.055) 0.42 (per 10 pg.mL-1increment) SVR++ 0.976 (0.938, 1.017)
NGAL (per 10 ng.mL-1increment) SVR+ 1.236 (1.012, 1.511) 0.20 SVR++ 1.158 (0.985, 1.361) Renin >15 pg.mL-1 SVR+ 1.635 (0.948, 2.821) 0.75 SVR++ 1.499 (0.971, 2.313) Aldosterone (pg.mL-1) SVR+ 3.120 (0.627, 15.531) 0.90 SVR++ 2.496 (0.841, 7.409) Galectin-3 (ng.mL-1) SVR+ 1.204 (1.040, 1.394) 0.048 1.213 (1.040, 1.414) 0.010 SVR++ 1.186 (1.057, 1.331) 1.163 (1.023, 1.323)
Heart rate (per10 bpm increment) SVR+ 1.145 (0.645, 2.032) 0.90 SVR++ 1.022 (0.663, 1.575)
Systolic blood pressure >130 mmHg SVR+ 0.412 (0.083, 2.054) 0.20 SVR++ 2.676 (1.006, 7.120)
Diastolic blood pressure >70 mmHg SVR+ 0.159 (0.032, 0.793) 0.048 SVR++ 3.818 (1.047, 13.921)
Mean blood pressure >93 mmHg SVR+ 0.342 (0.069, 1.703) 0.36 SVR++ 1.825 (0.698, 4.766)
LV ejection fraction (per 5% increment) SVR+ 0.969 (0.642, 1.462) 0.90 SVR++ 1.091 (0.796, 1.494) LV end-diastolic volume < 90 mL.m-2 SVR+ 1.048 (0.276, 3.978) 0.048 1.227 (0.290, 5.208) 0.022 SVR++ 6.679 (2.075, 21.491) 6.666 (1.733, 25.641) LV end-systolic volume < 50 mL.m-2 SVR+ 0.833 (0.220, 3.156) 0.36 SVR++ 2.500 (0.922, 6.782) LV mass (per 10 g.m-2) SVR+ 1.055 (0.532, 2.092) 0.70 SVR++ 0.731 (0.431, 1.238) (Continued )
Previous studies have failed to clearly and consensually show that Galectin-3 was a predic-tor of ventricular remodeling after MI [20], and in the present study, the plasma level of Galec-tin-3 was not directly predictive of this remodeling—i.e. with a lack of any significant
correlation between baseline Galectin-3 and the 6-month evolutions in LV volume or EF (results not shown). This is presumably due to the complex cardiac effects of Galectin-3 with, on the one hand, an upregulation that is known to be highly beneficial in the initial phases of tissue repair and, on the other, an overexpression that could be associated with prolonged inflammation and adverse remodeling [20].
This predictive value is seemingly higher for the post-MI remodeling of systemic arteries since, in our multivariable analysis, a higher Galectin-3 was one of the independent predictors of high SVR at 6 months, with a smaller LV end-diastolic volume and a higher baseline SVR being the other predictors. Smaller end-diastolic volumes are commonly associated with lower cardiac output and thus with higher SVR for maintaining a sufficiently high BP [3,5,10,11]. This hemodynamic profile has been previously associated with hypertensive or pre-hyperten-sive states [3,23], as well as with low exercise training and/or low exercise capacity [10,11].
However, this particular hemodynamic profile was definitely absent at baseline in one third of our patients who nevertheless featured high SVR at 6 months (i.e. those from our SVR + group). This smaller subgroup had different, albeit less precise, baseline characteristics with trends toward lower BP and SVR levels, as well as higher plasma CRP, when compared to the two other groups (Tables1and2). This suggests a distinct inflammatory and hemodynamic context, warranting further analyses in larger populations.
Nevertheless, as already discussed above, these SVR+ patients, as well as the SVR++ patients, were characterized by a higher plasma Galectin-3 level at baseline. In experimental models, anti-aldosterone drugs were already shown to reverse the vascular fibrosis induced by Galec-tin-3 [13]. Therefore, it could be wondered whether an enhancement in the pharmacological blockade of the mineralocorticoid pathway and/or of the RAAS might be beneficial if pre-scribed in a highly selected population of patients for whom plasma Galectin-3 is particularly high at baseline. This is all the more true given that half of our patients did not receive, at 6 months, the doses of ACEI or ARBs targeted in post-MI trials. Such sub-optimal medical Table 3. (Continued)
Univariable ordinal regression Multivariable ordinal regression Variable Response OR (95% CI) Overall P-value OR (95%CI) Overall P-value LV concentric remodeling index>0.58 SVR+ 0.335 (0.066, 1.700) 0.17
SVR++ 2.927 (1.040, 8.235)
MI volume at MRI (% of LV) SVR+ 1.189 (0.678, 2.084) 0.90 SVR++ 0.951 (0.632, 1.432)
Microvascular obstruction SVR+ 1.374 (0.722, 2.616) 0.82 (per 10% of LV increment) SVR++ 1.044 (0.600, 1.819)
Stroke volume index >38 mL.m-2 SVR+ 0.765 (0.207, 2.828) 0.048 SVR++ 0.127 (0.035, 0.464)
Cardiac index >2.4 L.min-1.m-2 SVR+ 0.731 (0.198, 2.704) 0.06 SVR++ 0.172 (0.054, 0.552)
SVR (mmHg.min.m2.L-1) SVR+ 0.914 (0.824, 1.013) 0.03 0.905 (0.812, 1.008) 0.003 SVR++ 1.123 (1.044, 1.208) 1.109 (1.031, 1.194)
eGFR: estimated glomerular filtration rate; LV, left ventricle; MI: myocardial infarction; NGAL, Neutrophil Gelatinase-Associated Lipocalin; SVR, systemic vascular resistances.
regimens have already been documented and explained by contraindications and intolerance issues but also by an underestimation of treatment benefit [24–26].
Finally, several carbohydrate- or peptide-based inhibitors of Galectin-3 are under develop-ment, particularly for oncologic indications [27]. In the future, their effects on post-MI patients and especially on those with high plasma Galectin-3 levels could likely be the subject of dedicated studies.
Except for physical activity, the main factors known to drive SVR were tested in the present study–i.e. age, kidney function, cardiac function, drug treatment (in particular ACEI/ARBs and beta-blockers)–none of which were found to provide any additional predictive informa-tion with regard to that achieved by the baseline levels of Galectin-3, LV end-diastolic volume and SVR. This could at least be partly explained by the low sample size of the present study population. However, this may also be explained by the particular conditions of the post-MI period where SVR are strongly affected by a cascade of adaptive hemodynamic mechanisms and neurohormonal changes and by the introduction of interfering vasoactive treatments, thereby minimizing the impact of other factors.
The main limitation of the present study is its exploratory nature and thus, further dedi-cated, larger-scale prospective studies, designed at providing a more accurate assessment of the predictive value of Galectin-3 in this setting, are required.
Conclusion
This ancillary and observational analysis of the “REMI” cohort shows firstly that patients suf-fering from high SVR remotely from MI exhibit a lower recovery of cardiac function and sec-ondly, that the risk of such vascular dysfunction may be predicted by higher plasma Galectin-3, but not by indices of MI severity or left ventricular function. Although these finding need to be confirmed through further dedicated prospective studies, the present observational results suggest particular mechanisms and potential therapeutic targets for further decreasing SVR and thereby enhancing cardiac function in selected patient groups.
Supporting information
S1 Dataset.(XLS)
S1 Checklist. CONSORT 2010 checklist of information to include when reporting a rando-mised trial�. (DOC) S1 Protocol. (DOC) S2 Protocol. (DOCX)
Author Contributions
Conceptualization: Olivier Huttin, Faïez Zannad, Pierre-Yves Marie.
Formal analysis: Zohra Lamiral, Nicolas Girerd. Funding acquisition: Patrick Rossignol.
Methodology: Damien Mandry, Freddy Odille, Emilien Micard, Zohra Lamiral.
Resources: Olivier Huttin, Damien Mandry, Batric Popovic, Freddy Odille, Emilien Micard,
Faïez Zannad, Nicolas Girerd, Pierre-Yves Marie.
Software: Emilien Micard.
Supervision: Patrick Rossignol, Faïez Zannad.
Validation: Damien Mandry, Patrick Rossignol, Zohra Lamiral, Faïez Zannad, Nicolas Girerd.
Writing – original draft: Pierre-Yves Marie.
Writing – review & editing: Olivier Huttin, Damien Mandry, Patrick Rossignol, Faïez Zan-nad, Nicolas Girerd, Pierre-Yves Marie.
References
1. Huttin O, Mandry D, Eschalier R, Zhang L, Micard E, Odille F, et al. Cardiac remodeling following reper-fused acute myocardial infarction is linked to the concomitant evolution of vascular function as assessed by cardiovascular magnetic resonance. J Cardiovasc Magn Reson. 2017; 19(1):2.https://doi.org/10. 1186/s12968-016-0314-6PMID:28063459
2. Parrott CW1, Quale C, Lewis DL, Ferguson S, Brunt R, Glass S. Systolic blood pressure does not reli-ably identify vasoactive status in chronic heart failure. Am J Hypertens. 2005; 18: 82S–86S.https://doi. org/10.1016/j.amjhyper.2004.11.024PMID:15752937
3. Marie PY, Mandry D, Huttin O, Micard E, Bonnemains L, Girerd N, et al. Comprehensive monitoring of cardiac remodeling with aortic stroke volume values provided by a phase-contrast MRI sequence. J Hypertens 2016; 34(5):967–973.https://doi.org/10.1097/HJH.0000000000000889PMID:26909645
4. Mandry D, Eschalier R, Kearney-Schwartz A, Rossignol P, Joly L, Djaballah W, et al. Comprehensive MRI analysis of early cardiac and vascular remodeling in middle-aged patients with abdominal obesity. J Hypertens 2012; 30;567–573.https://doi.org/10.1097/HJH.0b013e32834f6f3fPMID:22227821
5. Cole RT, Gheorghiade M, Georgiopoulou VV, Gupta D, Marti CN, Kalogeropoulos AP, et al. Reassess-ing the use of vasodilators in heart failure. Expert Rev Cardiovasc Ther 2012; 10(9):1141–1151.https:// doi.org/10.1586/erc.12.108PMID:23098150
6. Te Riet L, van Esch JH, Roks AJ, van den Meiracker AH, Danser AH. Hypertension: renin-angiotensin-aldosterone system alterations. Circ Res 2015; 116(6):960–975.https://doi.org/10.1161/
CIRCRESAHA.116.303587PMID:25767283
7. Hanif K, Bid HK, Konwar R. Reinventing the ACE inhibitors: some old and new implications of ACE inhi-bition. Hypertens Res 2010; 33(1):11–21.https://doi.org/10.1038/hr.2009.184PMID:19911001
8. Hogas S, Bilha SC, Branisteanu D, Hogas M, Gaipov A, Kanbay M, et al. Potential novel biomarkers of cardiovascular dysfunction and disease: cardiotrophin-1, adipokines and Galectin-3. Arch Med Sci. 2017; 13(4): 897–913.https://doi.org/10.5114/aoms.2016.58664PMID:28721158
9. Anyfanti P, Gkaliagkousi E, Gavriilaki E, Triantafyllou A, Dolgyras P, Galanopoulou V, et al. Association of Galectin-3 with markers of myocardial function, atherosclerosis, and vascular fibrosis in patients with rheumatoid arthritis. Clin Cardiol. 2019; 42(1): 62–68.https://doi.org/10.1002/clc.23105PMID:
30353563
10. Maeder MT, Thompson BR, Brunner-La Rocca HP, Kaye DM. Hemodynamic basis of exercise limita-tion in patients with heart failure and normal ejeclimita-tion fraclimita-tion. J Am Coll Cardiol. 2010; 56(11): 855– 863.https://doi.org/10.1016/j.jacc.2010.04.040PMID:20813283
11. Meyer M, McEntee RK, Nyotowidjojo I, Chu G, LeWinter MM. Relationship of exercise capacity and left ventricular dimensions in patients with a normal ejection fraction. An exploratory study. PLoS One. 2015; 10(3): e0119432.https://doi.org/10.1371/journal.pone.0119432PMID:25756359
12. Tarjus A, Martı´nez-Martı´nez E, Amador C, Latouche C, El Moghrabi S, Berger T, et al. Neutrophil Gela-tinase-Associated Lipocalin, a Novel Mineralocorticoid Biotarget, Mediates Vascular Profibrotic Effects of Mineralocorticoids. Hypertension 2015; 66(1):158–166.https://doi.org/10.1161/
HYPERTENSIONAHA.115.05431PMID:25987661
13. Calvier L, Miana M, Reboul P, Martinez-Martinez E, de Boer RA, Poirier F, et al. Galectin-3 mediates aldosterone-induced vascular fibrosis. Arterioscler Thromb Vasc Biol 2013; 33(1):67–75.https://doi. org/10.1161/ATVBAHA.112.300569PMID:23117656
14. Levey AS, Stevens LA, Schmid CH, Zhang YL, Castro AF, Feldman HI, et al. A new equation to esti-mate glomerular filtration rate. Ann Intern Med 2009; 150:604–612. https://doi.org/10.7326/0003-4819-150-9-200905050-00006PMID:19414839
15. Rizzoni D, Rizzoni M, Nardin M, Chiarini G, Agabiti-Rosei C, Aggiusti C, et al. Vascular Aging and Dis-ease of the Small Vessels. High Blood Press Cardiovasc Prev 2019; 26(3):183–189.https://doi.org/10. 1007/s40292-019-00320-wPMID:31144248
16. D’Elia N, D’hooge J, Marwick TH. Association between myocardial mechanics and ischemic LV remod-eling. JACC Cardiovasc Imaging 2015; 8(12):1430–1443.https://doi.org/10.1016/j.jcmg.2015.10.005
PMID:26699112
17. Libhaber E, Woodiwiss AJ, Raymond A, Gomes M, Maseko MJ, Sareli P, et al. Independent associa-tions of circulating galectin-3 concentraassocia-tions with aortic pulse wave velocity and wave reflection in a community sample. Hypertension. 2015. 65: 1356–1364.https://doi.org/10.1161/
HYPERTENSIONAHA.115.05159PMID:25824247
18. Madrigal-Matute J, Lindholt JS, Fernandez-Garcia CE, Benito-Martin A, Burillo E, Zalba G, et al. Galec-tin-3, a biomarker linking oxidative stress and inflammation with the clinical outcomes of patients with atherothrombosis. J Am Heart Assoc. 2014; 3: 1–13.
19. Menini S, Iacobini C, Ricci C, Blasetti Fantauzzi C, Salvi L. The galectin-3/RAGE dyad modulates vas-cular osteogenesis in atherosclerosis. Cardiovasc Res. 2013; 100: 472–480.https://doi.org/10.1093/ cvr/cvt206PMID:23975852
20. Li M, Yuan Y, Guo K, Lao Y, Huang X, Feng L. Value of Galectin-3 in Acute Myocardial Infarction. Am J Cardiovasc Drugs. 2019.https://doi.org/10.1007/s40256-019-00387-9[Epub ahead of print] PMID:
31784887
21. Yancy CW, Jessup M, Bozkurt B, Butler J, Casey DE Jr, Drazner MH, et al. 2013 ACCF/AHA guideline for the management of heart failure. J Am Coll Cardiol. 2013; 62: e147–e239.https://doi.org/10.1016/j. jacc.2013.05.019PMID:23747642
22. Jagodzinski A, Havulinna AS, Appelbaum S, Zeller T, Jousilahti P, Skytte-Johanssen S, et al. Predictive value of galectin-3 for incident cardiovascular disease and heart failure in the population-based FIN-RISK 1997 cohort. Int J Cardiol. 2015; 192: 33–39.https://doi.org/10.1016/j.ijcard.2015.05.040PMID:
25985013
23. Da´vila DF, Donis JH, Odreman R, Gonzalez M, Landaeta A. Patterns of left ventricular hypertrophy in essential hypertension: should echocardiography guide the pharmacological treatment? Int J Cardiol. 2008; 124: 134–138.https://doi.org/10.1016/j.ijcard.2007.01.089PMID:17467083
24. Gislason GH, Rasmussen JN, Abildstrom SZ, Gadsboll N, Buch P, Friberg J, et al. Long term compli-ance with beta-blockers, angiotensin-converting enzyme inhibitors, and statins after acute myocardial infarction. European Heart Journal 2006; 27:1153–1158.https://doi.org/10.1093/eurheartj/ehi705
PMID:16399775
25. Bezin J, Pariente A, Lassalle R, Dureau-Pournin C, Abouelfath A, Robinson P, et al. Use of the recom-mended drug combination for secondary prevention after a first occurrence of acute coronary syndrome in France. Eur J Clin Pharmacol 2014; 70(4):429–436.https://doi.org/10.1007/s00228-013-1614-5
PMID:24271648
26. Bagnall AJ, Yan AT, Yan RT, Lee CH, Tan M, Baer C, et al. Optimal medical therapy for non-ST-seg-ment-elevation acute coronary syndromes: exploring why physicians do not prescribe evidence-based treatment and why patients discontinue medications after discharge. Circ Cardiovasc Qual Outcomes 2010; 3(5):530–537.https://doi.org/10.1161/CIRCOUTCOMES.109.919415PMID:20716715
27. Suthahar N, Meijers WC, Sillje´ HHW, Ho JE, Liu F, de Boer RA. Galectin-3 Activation and Inhibition in Heart Failure and Cardiovascular Disease: An Update. Theranostics. 2018; 8(3): 593–609.https://doi. org/10.7150/thno.22196PMID:29344292