Mascot File Parsing and Quantification
(MFPaQ), a New Software to Parse, Validate,
and Quantify Proteomics Data Generated by
ICAT and SILAC Mass Spectrometric Analyses
APPLICATION TO THE PROTEOMICS STUDY OF MEMBRANE PROTEINS FROM PRIMARY HUMANENDOTHELIAL CELLS*
□
SDavid Bouyssie´‡§, Anne Gonzalez de Peredo‡§¶, Emmanuelle Mouton‡,
Renaud Albigot‡, Lucie Roussel
储, Nathalie Ortega储, Corinne Cayrol储,
Odile Burlet-Schiltz‡, Jean-Philippe Girard
储, and Bernard Monsarrat‡
Proteomics strategies based on nanoflow (nano-) LC-MS/MS allow the identification of hundreds to thousands of proteins in complex mixtures. When combined with protein isotopic labeling, quantitative comparison of the proteome from different samples can be achieved using these approaches. However, bioinformatics analysis of the data remains a bottleneck in large scale quantitative proteomics studies. Here we present a new software named Mascot File Parsing and Quantification (MFPaQ) that easily processes the results of the Mascot search engine and performs protein quantification in the case of isotopic labeling experiments using either the ICAT or SILAC (stable isotope labeling with amino acids in cell culture) method. This new tool provides a convenient in-terface to retrieve Mascot protein lists; sort them accord-ing to Mascot scoraccord-ing or to user-defined criteria based on the number, the score, and the rank of identified peptides; and to validate the results. Moreover the software ex-tracts quantitative data from raw files obtained by nano-LC-MS/MS, calculates peptide ratios, and generates a non-redundant list of proteins identified in a multisearch experiment with their calculated averaged and normalized ratio. Here we apply this software to the proteomics anal-ysis of membrane proteins from primary human endothe-lial cells (ECs), a cell type involved in many physiological and pathological processes including chronic inflamma-tory diseases such as rheumatoid arthritis. We analyzed the EC membrane proteome and set up methods for quantitative analysis of this proteome by ICAT labeling. EC microsomal proteins were fractionated and analyzed by nano-LC-MS/MS, and database searches were
per-formed with Mascot. Data validation and clustering of proteins were performed with MFPaQ, which allowed identification of more than 600 unique proteins. The soft-ware was also successfully used in a quantitative differ-ential proteomics analysis of the EC membrane proteome after stimulation with a combination of proinflammatory mediators (tumor necrosis factor-␣, interferon-␥, and lymphotoxin␣/) that resulted in the identification of a full spectrum of EC membrane proteins regulated by inflam-mation. Molecular & Cellular Proteomics 6:1621–1637, 2007.
In recent years, nanoflow (nano-)1LC-MS/MS has emerged
as an efficient alternative to two-dimensional electrophoresis in the field of proteomics. This technology has proved to be a powerful method for the identification of proteins in complex mixtures and has been applied to characterize the proteome of several organisms, organelles, and multiprotein complexes. Moreover many developments have been made to use nano-LC-MS/MS-based strategies in differential proteomics stud-ies to compare the proteome of two or more samples in a quantitative or semiquantitative way. Although recent ap-proaches use direct comparison of the MS peptide signals from independent nano-LC-MS/MS runs (1–5), most studies up to now have used quantitative methods based on isotopic
From the ‡Laboratoire de Prote´omique et Spectrome´trie de Masse des Biomole´cules and 储Laboratoire de Biologie Vasculaire, Equipe Labellise´e “Ligue 2006,” Institut de Pharmacologie et de Biologie Structurale, CNRS UMR 5089, 205 route de Narbonne, 31077 Toulouse, France
Received, December 21, 2006, and in revised form, April 11, 2007 Published, MCP Papers in Press, May 28, 2007, DOI 10.1074/ mcp.T600069-MCP200
1The abbreviations used are: nano-, nanoflow; c-ICAT, cleavable
ICAT; EC, endothelial cell; HUVEC, human umbilical vein endothelial cell; IFN␥, interferon ␥; MFP, Mascot File Parser; MFPaQ, Mascot File Parsing and Quantification; MudPIT, multidimensional protein identi-fication technology; SILAC, stable isotope labeling with amino acids in cell culture; TNF-␣, tumor necrosis factor-␣; XML, extensible markup language; 1D, one-dimensional; cps, counts/s; H, heavy; L, light; ALCAM, activated leukocyte cell adhesion molecule; ICAM, intercellular cell adhesion molecule; VCAM-1, vascular cell adhesion molecule-1; PECAM-1, platelet/endothelial cell adhesion molecule-1; iTRAQ, isobaric tags for relative and absolute quantification; HLA, human leukocyte antigen; STEM, strategic extractor for Mascot’s results.
labeling of proteins or peptides combined with nano-LC-MS/MS analyses (6, 7). In these approaches, light and heavy isotopic labels are introduced into the proteins from the dif-ferent samples to be compared. The samples are then mixed together, and a single nano-LC-MS/MS analysis is run. The relative abundance of a given protein can then be deduced from the ion signal intensity ratio calculated for light/heavy peptide pairs from this protein. This leads to a more accurate relative quantification of the proteins from the samples to be compared because the samples are analyzed simultaneously in a single nano-LC-MS/MS run. In the ICAT method, proteins are chemically labeled on cysteines with a biotinylated heavy or light reagent (8, 9), whereas in the SILAC (stable isotope labeling with amino acids in cell culture) method, the label is introduced during protein synthesis by growing cells in a medium containing a heavy or light amino acid (10). In these strategies, systematic identification of as many proteins as possible is usually performed by nano-LC-MS/MS analysis with shotgun approaches involving prefractionation of the proteins or the peptides, and correctly assigned proteins can be quantified afterward on the basis of the MS signal of the corresponding peptides. This in turn leads to the production of a huge amount of MS/MS and MS spectra that must be handled for identification and quantification, thus necessitat-ing appropriate bioinformatics tools.
Data analysis and validation of the results from MS/MS searches have become major issues of mass spectrometry-based proteomics, and a lot of efforts are made to provide efficient tools for evaluating and organizing data. Although Mascot (11) and Sequest (12) remain the two reference soft-wares that are widely used for protein identification from MS/MS data, the protein matching lists that they return still contain false positives and skip some false negatives. To improve the reliability of results, new search engines and scoring techniques were recently developed. These include the S-score (13), the softwares PeptideProphet and Protein-Prophet (14 –16), and the new Phenyx search engine based on the OLAV algorithm (17). Other tools and methods aiming at facilitating the validation and handling of Mascot results in-clude MSQuant (18) and STEM (19). Here we describe a new program named Mascot File Parsing and Quantification (MF-PaQ) that allows fast and user-friendly verification of Mascot result files as well as data quantification from an experiment performed by isotopic labeling using either ICAT or SILAC methods.
This software provides an interactive interface with Mascot results. It is based on three modules, the Mascot File Parser module, the quantification module, and a third module de-signed for differential analysis in which validated protein lists are compared.
The potentialities of the MFPaQ software are illustrated by the analysis of the results from a nano-LC-MS/MS proteomics study of membrane proteins from primary human endothelial cells (ECs). ECs, which form a monolayer lining all blood
vessels, play a key role in diverse physiological and patho-logical processes, including chronic inflammatory diseases such as rheumatoid arthritis, in which they are involved in the regulation of leukocyte extravasation, angiogenesis, cytokine production, protease and extracellular matrix synthesis, anti-gen presentation, vasodilatation, and blood vessel permeabil-ity (20, 21). In this study, we tried to better characterize the membrane proteome of human ECs and to set up methods for quantitative analysis of this proteome by ICAT labeling. Mi-crosomes from ECs were fractionated by 1D SDS-PAGE, resulting gel slices were analyzed by nano-LC-MS/MS, and database searches were performed using Mascot. Data vali-dation and clustering of proteins were performed with MF-PaQ, which allowed the identification of more than 600 unique proteins. The software was then successfully used to perform quantification of proteins from a 1:1 heavy/light c-ICAT label-ing test experiment. Finally we stimulated human ECs with a combination of key proinflammatory cytokines, TNF-␣, IFN␥, and lymphotoxin␣/, and performed a differential proteomics analysis using the ICAT method. The validated results ob-tained using MFPaQ software allowed the identification of 44 EC membrane proteins regulated by inflammation.
MATERIALS AND METHODS
MFPaQ Details and System Requirements—MFPaQ is a Web-based application that runs on a server on which Mascot Server 2.1 and Perl 5.8 must be installed as well. It functions with an Internet Information Services Web Server under Windows XP Pro edition and Windows 2003 Server. Scripts are written in Perl language and use the modules XML-Simple, Spreadsheet-WriteExcel, and GD. The user interface is accessible via a Web browser: Microsoft Internet Explorer and Mozilla Firefox are currently compatible with the application. Proteomics data (protein and peptide identifications, validated protein lists, and quantification results) are stored in the XML file format. To perform quantification, an external module called “Extract Daemon” has been developed for extracting intensity values from raw data. This module was developed in Visual Basic.Net and works at the moment with “.wiff” files acquired on a QStar XL or QStarElite instrument (Applied Biosystems, Foster City, CA). It must be installed on the same server as MFPaQ on which Analyst QS 1.1 or Analyst QS 2.0 should be installed as well. Two versions of the application, compat-ible with these corresponding versions of Analyst QS, are freely available at mfpaq.sourceforge.net. Although Mascot 2.1 and Analyst QS are necessary to process and quantify new data with MFPaQ, the application can be installed alone and is able to display all detailed protein lists and peptide information presented in the results section. MS/MS spectra for all assigned peptide sequences can be viewed if Mascot has been installed on the same computer.
EC Culture and Cytokine Stimulation—Primary human umbilical vein endothelial cells (HUVECs) were isolated from fresh human um-bilical cords and further purified with CD105 microbeads (Miltenyi Biotec, Auburn, CA) as described previously (22). HUVECs were grown in endothelial cell growth medium (Promocell, Heidelberg, Germany) and used after four passages for proteomics analyses. Cytokine treatment was performed by incubating the ECs for 12 h in Opti-MEM (Invitrogen) with a combination of TNF-␣ (25 ng/ml, R&D Systems), IFN␥ (50 ng/ml, R&D Systems), and lymphotoxin ␣/ (200 ng/ml, R&D Systems).
Purification of Microsomes—Cells were washed with PBS and collected with a cell scraper in 0.25Msucrose, 10 mMHepes, 2 mM
MgCl2, pH 7.6, supplemented with protease inhibitors (Complete,
Roche Applied Science). Cell lysis was performed with an Ultraturax homogenizer, and the resulting homogenate was centrifuged for 10 min at 800 ⫻ g to remove nuclei and cell debris. The postnuclear supernatant was centrifuged for 10 min at 10,000⫻ g, resulting in a pellet enriched in mitochondria that was not analyzed. The superna-tant was centrifuged at 200,000⫻ g for 45 min, and the microsomal pellet was washed by resuspension in 100 mMNa2CO3, pH 12, to
remove soluble contaminants and centrifuged again at 200,000⫻ g for 45 min. The washed pellet was solubilized in 50 mMTris, 6Murea,
0.5% SDS, pH 8.3. Protein concentration was determined with the reductant compatible-detergent compatible assay (Bio-Rad).
c-ICAT Labeling—Microsomal proteins (96g) in 50 mMTris, 6M
urea, 0.5% SDS, pH 8.3, were reduced with tris(2-carboxyethyl)phos-phine HCl (0.1 mmol) for 2 h at room temperature and labeled with one unit of heavy or light c-ICAT (Applied Biosystems) for 3 h at room temperature in the dark. The reaction was stopped by adding Lae-mmli buffer to the samples, resulting in a 25 mMDTT final concen-tration. Samples labeled with the heavy or light reagent were then mixed and loaded on a 1D SDS-PAGE gel to fractionate the protein mixture and eliminate excess ICAT reagent.
Analysis by 1D Gel/Nano-LC-MS/MS—Microsomal proteins were fractionated on a 1D SDS-PAGE gel (1.5 mm⫻ 8 cm), the gel was briefly stained with Coomassie Blue, and the entire migration lane was cut into 20 homogeneous gel slices. Gel slices were washed and digested with modified sequencing grade trypsin (Promega, Madison, WI), and resulting peptides were extracted. For unlabeled proteins, extracted peptides were directly analyzed by nano-LC-MS/MS. For the ICAT labeling experiment, labeled peptides were purified by af-finity chromatography on a monomeric avidin cartridge according to the manufacturer’s protocol (Applied Biosystems, Framingham, MA). Peptides were eluted from the cartridge with 30% ACN, 0.4% TFA in H2O and dried down in a SpeedVac, and the cleavable biotin moiety
of the labeling reagent was then submitted to acid hydrolysis accord-ing to the manufacturer’s protocol. Resultaccord-ing peptides were analyzed by nano-LC-MS/MS using an LC Packings system (Dionex, Amster-dam, The Netherlands) coupled to a QStar XL mass spectrometer (Applied Biosystems). Dried peptides were reconstituted in 12l of solvent A⬘ (5% ACN, 0.05% TFA in HPLC-grade water), and 6l were loaded onto a precolumn (300-m inner diameter ⫻ 5 mm) using the Switchos unit of the LC Packings system, delivering a flow rate of 20 l/min solvent A⬘. After desalting for 7 min, the precolumn was switched on line with the analytical column (75-m inner diameter ⫻ 15-cm PepMap C18) equilibrated in 95% solvent A (5% ACN, 0.1%
formic acid in HPLC-grade water) and 5% solvent B (95% ACN, 0.1% formic acid in HPLC-grade water). Peptides were eluted from the precolumn to the analytical column and then to the mass spectrom-eter with a gradient from 5 to 50% solvent B (during either 60 or 80 min) at a flow rate of 200 nl/min delivered by the Ultimate pump. The QStar XL was operated in information-dependant acquisition mode with the Analyst QS 1.1 software. MS and MS/MS data were recorded continuously with a 5-s cycle time. Within each cycle, MS data were accumulated for 1 s over the mass range m/z 300 –2000 followed by two MS/MS acquisitions of 2 s each on the two most abundant ions over the mass range m/z 80 –2000. Dynamic exclusion was used within 60 s to prevent repetitive selection of the same ions. Collision energies were automatically adjusted according to the charge state and mass value of the precursor ions. The MS to MS/MS switch threshold was set to 10 cps.
Database Searching—The Mascot Daemon software (version 2.1.6) was used to automatically extract peak lists from Analyst QS .wiff files and to perform database searches in batch mode with all the .wiff files acquired on each gel slice. For creation of the peak lists, the default charge state was set to 2⫹, 3⫹, and 4⫹. MS and MS/MS centroid
parameters were set to 50% height percentage and a merge distance of 0.1 amu. All peaks in MS/MS spectra were conserved (threshold intensity set to 0% of highest peak). For MS/MS grouping, the fol-lowing averaging parameters were selected: spectra with fewer than five peaks or precursor ions with less than 5 cps or more than 10,000 cps were rejected, the precursor mass tolerance for grouping was set to 0.1 Da, the maximum number of cycles per group was set to 10, and the minimum number of cycles per group was set to 1. MS/MS data were searched against all entries in the public database UniProt version 8.1, which consists of Swiss-Prot Protein Knowledgebase Release 50.1 and TrEMBL Protein Database Release 33.1 (3,192,898 entries in total), using the Mascot search engine (Mascot Daemon, version 2.1.6; Matrix Science, London, UK). To evaluate the false positive rate in these large scale experiments, we repeated the searches using identical search parameters and validation criteria against a random database. The database was the compilation of UniProt Swiss-Prot and UniProt TrEMBL databases (same versions described above) in which the sequences have been reversed. Oxi-dation of methionine was set as a variable modification for all Mascot searches, and for ICAT labeling experiments, alkylation of cysteine with light12C c-ICAT and with heavy13C c-ICAT also was set as a
variable modification. Specificity of trypsin digestion was set for cleavage after Lys or Arg, and two missed trypsin cleavage sites were allowed. The peptide MS and MS/MS tolerances were set to 0.15 and 0.25 Da, respectively.
RESULTS MFPaQ Features
MFPaQ is a software tool that facilitates organization, min-ing, and validation of Mascot results and offers different func-tionalities to work on validated protein lists. A schematic overview of the program is given in Fig. 1. The software is organized around a core module, the Mascot File Parser (“MFP”) module that extracts data from Mascot result files (.dat) and allows the user to browse, validate, and cluster the results. The MFP module stores protein and peptide lists in .xml files that can be used by the “differential analysis” mod-ule to compare the lists of proteins from two or more exper-iments and by the “quantification” module to compute the ratios of the proteins in an isotopic labeling experiment (ICAT or SILAC). The software is a Web-based application that runs on a server (where Mascot Server is installed and the .dat result files are generated). It can be accessed by different users via a Web browser. Each user can create his own profile by defining several criteria that will be used by the MFP module to validate the proteins extracted from Mascot files. User profiles and criteria can be modified and saved at any time to perform another extraction using different criteria. Each user works under a personal session in which he can create and store experiments.
The MFP Module for Validation and Classification Description of the MFP Module
A first module, the Mascot File Parser, performs validation and classification of the proteins from a result data file ac-cording to Mascot scoring or acac-cording to user-defined cri-teria based on the number, score, and rank of identified
peptides. This module offers to the user a convenient inter-face to manually validate or reject ambiguous identifications. It can also group identical or highly homologous proteins from several result data files to eliminate redundancy and to pro-vide a global and relevant list of the proteins present in the sample. The use of the MFP module consists in three main steps detailed below corresponding to the extraction of Mas-cot files in batch mode, protein validation, and generation of protein lists.
Extraction of Mascot Files in Batch Mode—The MFP
mod-ule offers the possibility to create an “experiment” corre-sponding to the extraction of one or several Mascot result files (.dat files). Depending on how the shotgun analysis of a pro-tein sample is conducted, it may be relevant to perform either a single Mascot search or several searches for this sample. For example, if a whole complex protein mixture is enzymat-ically digested and the resulting peptides are fractionated using chromatography (e.g. on a strong cation exchange col-umn), each peptide fraction will then be analyzed by nano-LC-MS/MS, and different peptides belonging to the same protein will be analyzed in several of these nano-LC-MS/MS runs. In this case, making a unique peak list from all the MS/MS scans acquired in all the runs will be necessary to identify efficiently the proteins in a single Mascot database search. Conversely if the protein mixture is fractionated first
(e.g. in a series of 1D gel slices) and each protein fraction is digested, then peptides from each fraction will be analyzed by nano-LC-MS/MS, and all the peptides from a protein will be analyzed in the same run. In that case, several Mascot data-base searches should be performed with the different peak lists obtained from the nano-LC-MS/MS runs, and the differ-ent protein lists obtained should be gathered afterward to avoid erroneous assignments of MS/MS spectra acquired in one fraction to a protein present in another fraction. In this way, no information is lost in the identification process, and the physicochemical properties of the proteins that were used to perform fractionation in the first step (e.g. molecular weight in the case of 1D SDS-PAGE separation) may represent an additional parameter of interest for the validation of protein identification. For example, in the case of an ambiguous iden-tification by Mascot, a strong discrepancy between the theo-retical molecular weight of the predicted protein and the ex-perimental molecular weight corresponding to the gel slice on which the analysis was performed can be used as a criterion by the user to reject the identification. In both cases, MFPaQ provides a clear interface for visualizing, mining, and organiz-ing the results of a multisearch experiment. The software extracts in batch mode the data contained in a series of Mascot .dat files specified by the user under an experiment and displays a table with links to a validation window for each of these searches as illustrated in Fig. 2A.
Validation of Proteins—The MFP module extracts protein
entries from Mascot files and can rank them according to either the Mascot “Standard scoring” or “MudPIT scoring.” To facilitate manual validation, the software applies to the pro-teins of the list a two-color code related to filtering rules defined by the user under its configuration profile. Proteins that passed the “validation criteria” are displayed in green. They can be considered as confident hits that do not need further verification and will automatically be checked in the validation window. Proteins that meet the “exclusion criteria” are discarded and are not displayed in the list. All other proteins, which are considered as ambiguous identifications, appear in red and can be manually verified by the user. The filtering rules used for the classification of a protein in green and red are based either on the protein score defined in Mascot or on multiple criteria related to the peptide matches (sequence interpretation of an MS/MS spectrum) assigned to this protein. In the first case, the software basically displays in green color the “significant hits” list given in the Mascot Peptide summary report. Mascot uses the probability-based Mowse algorithm to calculate ion scores, defined as⫺10 ⫻ log(p) where p is the probability that the observed match for this ion is a random event. Protein scores are derived from ion scores as a non-probabilistic basis for ranking protein hits and are computed differently in Standard scoring and MudPIT scoring. The significant hits list given by Mascot contains the proteins with total scores higher than the significance thresh-old, which depends on the database size and is calculated by FIG. 1. General scheme of MFPaQ. The MFP module extracts data
from Mascot result files (.dat files) and generates lists of protein groups and associated lists of peptide matches stored in the VALID.xml files. Several of these files can be gathered to create a non-redundant list of protein groups (CLUSTER.xml file), and concat-enated lists from different experiments can be compared in the dif-ferential analysis module. The quantification module uses peptide data contained in the VALID.xml files (ion m/z and peptide retention time) to extract the intensity value for each peptide pair (ICAT or SILAC labeling) in the survey scan of the corresponding raw file, calculates the ratios of the peptides and of the proteins for each nano-LC-MS/MS run (QUANTI.xml files), and generates a global quantification report (QUANTI_REPORT.xml) by gathering the protein identifications and averaging quantification data from multiple nano-LC-MS/MS runs.
default with the probability for a match to occur at random with a probability of less than 5% (p⬍ 0.05). However, some false positives are clearly present in this list, and some false negatives are missing. Although Mascot still appears to be at the moment one of the most efficient search engines, this lack of specificity has prompted a lot of efforts from several groups to set up more reliable scoring systems. Although promising, these systems will need further validation and are not yet of general use. Therefore, manual validation is still often per-formed by many users at least for borderline proteins around the Mascot threshold. The MFP module is very helpful for this process because it can classify the proteins according to more or less stringent criteria based on the number, the rank,
and the score of the peptide matches assigned to a protein. The protein displayed in MFPaQ will still be ranked according to Mascot scoring, but proteins possessing for example at least two bold and red peptide matches in Mascot, with scores higher than 40, will appear in green and will be auto-matically validated. Proteins that do not fulfill these criteria, although being in the significant list of Mascot, will appear in red and will have to be verified manually. To that aim, all the information given by Mascot for a protein hit is also available in the MFP window: protein mass, pI, total score, list of assigned queries with the corresponding peptide sequence, theoretical and experimental masses of the peptide matches, delta value between these two masses, score and rank of the FIG. 2. Visualization and parsing of Mascot results in the MFP module. A, an experiment is created in MFP from a series of Mascot .dat files, corresponding for example to several nano-LC-MS/MS runs performed on consecutive gel slices of a 1D gel. Extracted Mascot results are automatically validated according to user-defined criteria. However, the user keeps a trace of the fraction (.dat) manual validation process: before being verified, modified, and saved, they appear in red, and afterward they are displayed in green. B, protein validation is also color-coded: green proteins fulfill user-defined criteria, whereas ambiguous identifications are displayed in red. The proteins are ranked according to Mascot scoring. In the expanded view of the window, peptide information is available, and links to MS/MS spectra allow verification of the peptide sequence assignment.
peptide matches, and E-value for the assignment. Links to the Mascot “Peptide view” window containing MS/MS centroided spectra are available as well and allow rapid verification by the user of ambiguous proteins displayed in red (Fig. 2B). It has to be noted that in MS/MS strategies identical peptides can often be mapped to different protein sequences present in a database, corresponding either to redundant sequences, amino acid variants, splice isoforms, different protein frag-ments, or protein homologs. The Mascot software automati-cally groups together protein sequences matching exactly the same set of peptides. Under the MFP module, it is possible to display a concise list of the proteins identified where only one member of each group appears but also a detailed list con-taining all the members of each group of proteins sharing the same set of peptides. Moreover MFP is able to detect protein homologs or protein fragments related to another protein ranked higher in the list. These proteins are usually identified with a subset of shared peptides (displayed as red and non-bold peptides in Mascot) but are not grouped together with the previous hit because additional, specific peptide se-quences are also assigned to them. The MFP module displays these proteins in italic if these supplemental sequences are low scoring peptide matches (score lower than 30) that do not allow their identification as specific hits (in that case, these proteins or protein groups were not validated in the following results section). However, it displays them as real specific hits if they have at least one high scoring (score higher than 30) red and bold specific peptide match. These features, and the interactive validation window, enable the user to save a lot of time by browsing and easily validating the results.
Saving Protein Lists—Once the verification has been
per-formed, validated proteins (or protein groups), including all associated peptide information, are saved in XML files and can be exported into Excel. Another important feature of the MFP module is the possibility of generating exclusion lists for further nano-LC-MS/MS experiments. Such lists can be used to perform a second nano-LC-MS/MS run of the same sample in which intense ions that were already assigned to a validated protein in the first run will not be selected again for MS/MS, potentially giving the mass spectrometer more time to se-quence less abundant peptides. Finally the MFP module can also generate a unique, non-redundant list of proteins from all the validated result files of a multisearch experiment. This unique feature from MFPaQ is particularly useful when protein fractionation is performed because the same protein can be identified several times in adjacent gel slices. The software compares proteins or protein groups (composed of all the proteins matching the same set of peptides) and creates clusters from protein groups found in different gel slices if they have one common member. This feature allows the editing of a global list of unique proteins (or clusters) representing the entire sample analyzed in the experiment.
Application of the MFP Module to the Identification of Membrane Proteins from Primary Human ECs
EC microsomes were prepared, washed with sodium car-bonate at high pH to enrich the mixture in integral membrane or membrane-anchored proteins, fractionated by 1D SDS-PAGE, and analyzed by nano-LC-MS/MS. Analysis of highly hydrophobic proteins is often difficult because the classical buffers used in many protein separation techniques (two-dimensional electrophoresis and liquid chromatography) and the conditions compatible with enzymatic digestion are often not efficient enough to solubilize them, leading to protein aggregation and precipitation. 1D SDS-PAGE is a well suited approach for the separation of highly hydrophobic proteins because they can be efficiently solubilized in Laemmli buffer and fractionated. The enzymatic digestion step can then be easily performed in gel once the proteins have been fixed in the gel and the SDS has been washed out of the bands. Twenty gel slices were cut all along the migration lane, di-gested with trypsin, and analyzed by nano-LC-MS/MS with a 60-min-long gradient. Mascot results obtained for all of them were filtered out and validated with the MFP module of MF-PaQ. Table I presents the number of proteins or protein groups identified in each gel slice when using different criteria for protein validation: either Mascot scoring (Standard or MudPIT) or criteria based on the number, the rank, and the score of the peptide matches. Validation based on the Mascot Standard scoring and a protein score higher than 34 (p ⬍ 0.05) resulted in a final non-redundant list of 1477 protein groups (data not shown), whereas validation based on Mascot MudPIT scoring, with the same threshold, gave a final non-redundant list of 855 protein groups (Table I, column 1). Performing a random database search and applying the later criterion for validation (Mascot MudPIT score higher than 34) led to the identification of 101 protein groups, indicating a false positive rate on the previous list of about 11%. Using the same procedure with the Standard scoring we obtained a false positive rate of 16%. When the stringency of filtering was increased by validating only proteins with at least two reliable peptide matches (rank 1 and individual score higher than 34), the number of validated proteins went down to 491. A random database search with the same criteria led to the validation of only two proteins, indicating a false positive rate of 0.4% (Table I, column 2). Thus, although this list appeared to be much more reliable according to the estimated false positive rate, it was also much more restrictive and potentially omitted a large number of false negatives. Among them, many pro-teins were identified on the basis of only one peptide match, and we thus tested several criteria of validation to rescue some of these proteins while maintaining an acceptable level of false positive rate. In addition to the proteins identified with more than two peptide matches with individual score higher than 34, we allowed automatic validation of proteins identified with a single peptide match. When the minimal score of these
single peptide hits was set to 41 (p ⬍ 0.01), the list of vali-dated protein groups significantly increased to 706, but the false positive rate went up to 4% (Table I, column 3). Finally intermediate criteria were selected by setting the minimal score for these single peptide match hits to 50, which gave a final non-redundant list of 626 protein groups and a false positive rate of 0.6% (Table I, column 4). We chose to use this criteria for automatic validation with MFP (green proteins; see Fig. 2). A manual check was additionally performed on am-biguous proteins that did not fulfill these criteria (displayed in red in the MFP window) and that potentially still contained false negatives. Manual verification of the MS/MS spectra allowed the rescue of 107 positive hits (Table I, column 4) when the fragmentation data were of high quality and strongly indicative of the peptide sequence (at least four consecutive y ions and a delta mass between measured and theoretical peptide molecular mass lower than 0.1 Da). The list of 626
proteins automatically validated by MFP with the above men-tioned criteria is provided in Supplemental Data 1. For more clarity, only one member of each protein group (proteins matching the same set of peptides) is displayed. The lists of protein groups identified in each gel slice fraction with all peptide information associated are also provided (Supple-mental Data 2) as well as annotated MS/MS spectra in the case of single peptide-based matches (Supplemental Data 9). The complete database search results with detailed protein groups and peptide assignments can be viewed and browsed over by downloading the MFPaQ software and associated data files at mfpaq.sourceforge.net. Automatic classification of the protein list according to Gene Ontology annotations was then performed with the GoMiner software (discover.n-ci.nih.gov/gominer/) and indicated that, of 450 proteins anno-tated in terms of subcellular localization, 254 proteins are membrane proteins, and 90 proteins appear to be localized at TABLEI
Number of automatically validated protein groups identified in each gel slice and in the final non-redundant list after proteomics analysis of EC microsomes
Database searches were performed using Mascot for each nano-LC-MS/MS run, and result files were parsed with different criteria for protein validation selected under the MFP module. For each gel slice fraction, the number of protein groups (proteins matching the same set of peptides) is shown. The number indicated for the non-redundant final protein lists refers to a number of unique protein groups obtained after clustering by the software of the different lists of protein groups in the consecutive fractions. Random database searches were performed for the same nano-LC-MS/MS runs using similar parameters and parsed using the same criteria to evaluate the rate of false positive hits after automatic validation.
1D gel slices
1. Mascot validation (total protein MudPIT
score⬎34)
2. Two peptides with individual scores⬎34
3. Two peptides with individual scores⬎34 or one peptide with individual score higher
than 41
4. Two peptides with individual scores⬎34 or one peptide with individual score higher than 50
Search Swiss-Prot-TrEMBL Search reverse database Search Swiss-Prot-TrEMBL Search reverse database Search Swiss-Prot-TrEMBL Search reverse database Search Swiss-Prot-TrEMBL Search reverse database Search Swiss-Prot-TrEMBL⫹ manual validation E1 48 2 27 0 39 0 35 0 42 E2 58 8 32 0 44 2 37 0 44 E3 63 7 30 0 53 4 43 1 50 E4 69 0 38 0 59 0 49 0 61 E5 60 3 34 0 50 2 50 1 55 E6 62 5 33 0 50 0 41 0 56 E7 75 6 37 0 60 1 54 0 59 E8 83 7 37 1 62 3 55 1 63 E9 97 4 50 0 70 1 63 0 69 E10 73 5 34 0 57 1 50 1 61 E11 57 3 29 0 49 1 38 0 54 E12 57 5 28 0 51 1 45 0 56 E13 64 8 34 0 49 2 46 0 56 E14 81 9 41 1 74 3 69 1 75 E15 72 6 44 0 60 3 57 0 63 E16 72 2 38 0 60 0 50 0 61 E17 72 4 36 0 64 1 57 0 67 E18 60 9 34 0 52 0 46 0 56 E19 61 11 27 0 51 2 43 0 57 E20 65 5 27 0 54 4 44 0 58 Total number of validated proteins (non-redundant list) 855 101 491 2 706 29 626 4 733 False positive percentage (%) 11.80 0.40 4.10 0.63
the plasma membrane (Fig. 3). The list of proteins identified comprises at least 41 known EC surface markers (Supple-mental Data 1) including classical endothelial markers CD31 (PECAM-1), VE-cadherin (Cadherin-5), CD105 (Endoglin), CD146 (MUC18/melanoma cell adhesion molecule), podoca-lyxin, tyrosine kinase receptor Tie-2, intercellular cell adhesion molecule (ICAM)-2, endothelial cell-selective adhesion mole-cule, aminopeptidase N (CD13), angiotensin-converting en-zyme (CD143), dipeptidyl-peptidase IV (CD26), and endothe-lin-converting enzyme.
The MFPaQ Quantification Module for the Relative Quantification of Isotopically Labeled Proteins Description of the MFPaQ Quantification Module
An important feature of MFPaQ is a quantification module, which extracts quantitative data from raw files obtained by nano-LC-MS/MS when using either ICAT or SILAC labeling techniques. The software allows the verification of the calcu-lated ratios and the manual deselection of some peptide pairs or some MS scans in case of aberrant ratio calculation (co-elution with other peptides, weak signal, etc.). After validation of the proteins identified, the quantification module uses the peptide lists generated by the MFP module to select the peptides containing an isotopic modification specified by the user (e.g. a cysteine modified by a c-ICAT reagent or a pep-tide containing an arginine in the case of a SILAC labeling with heavy arginine). To this aim, each validated result file must be associated with the corresponding raw data file (.wiff files). Intensities of peptide pairs are then extracted from the MS Survey scans of a series of raw data files in batch mode, and heavy/light ratios are computed for each peptide pair. The ratios of all validated peptide matches are averaged for each protein in a gel slice, and a coefficient of variation is calculated for the ratio of the proteins that have been quantified with several peptide matches (Fig. 4A). When a protein is identified and quantified several times in consecutive gel slices, a final protein ratio is computed by averaging the different ratios
found for this protein in the different fractions, and a global coefficient of variation is calculated. Proteins or protein groups identified and quantified in different fractions are also clustered to generate a final non-redundant list of protein groups, with their normalized protein ratio and the associated global coefficient of variation, presented in the “Quantification report.” To check and validate the quantification results, di-rect links are provided for each protein ratio to a “Quanti Viewer” window showing all data used for quantification of an individual protein. These include the list of isotopically labeled peptide pairs identified for this protein with peptide score, mass, and elution time; the list of MS scans used to extract peptide intensities; and the corresponding MS spectra of the peptide pairs (Fig. 4B). The program automatically selects the MS scans of good quality to reconstitute the elution peaks for each member of the peptide pair. Then it computes the elution profile intensities and the corresponding ratio. Another feature of MFPaQ is to manually deselect some MS scans or directly deselect some peptide pairs in the case of aberrant ratio calculation (co-elution with another peptide, weak signal, etc.). The ratios are then automatically recalculated and up-dated in the quantification report.
Validation of the MFPaQ Quantification Module Using a 1:1 Heavy/Light c-ICAT Ratio of Labeled Proteins Extracted from EC Microsomes
To test the efficiency of ICAT labeling of EC microsomal proteins as well as the efficiency of quantification by the MFPaQ software, we performed a 1:1 heavy/light test labeling experiment using 100 g of microsomes. Equal amounts of material were labeled with either light or heavy c-ICAT and mixed together. Proteins were solubilized in 6 M urea and 0.5% SDS to improve protein denaturation and labeling effi-ciency (23) and were then fractionated by 1D SDS-PAGE. Twenty gel slices were cut all along the migration lane and digested with trypsin. For each fraction, c-ICAT labeled pep-tides were enriched by monomeric avidin chromatography, the biotin moiety of the tag was then submitted to acidic cleavage, and the resulting peptides were analyzed by nano-LC-MS/MS with a 60-min-long gradient. Proteins identified by Mascot in each fraction were extracted and validated with the MFP module of MFPaQ using the optimized criteria described above (i.e. at least two peptide matches of rank 1 with score higher than 34 or one peptide match of rank 1 of score higher than 50). The MFPaQ software allowed the validation of 164 unique protein groups (Supplemental Data 3) from which 155 were assigned at least one ICAT labeled peptide match of score higher than 20 (threshold applied on validated peptide matches for MS data intensity extraction). Peptide information associated with each protein group in the different gel slice fractions are shown in Supplemental Data 4, and annotated MS/MS spectra are provided in the case of single peptide-based matches (Supplemental Data 9). Quantification was then performed on the validated protein groups using the FIG. 3. Classification of the proteins identified in EC
micro-somes according to their subcellular localization. Automatic
clas-sification into different categories was performed using the GoMiner software (discover.nci.nih.gov/gominer/) according to the Gene On-tology (GO) annotations available for each protein.
MFPaQ quantification module. After calculation of an average ratio for each protein group identified, the software applies to all of them a normalization factor defined as the median ratio of the protein population. This compensates for a possible bias introduced during labeling if slightly different total protein amounts of the two samples to be compared are taken. In the test experiment, the software calculated a normalization fac-tor of 0.98. This value was expected because the test exper-iment compared two aliquots of the same sample. Similarly it is also expected that all the normalized ratios for the identified proteins are very close to 1 because no differential expression of proteins occurs. The histogram in Fig. 5A presents the normalized ratios computed by the software for all quantified proteins (either heavy/light or light/heavy ratios are
repre-sented to always obtain a final value⬎1). Of the 155 proteins possessing at least one ICAT labeled peptide match, 152 were successfully quantified (Supplemental Data 5). The cal-culated H/L and L/H ratios for this population vary between 1 and 1.22, which is in good agreement with the classical ⬃20% accuracy attributed to the c-ICAT labeling method associated with mass spectrometry analysis (8, 24, 25). Standard deviation from the median value of 1 is only 6%. Thus, the results of this test experiment indicate that the ICAT labeling method associated with the analytical mass spec-trometry procedure described, database search result filtering using stringent criteria, and quantification with the MFPaQ software may be able to measure changes in ratios in a statistically significant way.
FIG. 4. Visualization of the peptide
and protein ratios from the 1:1 ICAT labeling test experiment using EC mi-crosomes in the quantification mod-ule. A, for each validated protein list
cor-responding to one protein fraction (i.e. gel slice), protein ratios are calculated and displayed in an individual window along with the protein scores, numbers of peptides quantified per protein, and coefficient of variation (CV) of the protein ratios for this gel slice. NQP is the num-ber of quantified peptide pairs. The Ratio column refers to the H/L ratios. B, de-tailed results for quantification of a par-ticular protein in one gel slice can be inspected in a separate window showing m/z, scores, elution times of the ions used for quantification, and the different MS scans used for quantification for each peptide pair can be inspected. Peptide pairs and MS scans can be manually selected or deselected for a new calculation of the ratio. Min., mini-mum; Max., maximini-mum; Exp., experimen-tal; Int., intensity; Temps, time.
Quantitative Study of EC Membrane Proteins Regulated by Inflammatory Cytokines
ECs in secondary lymphoid organs and chronically inflamed tissues are found in a microenvironment rich in proinflamma-tory cytokines (21, 26). Therefore, in an effort to mimic the inflammatory microenvironment found in vivo, cultured ECs were pretreated with a combination of potent proinflammatory cytokines before ICAT labeling of microsomal proteins. For this differential proteomics study, about 60g of microsomal proteins from untreated ECs were labeled with light c-ICAT reagent, and the same amount of microsomal proteins from ECs stimulated with TNF-␣, IFN␥, and lymphotoxin-␣/ were labeled with heavy c-ICAT reagent. The samples were mixed and fractionated by 1D SDS-PAGE into 17 gel slices, which
were digested with trypsin. After enrichment of c-ICAT pep-tides on a monomeric avidin cartridge and acidic cleavage of the tag, analysis of the peptides was performed by nano-LC-MS/MS with an 80-min-long gradient. The gradient time was increased to improve MS/MS coverage of the peptidic mixture and to maximize the number of proteins identified. Application of the MFPaQ software using the same database search parameters and protein extraction criteria as described above resulted in a final non-redundant list of 229 identified proteins. To maximize the number of quantified proteins in the exper-iment we then applied less stringent filtering criteria for auto-matic validation with the MFP module (at least one peptide match of rank 1 with ion score higher than 35, corresponding to p⬍ 0.05) and manually checked all ambiguous proteins by close inspection of MS/MS spectra. Criteria for the manual validation of proteins were the following: at least one c-ICAT labeled peptide of rank 1 with relevant MS/MS fragmentation pattern (at least four consecutive y ions) and a good correla-tion between the theoretical molecular weight of the protein hit and the corresponding molecular weight of the gel slice number. In that way, we obtained a final list of 475 validated unique protein groups (Supplemental Data 6). Peptide infor-mation and annotated MS/MS spectra in the case of single peptide-based matches are shown, respectively, in Supple-mental Data 7 and 9. From the 475 validated protein groups, 452 had at least one c-ICAT labeled peptide match of score higher than 20. Of them, the MFPaQ software could success-fully quantify 415 protein groups (Supplemental Data 8). The normalization factor applied to all protein ratios for this exper-iment was 0.911, reflecting a 10% error in protein concentra-tion measurement. In the final quantificaconcentra-tion report, 44 pro-teins are overexpressed under cytokine treatment with heavy/ light ratios between 1.6 and 24.6 (Fig. 5B, Table II, and Supplemental Data 8), and on the other hand, 39 proteins are underexpressed with ratios light/heavy between 1.6 and 2.2. The most induced proteins are ICAM-1 (ratio of 25), vascular cell adhesion molecule-1 (VCAM-1; ratio of 21), and E-selec-tin, which represent major EC proteins involved in inflamma-tion and TNF-␣ response. ICAM-1, which mediates firm ad-hesion of leukocytes to the vascular endothelium via interaction with lymphocyte function-associated antigen-1, is well known to be up-regulated on endothelium upon inflam-mation and has been shown to be important for transendo-thelial migration of lymphocytes (27, 28). VCAM-1, which is induced on ECs at sites of inflammation, is one of the most important cell adhesion molecules involved in recruitment of monocytes via interaction with monocyte integrin VLA-4 (29, 30). E-selectin mediates leukocyte rolling and is not constitu-tively expressed on ECs but is up-regulated upon inflamma-tory stimulation (31, 32). Another cell adhesion protein, the activated leukocyte cell adhesion molecule (ALCAM)/CD166, which localizes to EC junctions and plays a role in monocyte transendothelial migration (33), was also shown to be up-regulated although with a lower ratio (2-fold change). Many FIG. 5. Protein relative expression ratios of the final experiment
quantification reports. The left part of these histograms displays
proteins with heavy/light ratios⬎1, whereas the right part displays proteins with light/heavy ratios⬎1. A, quantification results from the ICAT labeling 1:1 test experiment using EC microsomes. B, quantifi-cation results from the differential proteomics study following treat-ment of ECs with proinflammatory cytokines and c-ICAT labeling.
TABLEII
Proteins overexpressed in EC microsomes in response to treatment with proinflammatory cytokines Kin of IRRE-like protein, kin of irregular chiasm-like protein 1 precursor.
UniProt accession
number
Protein name Protein
scorea Number of ICAT peptide pairsa Protein ratioa CV a Final average normalized protein ratiob Global CVb % %
P05362 Intercellular adhesion molecule-1 precursor (ICAM-1) (CD54) 169 3 (5) 21.2 5.4 24.6 13.4 P19320 Vascular cell adhesion protein-1 precursor (VCAM-1) (CD106) 132 6 (8) 29.5 31.2 21.4 39.8 P16581 E-selectin precursor (endothelial leukocyte adhesion molecule-1) 79 4 (5) 19.2 18.4 20.7 7.9 P20591 Interferon-induced GTP-binding protein Mx1 71 4 (4) 16.5 16.0 14.9 37.2
Q96PP9 Guanylate-binding protein 4 48 1 (1) 17.5 14.8 49.1
P29728 Enoyl-CoA hydratase, mitochondrial precursor 44 2 (2) 8.7 11.1 10.0
Q5D1D5 Guanylate-binding protein 1 59 2 (3) 8.0 14.8 9.2
P32455 Interferon-induced guanylate-binding protein 1 37 2 (3) 7.5 6.0 8.6
P30447 HLA class I histocompatibility antigen, A-23␣ chain precursor 172 5 (5) 7.8 10.8 8.3 26.4
Q2A689 MHCcclass I antigen 121 2 (5) 8.4 0.1 8.2 25.4
P23381 Tryptophanyl-tRNA synthetase (tryptophan-tRNA ligase) 68 4 (4) 7.4 15.9 8.0 8.1 P13747 HLA class I histocompatibility antigen,␣ chain E precursor 51 1 (1) 6.8 7.7
P02794 Ferritin heavy chain (ferroxidase, EC 1.16.3.1) (ferritin H subunit) 0d 1 (1) 5.1 5.8
O15162 Phospholipid scramblase 1 (PL scramblase 1) 31 1 (1) 4.7 5.4 P28838 2⬘-5⬘-Oligoadenylate synthetase 2 ((2–5⬘)oligo(A) synthetase 2) 51 3 (3) 3.5 13.7 3.9
P48735 Isocitrate dehydrogenase (NADP), mitochondrial precursor 54 1 (1) 2.9 3.3 0.2 Q86YK5 Tumor necrosis factor receptor superfamily member 5 (fragment) 29 2 (2) 2.8 4.8 3.2
P62745 Rho-related GTP-binding protein RhoB precursor (H6) 118 4 (4) 2.1 21.4 2.7 17.2 P02792 Ferritin light chain (ferritin L subunit) 36 1 (1) 2.3 2.6
P40261 Nicotinamide N-methyltransferase (EC 2.1.1.1) 0d 1 (1) 2.1 2.4
P01130 Low density lipoprotein receptor precursor (LDL receptor) 48 3 (3) 2.1 6.5 2.4
P10515 Pyruvate dehydrogenase complex E2 subunit 152 4 (4) 1.7 6.6 2.3 20.8 Q1HGM8 Activated leukocyte cell adhesion molecule variant 2 121 4 (4) 1.8 8.7 2.1
P13473 Lysosome-associated membrane glycoprotein 2 precursor 61 1 (1) 1.8 2.0
P07996 Thrombospondin-1 precursor 123 7 (8) 1.8 9.4 2.0
O00330 Pyruvate dehydrogenase protein X component 30 1 (1) 1.8 2.0 P61224 Ras-related protein Rap-1b precursor (GTP-binding protein smg
p21B)
40 1 (1) 1.8 2.0
Q06210 Glucosamine-fructose-6-phosphate aminotransferase 83 3 (3) 1.7 27.1 2.0
Q96J84 Kin of IRRE-like protein 1 precursor 52 1 (1) 1.7 2.0
P30084 HLA class I histocompatibility antigen, A-1␣ chain precursor 40 1 (1) 1.6 1.9 P52597 Heterogeneous nuclear ribonucleoprotein F (hnRNP F) 21 1 (1) 1.6 1.9
Q38L19 Heat shock protein 60 169 2 (3) 1.8 1.5 1.8 14.5
P31689 DnaJ homolog subfamily A member 1 (heat shock 40-kDa protein 4)
26 1 (1) 1.6 1.8
P51149 Ras-related protein Rab-7 71 1 (1) 1.6 1.8 2.6
Q8IUW5 Similar to expressed sequence AA536743 43 1 (1) 1.6 1.8
Q14258 Tripartite motif protein 25 (zinc finger protein 147) 151 2 (2) 1.5 6.8 1.8 5.1
Q5T653 39 S ribosomal protein L2 0d 1 (1) 1.5 1.8
Q9ULA0 Aspartyl aminopeptidase (EC 3.4.11.21) 48 1 (1) 1.5 1.7
P09543 2⬘,3⬘-Cyclic-nucleotide 3⬘-phosphodiesterase 32 2 (3) 1.5 12.8 1.7 P13489 Ribonuclease inhibitor (ribonuclease/angiogenin inhibitor 1) 58 4 (4) 1.5 7.2 1.7 P62820 Ras-related protein Rab-1A (YPT1-related protein) 37 1 (1) 1.5 1.7 Q7Z457 Poliovirus receptor-related 2 (fragment) 142 1 (1) 1.5 1.7
Q14764 Major vault protein (MVP) (lung resistance-related protein) 183 5 (5) 1.5 8.6 1.7 1.3
Q6FHV5 RAB8A protein 0d 1 (1) 1.4 1.6
aData related to the protein in the 1D gel slice where it was identified with the best Mascot protein score (major gel slices): Mascot MudPIT
protein score, number of ICAT peptides pairs used by the software to quantify the protein in this particular gel slice (the number in parentheses corresponds to the total number of quantified ICAT peptide pairs), ratio computed by the software, and its associated coefficient of variation (CV) in percent (calculated if the number of ICAT peptides pairs used for quantification is higher than 1).
bFinal protein ratio computed for the protein in the whole experiment after averaging the different ratios found for the protein if it was
quantified in different consecutive gel slices and correcting by the normalization factor. A global coefficient of variation (CV; percentage) of this ratio is also calculated if the protein was quantified in different gel slices.
cMajor histocompatibility complex.
small GTPases (i.e. RhoB, Rap1b, Rab7, Rab28, and Rab1a) were also found to be induced by inflammatory cytokines in human primary ECs as well as large GTPases guanylate-binding proteins 1 and 4 and GTP-guanylate-binding protein Mx1, which have been shown previously to be up-regulated by IFN␥ (34, 35). Other known interferon-induced proteins identified (Table II) included HLA class I molecules, 2⬘-5⬘-oligoadenylate syn-thetase (36, 37), tryptophanyl-tRNA synsyn-thetase (38), and phospholipid scramblase 1 (39, 40). Finally expression of cell adhesion molecules CD31/PECAM-1 and ICAM-2 as well as many other cell surface proteins (Supplemental Data 8) re-mained unchanged after TNF-␣, IFN␥, and lymphotoxin ␣/ stimulation of primary human ECs.
Differential Induction of CD146 Isoforms in ECs Treated with Proinflammatory Cytokines
Very often a protein can be identified in several consecutive gel slices, particularly in the case of very abundant species, which will for example show significant tailing on a 1D gel lane. In this case, the ratios calculated for this protein in the different gel slices should be similar, and a low coefficient of variation on the final global protein ratio will indicate a good accuracy in quantification of the protein. However, different isoforms or fragments of a protein can also be identified in different gel slices, and although they will eventually belong to the same protein group as they will match the same set of peptides, the ratios calculated for each of them may actually differ. In that case, the final global ratio calculated for the protein group will be associated to a high coefficient of vari-ation value indicating a discrepancy between individual gel slice calculated ratios, but this may reflect biologically rele-vant information. An example of such a case is given in Fig. 6 for the MUC18/CD146 protein, an immunoglobulin superfam-ily adhesion molecule and component of EC junctions in-volved in cell-cell cohesion and angiogenesis (41– 43). In the 1:1 test labeling experiment, this protein is quantified with ratios close to 1 in each of the three gel slices where it was identified, leading to a final protein ratio of 1.02 with a low global coefficient of variation of about 3%. On the other hand, in the differential proteomics study following cytokine stimu-lation, the ratio calculated for this protein in gel slice 1 (high molecular weight fraction) is 1.76 (after correction with the normalization factor), whereas it is only 1.16 in gel slice 2 (low molecular weight fraction), leading to a final protein ratio of 1.46 with a high global coefficient of variation of about 29%. The coefficients of variation computed for the ratios in each of the two fractions are quite low, reflecting a good correlation between the values obtained for all the peptide pairs used for
calculation of these ratios. Thus, the discrepancy between the protein ratios obtained in the two fractions may reflect a real difference in regulation of two distinct protein isoforms follow-ing cytokine treatment rather than a bad quantification. It could be assumed for example that a highly glycosylated form of the MUC18/CD146 is specifically induced in response to inflammatory signals.
DISCUSSION
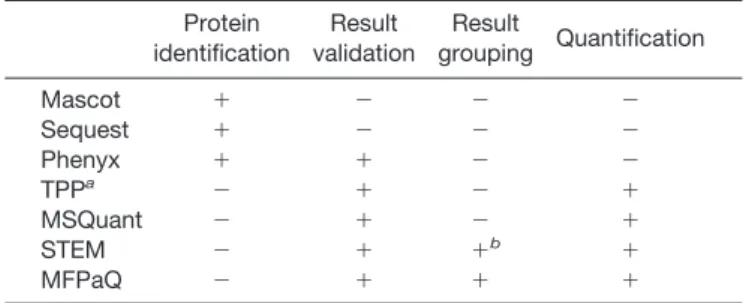
In this study, we developed a new software tool, designated MFPaQ, that proved to be efficient for data validation and quantification after ICAT labeling, protein fractionation, anal-ysis of consecutive fractions by several nano-LC-MS/MS runs, and multisearch with the Mascot engine. First this soft-ware greatly facilitated the sorting of protein lists and the verification of Mascot result files. Indeed although several search engines like Mascot, Sequest, or Phenyx are usually considered to be very efficient for protein identification, false protein assignments are clearly not avoided. In the case of the Mascot search engine, improvements were obtained in the 2.0 version with the introduction of the MudPIT scoring mode. Our study of the membrane proteome from ECs shows that application of this scoring yielded much fewer false positive hits than the Standard scoring. However, even with this new scoring, a validation step involving parsing of the results, either manually by the user or by application of automatic filters, still appears to be necessary. Convenient tools are not always available inside the identification softwares them-selves to perform this task (Table III). For example, a unique filtering option can be selected in Mascot 2.0 and Mascot 2.1 to retain in the final list of proteins only those that have at least one bold and red peptide match. The filtering rules available in MFPaQ are more comprehensive because the number, the
Fig. 6. Quantification of the MUC18/CD146 protein. A, 1:1 labeling test experiment. B, differential proteomics study following treatment of ECs with proinflammatory cytokines. Shown are individual quantification windows showing detailed results for the protein MUC18/CD146 in two different gel slices for each experiment: m/z, scores, and elution time of the ions used for quantification and the ratio calculated for each peptide pair. MS scans corresponding to ions at m/z 905.42 (peptide CLADGNPPPHFSISK, 2⫹) or at m/z 708.82 (peptide EPEEVATCVGR, 2⫹) are displayed. Min., minimum; Max., maximum; Exp., experimental; CV, coefficient of variation.
TABLEIII
Comparison of software features for bioinformatics analysis of proteomics data Protein identification Result validation Result grouping Quantification Mascot ⫹ ⫺ ⫺ ⫺ Sequest ⫹ ⫺ ⫺ ⫺ Phenyx ⫹ ⫹ ⫺ ⫺ TPPa ⫺ ⫹ ⫺ ⫹ MSQuant ⫺ ⫹ ⫺ ⫹ STEM ⫺ ⫹ ⫹b ⫹ MFPaQ ⫺ ⫹ ⫹ ⫹
aTrans Proteomic Pipeline with ProteinProphet and
Pep-tideProphet included.
rank, and the score of the peptide matches can be specified, and different filtering rules can be applied to validate the proteins. By performing a second Mascot search with the MS/MS data in a reversed database and by applying to the results the same filtering rules, the user can obtain a rough evaluation of the percentage of false positives associated to the automatic validation step. Thus, it is possible to adapt the stringency of the filtering rules to minimize the number of false positives while retaining a maximum of identified proteins.
Other bioinformatics tools can perform proteomics data validation (Table III), like the Trans Proteomic Pipeline, which is based on the softwares PeptideProphet and ProteinProphet (16). These two softwares are powerful validation tools that were initially designed to sort, filter, and analyze the results of the Sequest search engine. They first assign measures of confidence to peptide sequences returned by Sequest, via a statistical data modeling algorithm, and then to the proteins from which they were likely derived, thus estimating the ac-curacy of peptide and protein identifications made. They have been very efficiently applied in large scale shotgun proteom-ics studies based on peptide fractionation and MS/MS data analysis using Sequest (44), but they do not appear to be suited for validation of Mascot results. Other programs like MSQuant (18) and STEM (19) offer functionalities to validate Mascot data files (Table III). However, one particular advan-tage of MFPaQ is that it provides a synthetic view of the identifications that can be obtained when using a shotgun strategy based on protein fractionation. Indeed several Mas-cot result files can be automatically parsed in batch mode with the MFP module and grouped afterward to generate a global concatenated, non-redundant list of identified protein groups.
Finally an important feature of MFPaQ is the quantification module, which provides data on protein relative expression following isotopic labeling and identification with Mascot. Some recently released commercial softwares offer the pos-sibility to perform quantification for isotope labeling methods, like ProteinPilot from Applied Biosystems and ProteinScape from Bruker Daltonics. However, they are not always of ge-neric use and run under a specific environment. ProteinPilot, for example, offers new functionalities both for parsing and quantifying the data from .wiff files in ICAT, iTRAQ, and SILAC but is based mainly on the results of the Paragon search engine and not on Mascot results. ProteinScape, for its part, can process the MS/MS data with several search engines, among which is Mascot, but is only designed to perform quantification on Bruker Daltonics raw files. The very latest version of Mascot, Mascot 2.2, now seems able to perform quantification but only based on the data contained in the MS/MS peak lists (e.g. iTRAQ quantification or semiquantita-tive label-free strategies based on peptide match counting). To perform MS-based quantification (e.g. ICAT or SILAC strategies), the intensity values for the peptides should be extracted from the raw data by another commercial program,
Mascot Distiller. Although this application indeed seems promising to handle a wide range of mass spectrometer data file formats, the quantitation features are not yet implemented. It will be achieved using the Mascot Distiller Quantitation Toolbox, a program able to perform quantitation based on the relative intensities of extracted precursor ion chromatograms. The open source software MSQuant can do that and now works with a variety of MS data files formats but is specifically designed for SILAC analyses. MFPaQ has the advantage to process either SILAC or ICAT data. Moreover the MFP mod-ule and the quantification modmod-ule of MFPaQ are well suited to easily manage an experiment constituted of multiple Mascot search result data files, corresponding for example to several protein fractions. This is an important feature because protein fractionation is very often performed in differential proteomics studies based on isotopic labeling. Indeed such studies usu-ally proceed in two steps: first, as many proteins as possible are identified by MS/MS and database searching; and sec-ond, some of these proteins can be quantified if they were identified with a peptide bearing the isotopic modification by extracting the intensities of the peptide pair from raw MS data. This means that in such approaches only proteins that were identified first can potentially be quantified afterward. Thus, although very good quantification may be achieved on major protein components of a complex mixture, variation of expression of minor protein components may well be missed because these species will not be identified. This represents a major drawback, particularly if changes are expected to occur on low abundance species. It is thus critical in these strategies to extensively characterize the sample and to identify as many proteins as possible to track variations on a maximum number of species. A classical way for that is to perform a shotgun analysis of the sample, for example by protein fractionation, which currently seems to constitute the most efficient method to maximize the analytical coverage of a highly complex pro-tein mixture. Thus, it is important that bioinformatics tools for data quantification can process and integrate data obtained after protein fractionation. The MFPaQ software is particularly useful for that in contrast to other quantification programs (Table III). Indeed it can generate a global quantification report to integrate and synthesize all the data obtained for a protein in the different fractions in which it could be identified and quantified. Display of coefficients of variation for protein ratios in each fraction makes it possible to track potential errors in quantification due for example to erroneous calculation of a specific peptide pair ratio and to exclude them from quantifi-cation to improve the final result. Moreover display of the global coefficient of variation on the final averaged protein ratio allows the evaluation of the statistical significance of the final value calculated by the software.
Here we applied the MFPaQ software to characterize the membrane proteome of human ECs and the variation of pro-tein expression profile in response to cytokine stimulation. The MFP module of the MFPaQ software proved to be very
useful for the proteomics analysis of EC membrane proteins. More than 600 proteins were identified after fractionation of the crude microsomal fraction from primary human ECs by 1D SDS-PAGE and nano-LC-MS/MS analysis (Supplemental Data 1). More than 55% of these proteins are membrane proteins according to automatic bioinformatics classification; this represents a relatively good enrichment of the membrane proteome compared with similar studies (45). The list of iden-tified proteins comprises at least 41 known endothelial cell surface markers (Supplemental Data 1), including classical endothelial markers such as CD31/PECAM-1, VE-cadherin, ICAM-2, Tie-2, CD146/MUC18, podocalyxin, endothelial cell-selective adhesion molecule, angiotensin-converting enzyme/ CD143, endothelin-converting enzyme, dipeptidyl-peptidase IV/CD26, and ALCAM/CD166. Strikingly although all these classical EC markers were identified in a proteomics study of luminal EC plasma membrane proteins freshly isolated from rat lungs in vivo, they were not found in EC surface proteins purified from cultured rat lung microvascular ECs (46). There-fore, our results indicate that cultured primary human ECs (HUVECs), a widely used in vitro EC model first described in 1973 (47), retain a cell surface phenotype closer to the in vivo EC phenotype than cultured rat lung ECs. In addition, our results suggest that the number of EC membrane proteins that differ between ECs in vivo and in vitro, previously sug-gested to be⬃50% (46), may have been overestimated.
To the best of our knowledge, this is the first proteomics analysis of EC membrane proteins regulated by inflammatory cytokines. We used a combination of key proinflammatory mediators (TNF-␣, IFN␥, and lymphotoxin ␣/) to mimic the inflammatory microenvironment and performed a differential quantitative proteomics study using the ICAT method and the quantification module of the MFPaQ software. Our results revealed that ICAM-1, VCAM-1, and E-selectin, three critical cell adhesion molecules for leukocyte-endothelium interac-tions in inflammation (27), are the major EC membrane pro-teins up-regulated by inflammatory stimuli and the only ones induced more than 15-fold. These proteomics results are fully consistent with previous microarray data showing that ICAM-1 (-fold change, 111.9), E-selectin (-fold change, 48.0), and VCAM-1 (-fold change, 31.7) mRNAs were the most significantly induced after TNF-␣ treatment of human primary ECs (48). E-selectin, ICAM-1, and VCAM-1 mediate the initial rolling and arrest steps of leukocyte-EC interactions (27), which are followed by leukocyte transendothelial migration through EC junctions. Interestingly we identified two compo-nents of EC junctions that are regulated by proinflammatory mediators in human primary ECs. These two molecules, CD146 high molecular weight isoform and ALCAM/CD166, belong to the same protein family of immunoglobulin cell adhesion molecules, consisting of five extracellular immuno-globulin domains, a single transmembrane domain, and a short cytoplasmic tail, and may function in cell-cell cohesion (33, 41). The up-regulation of these proteins in ECs treated
with proinflammatory cytokines may therefore play an impor-tant role in the response of ECs to inflammation at the level of EC junctions and leukocyte transendothelial migration.
In conclusion, the present work validates the use of a new software tool for fast and efficient parsing of proteomics re-sults obtained from several Mascot files and extraction of quantitative data from raw MS files in isotopic labeling strat-egies using either the ICAT or SILAC technique. Develop-ments are in progress to adapt this software to additional types of labeling strategies including iTRAQ labeling and15N
metabolic labeling. Moreover a clear perspective of develop-ment for the application is to improve its compatibility with different MS platforms. The first module of the software, the Mascot File Parser, runs independently of the MS acquisition software and is thus of general use for proteomics platforms equipped with various instruments. The current quantification module, for its part, is dedicated to process .wiff data files generated on QStar instruments by the Analyst QS software. Future versions of this module will be compatible with data files acquired with different types of mass spectrometers and with different MS acquisition softwares. The MFPaQ software, as well as all validated proteomics data associated with this study, are freely available at mfpaq.sourceforge.net.
Acknowledgments—We are grateful to L. Canelle, K. Chaoui, M. Evain, C. Froment, M. Matondo, A. Stella, M. P. Bousquet-Dubouch, S. Uttenweiler-Joseph, and C. Gaspin for testing of the MFPaQ software and fruitful discussions.
* This work was supported in part by grants from Re´gion Midi-Pyre´ne´es, MAIN European Network of Excellence Grant FP6-502935, and the Ge´nopole Toulouse Midi-Pyre´ne´es. The costs of publication of this article were defrayed in part by the payment of page charges. This article must therefore be hereby marked “advertisement” in accordance with 18 U.S.C. Section 1734 solely to indicate this fact. □S The on-line version of this article (available at http://www. mcponline.org) contains supplemental material.
§ Both authors contributed equally to this work.
¶ To whom correspondence should be addressed: Inst. de Phar-macologie et de Biologie Structurale, CNRS UMR 5089, 205 route de Narbonne, 31077 Toulouse, France. Tel.: 5-61-17-55-41; Fax: 33-5-61-17-59-94; E-mail: anne.gonzalez-de-peredo@ipbs.fr.
REFERENCES
1. Forner, F., Foster, L. J., Campanaro, S., Valle, G., and Mann, M. (2006) Quantitative proteomic comparison of rat mitochondria from muscle, heart, and liver. Mol. Cell. Proteomics 5, 608 – 619
2. Wang, G., Wu, W. W., Zeng, W., Chou, C. L., and Shen, R. F. (2006) Label-free protein quantification using LC-coupled ion trap or FT mass spectrometry: reproducibility, linearity, and application with complex proteomes. J. Proteome Res. 5, 1214 –1223
3. Listgarten, J., and Emili, A. (2005) Statistical and computational methods for comparative proteomic profiling using liquid chromatography-tan-dem mass spectrometry. Mol. Cell. Proteomics 4, 419 – 434
4. Radulovic, D., Jelveh, S., Ryu, S., Hamilton, T. G., Foss, E., Mao, Y., and Emili, A. (2004) Informatics platform for global proteomic profiling and biomarker discovery using liquid chromatography-tandem mass spec-trometry. Mol. Cell. Proteomics 3, 984 –997
5. Prakash, A., Mallick, P., Whiteaker, J., Zhang, H., Paulovich, A., Flory, M., Lee, H., Aebersold, R., and Schwikowski, B. (2006) Signal maps for mass spectrometry-based comparative proteomics. Mol. Cell. Proteomics 5, 423– 432