HAL Id: hal-01807932
https://hal.archives-ouvertes.fr/hal-01807932
Submitted on 28 Jan 2021
HAL is a multi-disciplinary open access
archive for the deposit and dissemination of
sci-entific research documents, whether they are
pub-lished or not. The documents may come from
teaching and research institutions in France or
abroad, or from public or private research centers.
L’archive ouverte pluridisciplinaire HAL, est
destinée au dépôt et à la diffusion de documents
scientifiques de niveau recherche, publiés ou non,
émanant des établissements d’enseignement et de
recherche français ou étrangers, des laboratoires
publics ou privés.
YAG and greenYAG+nitride properties for white-light
generation using a blue laser diode
Ada Czesnakowska, G. Ledru, Benoit Glorieux, Georges Zissis
To cite this version:
Ada Czesnakowska, G. Ledru, Benoit Glorieux, Georges Zissis. YAG and greenYAG+nitride
proper-ties for white-light generation using a blue laser diode. Journal of Photonics for Energy, Society of
Photo-optical Instrumentation Engineers (SPIE), 2018, 8 (2), pp.026001. �10.1117/1.JPE.8.026001�.
�hal-01807932�
YAG and greenYAG+nitride properties for white-light generation
using a blue laser diode
Ada Czesnakowska*
a, Gerald Ledru
a, Benoit Glorieux
b, Georges Zissis
aa
LAPLACE (Laboratoire Plasma et Conversion d’Energie), Université de Toulouse III, 118 Route de
Narbonne 31062 Toulouse Cedex 9, France
b
CNRS, Université de Bordeaux ICMCB, UPR 9048 Pessac, France
ABSTRACT
The phosphor excitation by blue laser diode and an influence of its irradiation on the material were investigated. Two types of materials were elaborated to perform these experiments – yellow phosphor (YAG) and green phosphor mixed with nitride phosphor (GYAG). These phosphors were packaged into silicone plates, having different thickness and concentration in silicon resin. The results from exciting the phosphor by blue laser present that emission of converted light increases when concentration and thickness increases. Also the dependency of these two parameters on optical power shows certain behavior. Subsequently, the concentration and thickness was replaced by particle number in sample. It revealed that the dependency of the particle numbers on the optical power can replace the conventional parameters as thickness or concentration. Results show that correlated color temperature finds it dependency on number of particles also. In addition, it turned out, that for each of the material, there might exist an optimal particle number for the maximum luminous power. Finally, the influence of the irradiation of blue laser diode on the materials was investigated. After intensive irradiation for 30 minutes, we observed efficiency of light conversion decreases. It can be caused by damages made by laser on particles. Results show parts of nitride (650nm) conversion decrease less than yellow or green phosphor. Less affection of irradiation can be explained by nitride being very covalent material, more resistant to modification. Also, we found that there is no fundamental modification of material structure because of no changing in spectrum shape of converted light.
Keywords: blue laser diode, YAG, nitride, CCT, light spectrum, white light, aging process
1. INTRODUCTION
High-brightness white LEDs have been used as a promising light source due to their size, long life and energy saving. White light can be generated from LEDs in three major ways. The first one bases on mixing color of red, green and blue diode1. This method requires a complicated electric driver and optical elements to achieve accurate white light. Also the CRI value is poor. Another way is to use UV light to pump RGB phosphors2. Unfortunately, efficiency of UV LEDs is not so high and we also meet the UV light leakage issue. The third way is to mix blue light from diode with yellow light excited from yellow phosphor3. The last method becomes the most convenient and efficient to generate white light, so it has been commonly adapted in white LEDs4
Unfortunately, LEDs used in these devices suffer a loss in external quantum efficiency as operating current increases, known as a droop. This may lead to a shift in peak emission wavelength and broadening of the emission spectrum caused by increase of temperature. Variations of spectrum of LED and phosphor change the ratio of the light emitted by each component, resulting in shift in the color coordinates of the emitted light and decrease in overall device efficiency5.
An alternative to light-emitting diodes for obtaining white light can be blue laser diode. In contrast to LEDs, they do not exhibit efficiency loss. The output power and external quantum efficiency of laser diode increase linearly with current and maintains color stability of laser emission. Additionally, laser-based devices can be operated in reflection mode, allowing for the phosphor to be placed on a reflection substrate that may also act as a heat sink to effectively dissipate heat away from the phosphor.
In fact, it is the phosphor that plays a very important role in phosphor-converted white light to the luminous efficiency. The most significant factor is not only geometry shape, the particle size, thickness, but also the concentration
of the phosphor in the resin gels. The light output parameters depend on the thickness and concentration both, however they may not be two independent parameters. Treating them separately makes the composition recipe of phosphor much complicated for their target performance in CCT and CRI. As Yang et al.4 concluded, the hidden parameter – number of particles – is strongly related to thickness and concentration.
In this paper we studied the relation of the concentration, thickness and particles number of the two types of phosphors, used with blue laser diode to perform white light. The relationship of these parameters with optical efficiency was compared. Finally, the influence of the laser irradiation itself on the parameters of the materials was investigated.
2. PHOSPHOR EXCITATION BY BLUE LASER DIODE
2.1 Materials
A two-part high optical transparency silicon Dow Corning® EI-1184 was used as a matrix. Silicon was filled with different powders to obtain two different kinds of materials: yttrium aluminum garnet doped with Ce3+ (NYAG4354 Intematix) powder (YAG) and mixture of green phosphor doped with Ce3+ (GYAG3856-01-13 Intematix) and red nitride phosphor in ratio 4.5:1 (GYAG). Phosphors were incorporated at different weight in silicon plate of diameter of 15 mm. After mixing, to remove air bubbles, the mixture was placed in the vacuum pressure chamber until no bubble emerged. Then, the composite samples were obtained by curing at 120ºC for 20 minutes.
2.2 Excitation spectrum
As an excitation source the blue laser diode from Osram (TB450B, 460nm, 1.6W) with its beam size of 1.2x4 cm in 10 cm of distance from the material, without focusing, was used. The diode was supplied with the direct current about 0.6A. The light of the laser passes through the phosphor. Not all the blue light is absorbed by the yellow phosphor (efficiency of the phosphor plates is around 70%), the remnant of the blue light is mixed together with yellow light and can be perceived as a white light for human eyes.
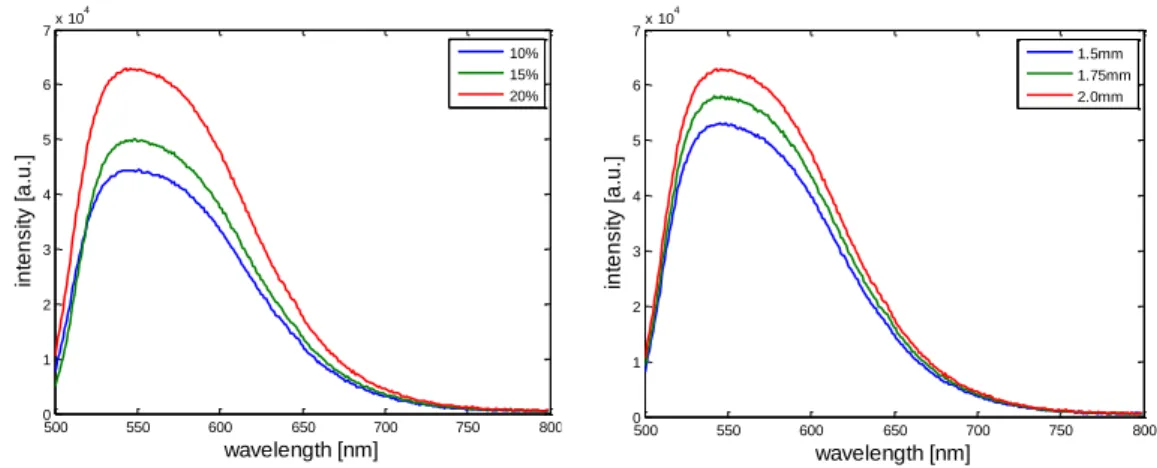
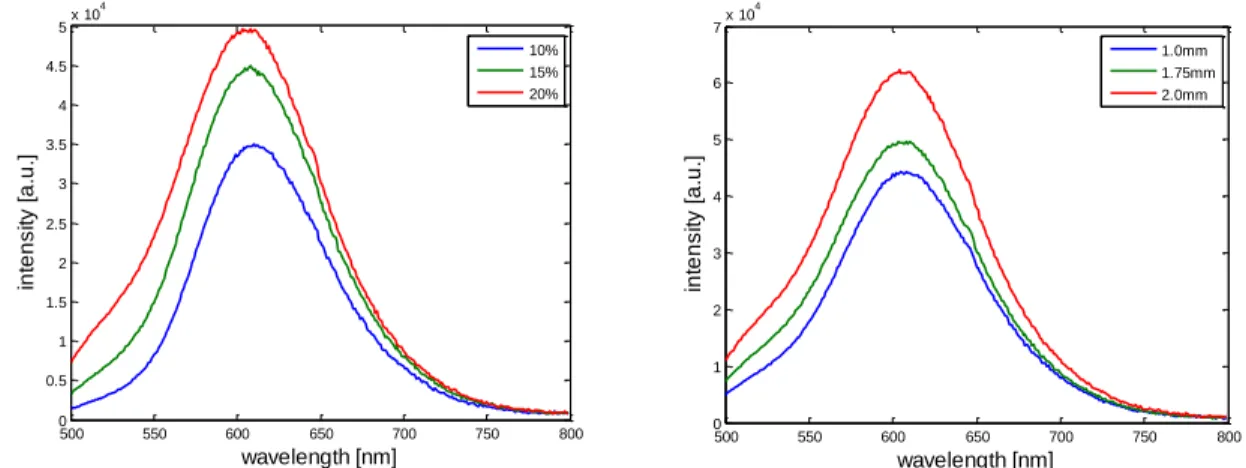
Spectrums of light converted by YAG are shown on Figure 1 and by GYAG on Figure 2. They were measured for different phosphor concentration (10%, 15%, and 20%) in silicon plate and different thickness (1.5mm, 1.75mm, 2.0mm). Measurements were performed by placing a laser as an input of integrating sphere (with internal surface coating of BaSo4) and phosphor plate as an output, to prevent it from heating. As measuring tool spectro-radiometer SpecBos 1201 was used. This spectro-radiometer not only allows measuring the spectrum of the light, but also luminescence, color temperature chromaticity coordinates and CRI.
Figure 1. Spectrum measurements for different concentrations and thicknesses of YAG.
500 550 600 650 700 750 800 0 1 2 3 4 5 6 7x 10 4 wavelength [nm] in te n s it y [ a .u .] 10% 15% 20% 500 550 600 650 700 750 800 0 1 2 3 4 5 6 7x 10 4 wavelength [nm] in te n s it y [ a .u .] 1.5mm 1.75mm 2.0mm
The global result from these first measurements is that increasing of the plate thickness or the phosphor concentration leads to increase of light emission. This point was already explained6 based on YAG material, showing that the key parameter is particle number, that can be modified by increasing the thickness of the package or the phosphor concentration.
To study the effects of thickness and the concentration of the phosphor better, the output light powers were calculated.
Figure 3. Output power of a laser and YAG with different thicknesses and concentrations.
Figure 2. Spectrum measurements for different concentration and thickness of GYAG.
Figure 4. Output power of a laser and GYAG with different thicknesses and concentrations.
500 550 600 650 700 750 800 0 1 2 3 4 5 6 7x 10 4 wavelength [nm] in te n s it y [ a .u .] 1.0mm 1.75mm 2.0mm 500 550 600 650 700 750 800 0 0.5 1 1.5 2 2.5 3 3.5 4 4.5 5x 10 4 wavelength [nm] in te n s it y [ a .u .] 10% 15% 20% 0.8 1 1.2 1.4 1.6 1.8 2 2.2 1 1.5 2 2.5 3 o p ti c a l p o w e r [l m ] thickness [mm] 5% 7.5% 10% 15% 20% 0.8 1 1.2 1.4 1.6 1.8 2 2.2 0.8 1 1.2 1.4 1.6 1.8 2 2.2 2.4 2.6 o p ti c a l p o w e r [l m ] thickness [mm] 5% 7.5% 10% 15% 20%
Figure 3 and 4 shows the output light power with different phosphor plates with various thickness and concentration. The same blue laser diode under the same value of current (0.6A) was applied as common light source for all the phosphor plates in this measurement. We observed that the output power changed in different combinations. For YAG in cases for the lower concentrations, the optical power increased as the thickness of the phosphor plate increased (5%, 7.5% and 10%). In contrast, for the cases of higher concentration, the light power decreased as the thickness increased. (15% and 20%). For GYAG plates the increase of the optical power with thickness was noticed only for the plate of 5% concentration. Additionally, the error bars on the figures were applied to show the measurements accuracy.
From both figure we can assume that the optical power increases with the thickness for different concentration, until it gets maximum of emission. After reaching optimal value, the power decreases with thickness. This phenomenon is strictly connected with another parameter – number of particles.
2.3 Number of particles
To see the relation between concentration and thickness, the number of particles in plate was calculated. The equations used for calculation were proposed by Yang et al.4.
The assumption made for the calculation is that shape of particles is spherical and they are uniformly distributed across the volume of the plates. The diameter of a yellow and green phosphor particle is d1=13 µm. The density of the phosphors is ρpho=4.8 g/cm3 and the density of the silicone resin – ρsil=1.04 g/cm3. The nitride phosphor has density ρn=3.1 g/cm3 and the diameters of particles d2=15 µm. The weight of the silicon resin is 0.73g. In the experiment itself – all of the phosphor plates are made in flat cylindrical shape. That indicates the area of sample equal to A=0.0167 cm2. The volume of the phosphor particle in the phosphor plate is:
(1)
where h indicates thickness and wpho denotes the concentration of the phosphor by weight and is calculated from:
(2)
where Wpho, Wn, Wsil are weight of phosphors, nitride phosphor and silicon, respectively. Let Npho be total particle number that is the sum of the number of phosphor particles Ndj with different diameters dj:
(3)
Where Ndj is related to the total particle number and their percentage, which can be written:
, j=1,2…k. (4)
Finally, the number of particles Npho is obtained:
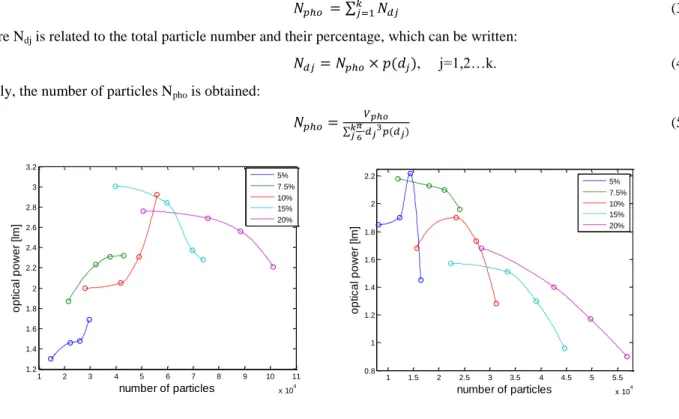
(5) 1 1.5 2 2.5 3 3.5 4 4.5 5 5.5 x 10⁴ 0.8 1 1.2 1.4 1.6 1.8 2 2.2 o p ti c a l p o w e r [l m ] number of particles 5% 7.5% 10% 15% 20% 1 2 3 4 5 6 7 8 9 10 11 x 104 1.2 1.4 1.6 1.8 2 2.2 2.4 2.6 2.8 3 3.2 o p ti c a l p o w e r [l m ] number of particles 5% 7.5% 10% 15% 20%
As we can see, the particles number can replace the concentration and thickness in exploration of phosphor excitation. It is believed that the process of collision between blue photons from laser with phosphor particles is much more essential in the exploration of phosphor excitation.
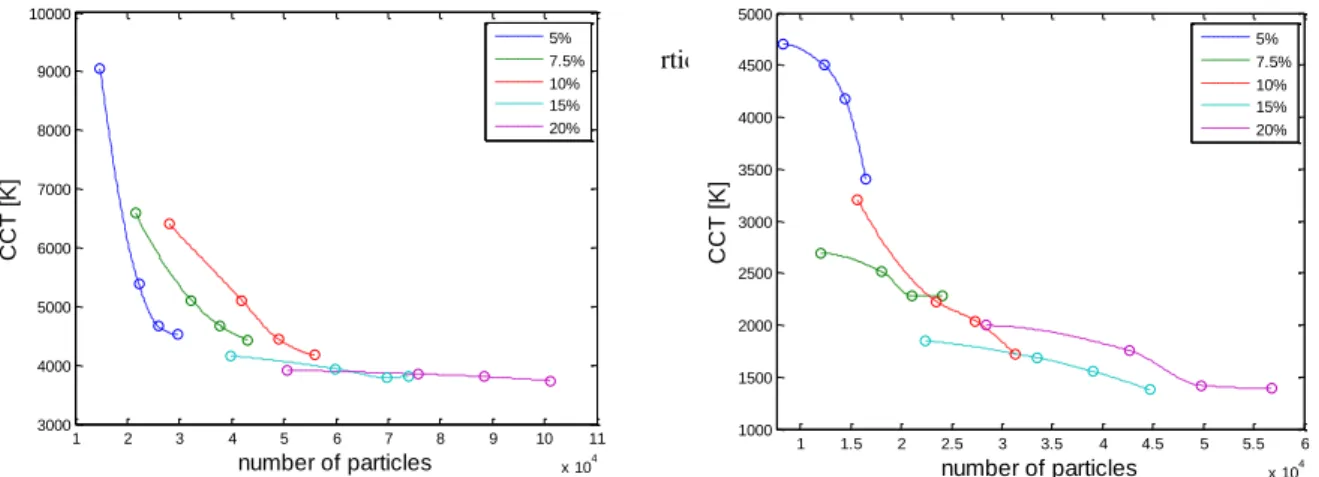
Figure 5 clearly shows the dependency between power and number of particles – for the lower concentration the optical power of light increases, again, in cases of higher concentration – decreases. We can notice that probably too high number of particles of phosphor in silicon resin causes decreasing of output power. Moreover, we also find that it could exist an optimal particle number of the phosphor for the maximal output power (4x10⁴ for YAG and 1.4 x10⁴ for GYAG) of the phosphor for maximal light output power. This value should correspond to the most proper condition for the phosphor particles uniformly suspending in the silicone resin. If there are not enough particles all the light is seldom to be scattered by more other particles. It causes easy escape for the light from the plate, such that the output flux increases and CCT reduces as the particle number increasing (figure 6). When the number of the particles is higher than the optimal one, the phosphor particles are more like too dense in the resins. In this case all the light becomes difficult to escape out of the phosphor plate such that the output flux decreases and CCT almost saturate as the particle number increasing. Nevertheless, the saturation of CCT is true only for plates of YAG. For plates where the GYAG with nitride were incorporated, the CCT seems to not to saturate. In fact, when the computed CCT falls below 2500K, the discrepancy between our system spectrum and a black body becomes too important, leading to poor accuracy on the final result. We are thinking that the CCT is not the appropriate metric in such cases.
3. PHOSPHOR AGING BY BLUE LASER DIODE
3.1 Laser irradiation
Mixing laser diode with the phosphor as a method of obtaining white light definitely has a lot of advantages. However, the aspect of long lasting laser irradiation on phosphor plate might cause some damages in material, which can lead to decreasing of efficacy of this system. So far, aging process of phosphor was performed in the oven, in high temperature, for a long time7,8. In our case, we put material under the high power laser irradiation, directly on the laser to accelerate the effects of irradiation.
The blue laser diode irradiates the material, what can cause deterioration of its structure, whereas any changing can lead to variation of light parameters. In this paragraph we are going to check the influence of the irradiation on the materials by looking the changes in emission spectrums of phosphor.
Figure 5. Output power in function of particle number of YAG (a) and GYAG (b).
Figure 6. CCT of light in function of particle number of YAG (a) and GYAG (b).
(a) (a) (b) (b) 1 2 3 4 5 6 7 8 9 10 11 x 104 3000 4000 5000 6000 7000 8000 9000 10000 C C T [ K ] number of particles 5% 7.5% 10% 15% 20% 1 1.5 2 2.5 3 3.5 4 4.5 5 5.5 6 x 10⁴ 1000 1500 2000 2500 3000 3500 4000 4500 5000 C C T [ K ] number of particles 5% 7.5% 10% 15% 20%
3.2 Experiment setup
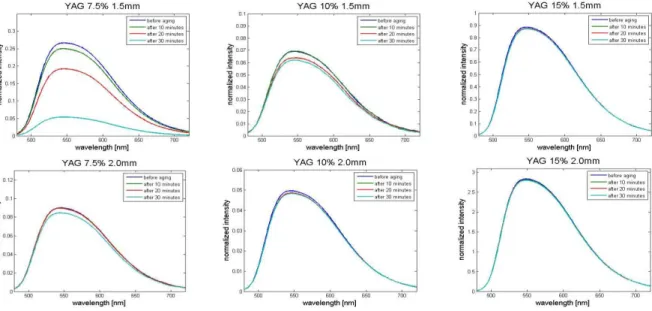
For the experiment materials with three different concentrations and two different thicknesses were chosen: YAG7.5%, YAG10%, YAG15%, 1.5 mm and 2 mm, and GYAG7.5%, GYAG10%, GYAG15%, 1.5 mm and 2 mm, respectively. Plate was stuck to the laser diode directly. In front of the laser the spectro-radiometer was set to measure the emitted light spectrum. During the measurements, the optical power was controlled by Newman Optical Power meter. First measurement of the spectrum was taken just after launching the blue laser diode (refers to “before aging” on the figures below). Then, after 10 minutes, 20 minutes and 30 minutes the measurement was repeated.
All the graphs were normalized to peak of 450nm which corresponds to the light emitted from diode. On the figures only the converted light was presented. As we can see below, the amount of convert light after aging process decreases. Proportion of the blue light that touches the particle is transformed in “yellow” with certain efficiency (70-80%). After the aging process, the efficiency of conversion is modified. The shape of the normalized spectra is not modified, which led us to assume that there is no structural modification of phosphor component.
500 1000 1500 2000 2500 3000 0 10 20 30 40 50 60 70 wavenumber [cm-1] in te n si ty [a .u .]
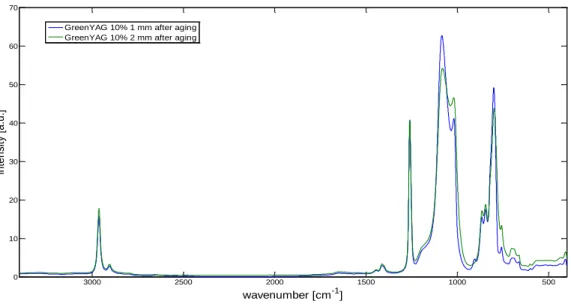
GreenYAG 10% 1 mm after aging GreenYAG 10% 2 mm after aging
Figure 8 shows influence of aging process on GYAG with nitride. We can observe the decrease of converted light emission after aging. However, compering to yellow emission by YAG from Figure 7, it can be noticed that drop in green emission is higher. YAG has defiantly higher stability than GYAG. However, we also have to point that red emission (650 nm) coming from nitride drops less than part of green emission of GYAG (550nm). Nitride is a material which is more covalent than the YAG. Indeed, nitride component contains nitrogen chemical bounds that are more covalent than oxygen bounds relevant of the YAG materials. This is due to the smaller electronegativity of nitrogen anion N3-; 3, instead of 3.5 for oxygen anion O2-. It induces a bond energy almost twice intense between nitrogen and neighbored cation (~940 kJ/mol) compared to oxygen and its neighbored cation (~500 kJ/mol), that are responsible of the chemical and physical hardness of the compound. In addition, it leads to a higher crystal field surrounding the luminescent cation, and to an intense nephelauxetic effect9. These two last phenomena are responsible of the high wavelength emission of nitride and low influence on a structure.
4. FOURIER-TRANSFROM INFRARED SPECTROSCOPY ANALYSIS
4.1 Results
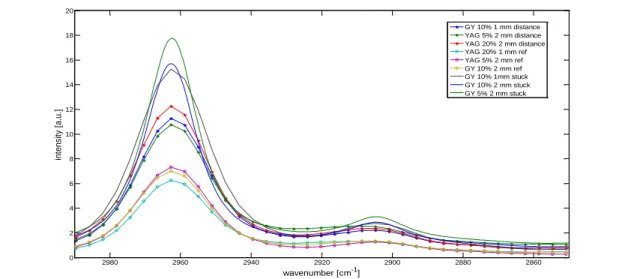
To see what are the changings made by laser irradiation on a structural level of the materials, the infrared analysis was performed. For this study we used a spectroscope InfraRouge ATR Shimadzu Miracle 10, with the wavelengths between 400 to 4000 cm-1 and step of 4cm-1. As a reference we used the zones not affected by irradiation (so-called “Ref”). To investigate the behavior of material more precisely, we compared the samples which were irradiated and stuck to the laser (“Stuck”) with the one, where irradiation was performed from a 2 cm of distance (“Distance”). The whole measurement (Figure 9) gives the information about all the Si-O-C-H mutual bonds that are into the silicone compound.
The most relevant part is related to the band 2965cm-1. It can be seen (Figure 10) that the band increases comparing to the reference value. This phenomenon is related to destruction the bond CH2=CH2, which can be found in silicon, and creation CH3. After destruction of the bond, the free radicals are created which lead to theirs’ recombination with the free particles of hydrogen causing creation of CH310.
Figure 8. Aging of GYAG + Nitride by laser irradiation.
Additionally, the influence of positioning sample directly on the laser is more significant than in case of keeping a sample in distance. Moreover, in this study, we didn’t observe the influence of phosphor concentration or thickness of a samples on an aging process by laser irradiation.
However, the optical properties of the phosphor can be modified, due to oxidation of the doping ions (Ce3+→Ce4+), thermal extension or thermal quenching11,12. Oxidation as well as extinction increase with temperature. Oxidation is irreversible, whereas extinction disappears on the return to the room temperature. Nevertheless, oxidation can also occur due to humidity and reactions with free radicals of polymers. In addition, by increasing the temperature, a broadening of
the emission band may
appear, and a shift of the
emission of the phosphor has to
be highlighted13.
Disadvantage of epoxy resin is its degradation under exposure to short wavelength radiations (UV/blue), excessive junction temperature and presence of phosphor. All these phenomena resulting in chain scission and discoloration. This is process is called yellowing and may lead to decrease of light output due to decreased transparency and discoloration14,15,16.
Figure 10. Infrared spectrum between 2850-3000cm-1.
Figure 11. Degradation of bond CH2=CH2 (A) and recombining, to create CH3 particles (B).
2860 2880 2900 2920 2940 2960 2980 0 2 4 6 8 10 12 14 16 18 20 wavenumber [cm-1] int ens it y [ a. u. ] GY 10% 1 mm distance YAG 5% 2 mm distance YAG 20% 2 mm distance YAG 20% 1 mm ref YAG 5% 2 mm ref GY 10% 2 mm ref GY 10% 1mm stuck GY 10% 2 mm stuck GY 5% 2 mm stuck
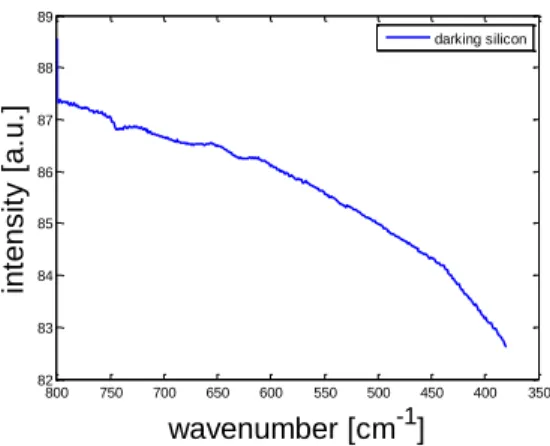
350 400 450 500 550 600 650 700 750 800 82 83 84 85 86 87 88 89 wavenumber [cm-1] int ens it y [ a. u. ] darking silicon
Figure 12. Discoloration of silicon.
To see darkening process, we left the silicon sample to heat on heating plate to 200°C, and subsequently, we ran the FTIR analysis. The transmission of the plate is presented on Figure 12. We can find a little bit more darkening on the blue side than the red side. Our preliminary measurements seem to reveal a 16% darkening in the blue side (short wavelengths) and a 13% darkening in the red side (long wavelengths)
5. CONCLUSIONS
In this study we investigated the parameters of two different materials for white-light generation by blue laser diode. We studied the dependency of optical power on thickness and concentration. It could be clearly noticed that the optical power increase with thickness for different phosphor concentration, until it gets optimum. We exchange traditional parameters like concentration and thickness by number of particles. It revealed that for low phosphor-concentrated materials the optical power increase. In high phosphor-concentrated materials – power decrease. We also noticed that by characterizing materials by using a particles number we can define the optimal amount of particles in material.
Ours studies contain also aging of materials by laser diode irradiation. These studies show that after a time the efficiency of material decreases. Nevertheless, efficiency of YAG seems to be higher than GYAG. However, part of nitride in “GYAG aging” seems to decrease less than yellow-green emission. This difference is due to properties of nitride which is very covalent material. Also, we concluded, that the particles of phosphor were not influenced by a laser diode on a structural level, regarding to no changing of shapes of bandwidth. On the other hand, the infrared analysis showed that bands of CH2= CH2 in polymer got destroyed, which leads to decreasing of silicon transparency, and also, to creation of CH3 particles. We also heated the silicon plate to 200°C to see the darkening process. It revealed that we can assume uniform discoloration of silicon.
REFERENCES
[1] Muthu, S., Schuurmans, F.J., Pashley M.D., “Red, green and blue leds for white light illumination”, IEEE J. Sel. Topics Quantum Electron., vol. 8, 333 (2002)
[2] Sato, Y., Takahashi, N., Sato, S., “Full-color fluorescent display devices using a near-uv light-emitting diode”, Jpn. J. Appl. Phys., vol. 35, no. 7A, L838-L839 (1996)
[3] Nakamura, S., Pearton S., Fasol, G., “The blue laser diode: the complete story”, Berlin, Germany: SpringerVerlag (2000)
[4] Yang, T-H., Chen C-C., Chen C-Y., Chang Y-Y., Sun C-C., “Essential factor for determining Optical Output of phosphor-converted LEDs.” IEEE Photonics J., Vol. 6, 8200209 (2014)
[5] Czesnakowska, A., Ledru, G., Glorieux, B. and Zissis, G., “Effect of different phosphor properties for white light generation using a blue laser diode” Journal of Light & Visual Environment, to be published (2017)
[6] Chang, Y-Y., Glorieux B., Hsu C-H., Sun C-C., Yu L-Z., Yang T-H., Chung T-Y., “Influence of ZrO2 particles on the optical properties of pc-LEDs”, Optical Materials, Vol. 55, 55-61 (2016)
[7] Yunsheng, H., Weidong, Z., Hongqi, Y., Shusheng, Z., Ying, F., Xiaowei, H., “Preparation and luminescent properties of (Ca1-x,Srx)S:Eu2+ red-emitting phosphor for white LED”, J. of Luminescence, Vol. 111, 139-145 (2005)
[8] Tsai C-C., Wang J., Chen, M-H., Hsu Y-C., Lin Y-J., “Investigation of Ce:YAG Doping Effect on Thermal Aging for High-Power Phosphor-Converted White-Light-Emitting Diodes”, IEEE Transaction on Dev. and Mat. Relib., Vol. 9, no 3, 367-371 (2009)
[9] Schäffer C.E., Klixbüll Jørgensen C., “The nephelauxetic series of ligands corresponding to increasing tendency of partly covalent bonding”, J. of Inorganic and Nuclear Chemistry, Vol. 8, 143-148 (1958)
[10] Cai D., Neyer A., Kuckuk R., “Raman, mid-infrared, near-infrared and ultraviolet-visible spectroscopy of PDMS silicone rubber for characteristation of polymer optical waveguide materials”, J. Mol. Struct., 274-281 (2010) [11] Qin J., Hu C., Lei B., Li J., Liu Y., Ye S., Pan M., “Temperature-Dependent Luminescence Characteristic of
SrSi2O2N2:Eu 2+
Phosphor and Its Thermal Quenching Behavior”, J. of Materials Science & Technology, Vol. 30, no 3, 290-294, (2014)
[12] Poncé S., Jia Y., Giantomassi M., Mikami M., Gonze X., “Understanding Thermal Quenching of Photoluminescence in Oxynitride Phosphors from First Principles” J. Phys. Chem. C, Vol. 120, no. 7, 4040– 4047, (2016)
[13] Czesnakowska A., Ledru G., Glorieux B., Zissis G., “Thermal Analysis of Blue Laser Diode for Solid State Lighting Application”, Optical and Photonics Journal, to be published (2018)
[14] Dirk van Driel W., Fan X., Qi G., “ZhangSolid State Lighting Reliability Part 2: Components to Systems”, Springer International Publishing, Beaumont, Texas, USA (2018)
[15] Tchoul M., Piquette A, Linkov A., “Polymeric Materials in Phosphor-Converted LEDs for Lighting Applications”, The Electrochemical Society Interface (2015)
[16] Chang T.C., Chiu Y.S., Chen H.B., Ho S.Y., “Degradation of phosphorus-containing polyurethanes”, Polymer Degradation and Stability, Vol. 47, no. 3, 375-381 (1995)