Publisher’s version / Version de l'éditeur:
Vous avez des questions? Nous pouvons vous aider. Pour communiquer directement avec un auteur, consultez la première page de la revue dans laquelle son article a été publié afin de trouver ses coordonnées. Si vous n’arrivez pas à les repérer, communiquez avec nous à PublicationsArchive-ArchivesPublications@nrc-cnrc.gc.ca.
Questions? Contact the NRC Publications Archive team at
PublicationsArchive-ArchivesPublications@nrc-cnrc.gc.ca. If you wish to email the authors directly, please see the first page of the publication for their contact information.
https://publications-cnrc.canada.ca/fra/droits
L’accès à ce site Web et l’utilisation de son contenu sont assujettis aux conditions présentées dans le site LISEZ CES CONDITIONS ATTENTIVEMENT AVANT D’UTILISER CE SITE WEB.
Building Research Note, 1976-01
READ THESE TERMS AND CONDITIONS CAREFULLY BEFORE USING THIS WEBSITE. https://nrc-publications.canada.ca/eng/copyright
NRC Publications Archive Record / Notice des Archives des publications du CNRC : https://nrc-publications.canada.ca/eng/view/object/?id=02e06027-4318-48e5-80c8-ccef7690bde1 https://publications-cnrc.canada.ca/fra/voir/objet/?id=02e06027-4318-48e5-80c8-ccef7690bde1
NRC Publications Archive
Archives des publications du CNRC
This publication could be one of several versions: author’s original, accepted manuscript or the publisher’s version. / La version de cette publication peut être l’une des suivantes : la version prépublication de l’auteur, la version acceptée du manuscrit ou la version de l’éditeur.
For the publisher’s version, please access the DOI link below./ Pour consulter la version de l’éditeur, utilisez le lien DOI ci-dessous.
https://doi.org/10.4224/40000601
Access and use of this website and the material on it are subject to the Terms and Conditions set forth at
Determining the optimum thermal resistance for walls and roofs
Division of B u i l d i n g Research National Research Council of Canada
DETERMINING
THE OPTIMW1 THEFNAL RESISTANCEFOR WALLS AND ROOFS
by
D. G. Stephenson
With energy costs rising r a p i d l y , and a growing aware- ness by t h e general p u b l i c o f t h e need t o conserve energy there
have been many suggestions that houses s h o u l d have more i n s u l a t i o n , There have been fewer s u g g e s t i o n s , however, on how to decide j u s t I~ow much insulation should be used. T h i s n o t e deals w i t h that question.
The approach suggested F s to s e e k t h e situation t h a t will
b e most economical f o r t h e building owner, and assume t h a t s o c i e t a l concerns a b o u t poLlution and d e p l e t i o n of nonrenewable resources will e n t e r into consideration v i a the price o f f u e l . The main d i f f e r e n c e between t h i s s t u d y and p r e v i o u s ones i s that it takes account of i n f l a t i o n and the expected increase in the cast o f f u e l d u r i n g the lifetime o f a b u i l d i n g . Allowing f o r these e f f e c t s l e a d s t o t h e conclusion t h a t the optimum amounts o f insuXation are much greater t h a n a r e called f o r i n the 1975 e d i t i o n of the
Residential Standards.
The economic a n a l y s i s used for this study i s straight
forward: t h e annual heat l o s s through u n i t area of a wall or roof
j.s expressed as a f u n c t i o n of t h e thermal resistance, and t h e c o s t
of providing t h i s amount of heat for t h e lifetime o f a b u i l d i n g is taken as t h e discounted present worth of the s e r i e s of annual pay- ments that would be r e q u i r e d to purchase t h i s h e a t . The c o s t o f c o n s t r u c t i n g walls and r o o f s w i t h d i f f e r e n t resistance values i s
estimated and the optimum resistance is taken as t h e one that h a s
a minimum t o t a l cost, i . e . , the lowest sum of f i r s t c a s t p l u s t h e p r e s e n t worth o f t h e h e a t t h a t would pass t h r o u g h a wall or r o o f .
No allowance has been made for t h e f a c t t h a t increased amounts of i n s u l a t i o n may mean that a smaller and less expensive h e a t i n g system could h e used. H e a t i n g equipment o n l y comes i n c e r t a i n s i z e s so t h e r e ~ ~ o u l d be a s a v i n g o n l y i f the maximum h e a t
R e s i d e n t i a l S t a n d a r d s , Canada, 19 75. National Research Council
of Canada, Assoc. Corn. N a t . Rldg. Code, Ottawa. 190 p . ,
l o a d dropped by enough to p e r m i t t h e use
of
a smaller u n i t . In a n y case t h e savingconnected
w i t h usinga
smaller furnace is q u i t e smallin
comparison w i t hthe
value of t h ef u e l
t h a t is saved, so n e g l e c t i n g this s a v i n g has very l i t t l e e f f e c ton
t h e optimumthermal
resistancefor
waf 1s and roofs.EST1 MATING ANNUAL HEAT REQUIREMENTS
Heat is lost from a b u i l d i n g by conduction through t h e
w a l l s , windows, roof and f l o o r or foundation and by t h e exfiltra- tion a f a i r . The sate
of
heat loss isQ = G . (T. - T )
1. 0
where T. = temperature i n s i d e the b u i l d i n g
1
T = o u t s i d e temperature
0
G = the t o t a l heat loss coefficjent f o r t h e b u i l d i n g . Tie value of
G
depends on the area of t h e d i f f e r e n t p a r t s o f theenclosure d i v i d e d by its thermal resistance, and on t h e r a t e at which t h e air in the b u i l d i n g
is
replaced by f r e s h air from o u t -s i d e . Increasing the amount of insulation in walls or c e i l i n g s decreases t h e value o f the total heat l o s s c o e f f i c i e n t and there- by reduces the amount of h e a t l o s t from t h e b u i l d i n g d u r i n g the h e a t i n g season.
P a r t of t h e heat loss
is
made up by t h e h e a t that isgenerated by electric l i g h t s and household appliances, particu- l a r l y t h e stove,
clothes
dryer and dishwasher. Some h e a t isg e n e r a t e d by the occupants and a s u b s t a n t i a l amount enters t h e house through t h e windows
in
the form of sunshine. The d i f f e r e n c ebetween the rate of l o s s and The rate of supply from the various
sources mentioned above is supplied by t h e h e a t i n g system. Thus,
where
Q*
= t h e t o t a l rate of heat g a i n f m m all sources other than the heating systemQf = the hear delivered by t h e h e a t i n g system.
Obviously t h e r e i s no need for any h e a t from t h e h e a t i n g system until
Q
exceeds Q*, s o t h e h e a t i n g system i s needed o n l ywhen
The outside temperature below which the h e a t i n g system comes i n t o a c t i o n can be designated as T", ,and
Q
f
= G (T* - T).0
The total heat a u t p u t required from t h e h e a t i n g system d u r i n g a
h e a t i n g season is
1
season J seas onThe degree-day method of e s t i m a t i n g h e a t i n g requirements
involves approximating
I
Q f d t by 2 4 GD,where D i s the number o f degsee-days f o r a complete h e a t i n g season.
F o r each day when the mean o f t h e d a i l y m a x i m u m and
m i n i m u m of o u t s i d e a i r temperature is below 6S°F,
t h e
d i f f e r e n c e between this mean and 65°F i s t h e number sf degree-days for t h a tday. The sum of all the d a i l y values during a h e a t i n g season is the annual t o t a l that is used to estimate annual heat r e q u i r e m e n t . The degree-day method implicitly assumes that T* is always 6 5 ° F a n d t h a t t h e daily mean value of To
is
t h e same as t h e mean a f t h e maximum and minimum temperature during t h e day. These assumptionsmay appear to be arbitrary, b u t it has been found t h a t f u e l
consumption can be c o r r e l a t e d reasonably well w i t h d e g r e e - d a y d a t a
that are o h r a i n e d in this nay. Experience has shown, however, t h a t the annual heat requirement
for a
well insulated house is about 25 per c e n t less t h a n 24GD,
i.e., thaxthe
constant s h o u l d be about 18 i n s t e a d o f 24,THE COST OF HEAT
At p r e s e n t m s t b u i l d i n g s in Canada are h e a t e d by b u r n i n g e i t h e r o i l or natural gas. The p r i c e o f bath these fuels h a s been
rising r a p i d l y and it seems likely that this trend w i l l continue.
This development has t o b e t a k e n into account when assessing the b e n e f i t that will r e s u l t f r o m using i n s u l a t i o n .
F o r e c a s t i n g t h e price of a commodity such as oil is extremely d i f f i c u l t , but an estimate must b e made before t h e
opsimum amount of i n s u l a t i o n can be determined. F i g u r e 1 shows
how No. 2 furnace oil and electricity p r i c e s may change d u r i n g
t h e next two decades. It i s assumed that t h e price o f electricity
will rise at a rate of 12 per
cent
p e r year mainly as a consequenceof i n f l a t i o n . The o t h e r basic assumption is t h a t t h e p r i c e of o i l w i l l continue t o incxease until it catches up to the price o f
electricity, and t h a t t h e r e a f t e r it will s t a y at parity with
electricity o r , if it rises above t h e price of electricity, that these would be a widespread changeover to electricity for space
h e a t i n g . It is p o s s i b l e , of course, that fuel prices may be con-
trolled by the government r a t h e r than by free market forces, b u t t h e r e is no way of p r e d i c t i n g what t h e prices would be n o r how
long the p o l i c y would last. Thus, this study is based on the b a s i c assumption t h a t the price of heating oil will be l i m i t e d
by t h e competition between it and e l e c t r i c i t y produced by CANDU-
type nuclear power p l a n t s ,
F i g u s e 1 shows two paths for the price of oil: the h i g h e r one is f o r a rate of increase of 20 per cent p e r y e a r f o r t h e n e x t three years, b y which time it will have reached p a r i t y w i t h electricity, and t h a t after 1978 it will increase at only
32 per cent per year; t h e lower one assumes a r a t e o f increase o f only 15 per cent per year, which means it will not reach p a r i t y w i t h electricity until 1982, It is d i f f i c u l t to say which is t h e b e t t e r estimate, b u t as is shown in the following sections, there
is only a very small r e d u c t i o n in the optimum amount of insulation if one uses t h e lower r a t h e r than the h i g h e r curve f o r t h e p r i c e
o u t t o be the b c t t e r f o r e c a s t . 'I'Ile s l o p e of t h e curve f o r electri- city, w h i c h i s take!^ t o be t h e c e i l i n g f o r t h e c o s t of heat, is a much mare important parameter: 12 pcr c e n t p e r y e a r is r e a l l y j u s t a guess b u t it seems t o he a reasonable v a l u e f o r t h i s f a c t o r .
Natirral pas is currcntjy less e x p e n s i v e t h a n f u e l o i l , e s p e c i a l l y i n l4;cstcrn C a n d a . T h e p r i c e o f gas will probably keep
a n r i s i n g u n t i l it a l s o yeaches p z r i t y w i t h an alternative f u e l o r at l e a s t u n t i l the p r i c c is high enough t o make j t economically f e a s i b l c to b r i n g gns f r o n ~ t h c i?rctj c t o s o u t h e r n Canada. F o r t h e
purposes of t h i s s t : ~ d y
i e
has hce-r. assumed that t h e r e a l value a fas
as a f u e l i s t h e szme as o i i a n d t l i ~ s no d i s t i n c t i o n i s mades o f a r as Y ~ I E ! 0pti1;ltlm arnount~ o f i n s u l a t i o n i s concerned.
PRESENT IVQRTI-I FACTRR
A problem t h a t a r i s e s v e r y frequently in investment
calculations is Iioia to canpare an i ~ i t l a l cash investment w i t h t h e s a v j n g that it ~llill 7-r*oduce d u r l n g t h e l i f e t i ~ n e o f a pi-ece o f
equipment. I t c a n n o t b e c l a i m e d f o r example, t h a t a $1000 i n v e s t - ment i s p a i d of in 1 0 y e a r s
S f
it reduces o p e r a t i n g c o s t s by $100 p e r y e a r . A t a n i n t e r e s t rate oF 30 pcr c e n t the $100 savingwnuld j u s t pay t!le i ~ ~ t e - n - ~ s ; t , 2nd The i n v e s t m e n t would never b e p a i d o f f . Mow much can one j u s t i f y investing i n o r d e r to g e t a
b e n e f i t o f $100 p e r y e a r f o r a p e r i o d of 10 years? I f it is assumed t h a t t h e a p ~ r o p ~ i z t c i n t e r c s t r a t e is 10 p e r c e n t t h e anstrrer is $614.45. T h i s is t h e p r e s e n t v a l u e o f a s e r i e s o f t e n a n n u a l payments o f $100 e a c h when money i s w o r t h 10 per c e n t p e r annum. 1 1 i s cen a l s o IJC l o o k e d a t in rerrns o f a mortgage: if one borrows $ 6 1 4 . 5 5 a t 1.0 p e r c e n t i n t e r c s t it t a k e s t e n annual pay- ments o f $100 t o pa?- t h e i n t e r e s t and repay t h e principal. The p r e s e n t worth f a c t o r , P , is tlbe r a t i o of t h e p r e s e n t worth o f a s e r i e s of annual payments to ~11c amo~lnt o f cach annual payment. Thus i n the examplc c i t e d above the p r e s e n t w o r t h f a c t o r i s $ 6 1 4 . 4 5
+
$100 or 6.1445. The p r e s e n t warth f a c t o r has no u n i t sas it is the r a t i o o f two quantities t h z t a r e b o t h e-xpressed in
do1 1 ars
.
Thc v a l u e of P i s r e l a t e d to t h e i n t e r e s t r a t e , i , and t h e lengz11 of t l ~ c t-crn~, > I , by t h e expression
In t h e case of a f u e l saving due t o the use o f extra
i n s u l a t i o n the annual payment is the value o f the f u e l t h a t i s
saved. The amount o f t h i s saving increases as t h e p r i c e
o-E
f u e l increases. I f the priceof fuel
increases by x p e r centper
y e a ras a r e s u l t of i n f l a t i o n and the r i s e in t h e real c o s t of fuel, t h i s can be taken i n t o account by u s i n g an effective i n t e r e s t r a t e , y, in place of
the
nominal r a t e i. The e f f e c t i v e rate i s r e l a t e d t o i and x byi - x y = l + x -
If the nominal i n t e r e s t r a t e
is
10 per cent and the c o s t ofelectricity increases by 12 p e r cent per year, y = - 0 . 0 1 7 8 6 . T h i s
gives a p r e s e n t worth factor of P = 24.30 when N = 20 years. T h i s means t h a t t h e p r e s e n t w o r t h of any conservation measure t h a t will
save $1-00 worth of e l e c t r i c i t y in the f i r s t year, $ 1 . 1 2 worth in t h e second year and so on f o r 20 years is $24.30.
The present worth factors given in T a b l e 1 show t h e
sensitivity of
P
to t h e term N and to t h e e f f e c t i v e i n t e r e s t r a t e Y "Table I Present Worth F a c t o r s
It is not possible t o s a y exactly what value of x should be assumed, b u t 1 2 p e r cent
seems
a conservative ( i - e . , low) guessf o r e l e c t r i c i t y . Using t h a t and
i
= 10 per cent and a term of 30 years gives a value a f P f o r e l e c t r i c i t y of 40.1. The valuesf o r
oil have been o b t a i n e d on t h i s same b a s i s b u t u s i n g t h e p r i c eN, years 10 2 0 30 40 Y r 0.02 8 - 9 8 16.35 22.40 2 7 . 3 6 0 . 0 0 -0.02 l o . 00 20.00 30.00 41) . O O 11.19 24 .89 41.66 6 2 . 1 8
forecasts given in F i g u r e I . For t h e h i g h e r r a t e of p r i c e rise the v a l u e of P i s 4 8 . 7 ; w i t h the lower r a t e of p r i c e increase P i s
4 8 . 4 .
I t is perhaps surprising t h a t t h e
P
values f o r a i l a r e l a r g e r t h a n for electricity. T h i si s
due to t h e assumption t h a t rhe p r i c e of o i l will rise at a h i g h e r percentage rate than electricity. It does n o t follow, however, t h a t one can j u s t i f yi n v e s t i n g a larger amount o f c a p i t a l i n o r d e r t o save a Rtu d e r i v e d from o i l than if the h e a t was derived from e l e c t r i c i t y . The
present worth of an annual s a v i n g of one million
Btu's
o f h e a t i s the present worth factor multiplied by the current cost of thisunit of energy, Figure 1 shows t h e 1975 p r i c e of one million Btu
from electricity and o i l as $3.80 and $3.10 respectively. Thus
the present worth of a measure that would save one million Btu/yr
of electricity would be $3.80 x 40.1 = $152, and if t h e heat were obtained by burning oil the present worth of t h e s a v i n g would be $ 3 . 1 0 x 4 8 . 7 = $15 1 f o r t h e h i g h e r o i l p r i c e curve and about $1
l e s s for the lower one. Thus, it does n o t make much difference
which oil price pattern is assumed and, in fact, t h e r e is not a
significant d i f f e r e n c e between t h e values for oil and electricity.
OPTIMU'b! THERMAL RESISTANCE
The optimum amount of insulation for
a
wallor
roof is that a t rvhich the saving r e s u l t i n gfrom
adding any more insulation just equals the cost of adding t h e extra insulation. Thc c o s t persquare foot
of
constructinga
wall can be expressed aswhere A = a constant t h a t is independent of t h e amount of i n s u l a t i o n
in
t h e wallB = the incremental c o s t
of
i n s u l a t i o n expressed as + / f t 2 per u n i t of resistanceR
= t h e thermal r e s i s t a n c evalue
for t h e wall, f t 2hr
O F / B ~ U .The heat l o s s through one square foot of wall d u r i n g a
heating season can be approximated, using the simple degree-day method discussed previously, by 18 D / R ~ t u / f t ' ~ r . The c o s t of providing this amount of h e a t is 18 CD/ER +/ft2yr, where
C
i s thecost of heat
in
# / S t l ~ ,D
is
.the numberof
degree-dxys per y e a r and E is che scasanal efficiencyaf
thefurnace,
'ihe t a t s 1
payments
f o rf u e l
during t h e lifctimc o f ah u i l d i n ~ can be expressed as
an
i n i t i a l l q - s u r , ~ amnlmt by m r l l t i - p l y i n g :Fir: annual cost by 3 present worth factorP.
Thus an "op?im~nl" V ~ ~ I J F ! OF t h e thermxl resistance i s the one t h a t makes t h c s l m A .'. RR + 18 CI)P/ER a minimum. *i'his 7Tcptim~~mtt r e s i s t a n c ei s
Some typical values for t h e factors are:
B = 1,3+/ft2 p e r unit of resistance (using glass fibre type i ns~alation)
C =
2 - 4 x 10-l) $ / R t l l (i. e. ,
40+/gal for No. 2 f u c l 03.1)T I = 8000 (Montreal area]
i3 .= 0.75 (For art ei.1.-burning furnace)
11 :: ~ y ) [to be conservative]
On * L ~ c b a s i s o f these valucs t h e optimtlm resistance is 37.6 u n i t s .
' h c cxpressien f o r R is based on thc asstimption thnt OPT
A and i3 arc independent o f t h e value o f R. This
is
generally t.rwfor c e i l i n q s , where there is plenry of space in the a t t i c to
accommodat.c e x t r a jnsulxtion. Thus, the simple f o m r l a is
appropriate f o r c e i l i n g s under an a t t i c . B I K
for
walls i L js n o tv a l i d , as r.lnc values indicated b y t h e formula are f a r in Excess o f w h a t can he obtained hy a d d i n g insulation in t h e stud spncc of a
conventional ~ 0 3 d frame wall. So for walls it is necessary to proceed i n a somewhat d i f f e r e n t way to f i n d t h e optimum val~w of
W.
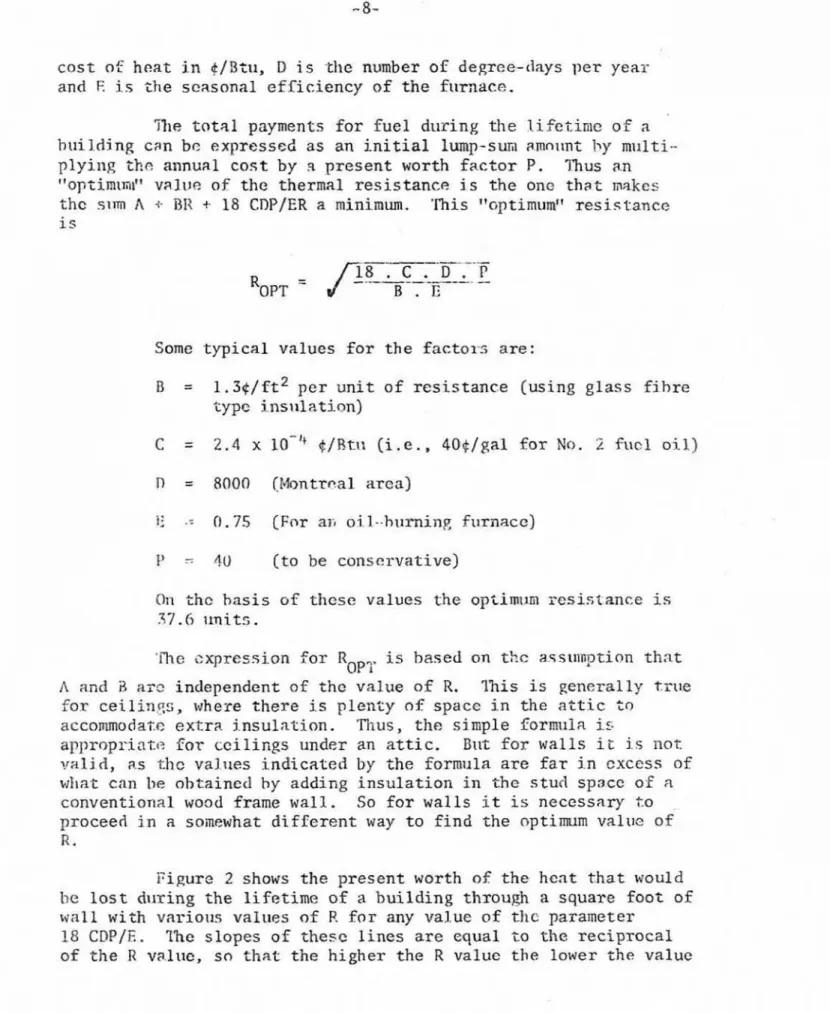
Figure 2 shows t h e present worth of t h e heat t h a t would
be
lest
during t h e lifetimeof
a b u i l d i n g through asquare
foot ofwall with various val~ies of P.
f o r
any val.ue of t h e parameter 18 CPPJE, The slopes of these lines are equal r o t h e reciprocal of the- R v;l.lue, sn t h a t the h i g h e r t h e R valuc the lower t h e valueo f t h e heat that would pass through the wall. To g e t a
t r u e
i n d i - c a t i o n of the r e l a t i v e merit of one R v a l u evs,
another i t i s necessary to a d d t o t h e c o s t s i n F i g . 2 the incremental c o s t of a c h i e v i n g the h i g h e r values of R.Figure 3 shows t h e comparison of R = 1 2 . 5 , R = 15 and
R = 20 w i t h the assumptions t h a t an R = 15 wall would c o s t 5 $ / f t 2 more t o b u i l d t h a n an R = 12.5 wall, and t h a t an R = 20 w a l l \'auld c o s t 2 0 $ / f t 2 more t h a n an R = 15 w a l l . These f i g u r e s have been chosen simply t o i l l u s t r a t e t h e approach, but a r e approximately correct. On t h e b a s i s of t h e s e assumptions, F i g . 3 i n d i c a t e s that t h e t o t a l l i f e - c y c l e c o s t w i t h an R = I 5 wall is less than for an R = 12.5 w a l l wherever t h e value of 18 CDP J E exceeds 370, and t h a t
an R = 20 wall would g i v e a l o w e r l i f e - c y c l e c o s t than an R = 15 w a l l i f t h e c l i m a t e - c o s t parameter was greater t h a n 1190. L i n e s
f o r any o t h e r v a l u e of R could be added to F i g . 3 to s e e how it
would conpare w i t h t h e s e cases.
In order to interpret t h e results shown in F i g . 3 it is
necessary t o know the value o f t h e parameter 18 CDP/E f o r different p a r t s o f Canada. For i n s t a n c e , in Montreal t h e value o f D i s 8000
a n d if t h e h e a t i s o b t a i n e d by b u r n i n g No. 2 fuel o i l c o s t i n g 4 0 $ / g a l , t h e c o s t i s 0.24 x $/Btu. I f t h e f u r n a c e is well maintained, t h e seasonal efficiency might be as much as 0.75. The p r e s e n t w r t h f a c t o r f o r o i l heating would be about SO if t l r e p r i c e of o i l follows t h e p a t h shown an F i g . 1, but P = 40 will be u s e d t o keep t h e r e s u l t s on t h e conservative s i d e . These data lead to a value of 1840 f o r t h e climate-cost parameter f o r Montreal.
Vancouver h a s only 5515 degree days s o i f t h e o t h e r f a c t o r s were t h e same t h e climate-cost parameter t h e r e would be 1275. Thus
F i g . 3 shows t h a t in Vancouver an R = 20 wall would have a s l i g h t l y lower l l f e - c y c l e c a s t than an R = 15 w a l l , and t h a t i n the colder climate o f Montreal t h e r e would be a definiTe advantage in u s i n g t h e R = 20 wall. I n f a c t , it m i g h t be advantageous
i n
Montreal to use a wall w i t h an R of more than 20, This would depend on thee x t r a cast involved in constructing a wall w i t h more resistance.
CONCLUSION
There are
two
key pieces of data that have to be estab- l i s h e d b e f o r e t h e optimum h e a t resistance of a w a l l or roof can h e determined:1) The incremental c o s t of constructing walls
o r
roofs with v a r i o u s valuesof
Rin
excess of 12.5;2 ) The value of the present worth factor t h a t should be used for converting f u t u r e f u e l savings i n t o a
c u r r e n t lump-sum value.
On the b a s i s of the data assumed in this s t u d y i t
appears t h a t an R = 20 wall would be appropriate for m o s ~ parts of Canada.
FIGURE 2 P R E S E N T W O R T H OF H E A T LOST D U R I N G L I F E T I M E O F B U I L D I N G T H R O U G H 1 5 0 F T O F W A L L
V A N C O U V E R
C L I M A T E - C O S T P A R A M E T E R 1 8 C D P / E
M O N T R E A L