Classification of stop consonant place of articulation
by
Atiwong Suchato
B.Eng., Chulalongkorn University (1998) S.M., Massachusetts Institute of Technology (2000)
Submitted to the Department of Electrical Engineering and Computer Science in partial fulfillment of the requirements for the degree of
Doctor of Philosophy
at theMassachusetts Institute of Technology
June 2004© Massachusetts Institute of Technology 2004. All rights reserved.
Author _________________________________________________________________ Department of Electrical Engineering and Computer Science
April 27th, 2004
Certified by _____________________________________________________________ Kenneth N. Stevens Clarence J. LeBel Professor of Electrical Engineering and Professor of Health Sciences & Technology Thesis Supervisor Accepted by _____________________________________________________________
Classification of Stop Consonant Place of Articulation
by
Atiwong Suchato
Submitted to the Department of Electrical Engineering and Computer Science on April 27th, 2004, in partial fulfillment of the
requirements for the degree of
Doctor of Philosophy in Electrical Engineering and Computer Science
Abstract
One of the approaches to automatic speech recognition is a distinctive feature-based speech recognition system, in which each of the underlying word segments is represented with a set of distinctive features. This thesis presents a study concerning acoustic attributes used for identifying the place of articulation features for stop consonant segments. The acoustic attributes are selected so that they capture the information relevant to place identification, including amplitude and energy of release bursts, formant movements of adjacent vowels, spectra of noises after the releases, and some temporal cues.
An experimental procedure for examining the relative importance of these acoustic attributes for identifying stop place is developed. The ability of each attribute to separate the three places is evaluated by the classification error based on the distributions of its values for the three places, and another quantifier based on F-ratio. These two quantifiers generally agree and show how well each individual attribute separates the three places.
Combinations of non-redundant attributes are used for the place classifications based on Mahalanobis distance. When stops contain release bursts, the classification accuracies are better than 90%. It was also shown that voicing and vowel frontness contexts lead to a better classification accuracy of stops in some contexts. When stops are located between two vowels, information on the formant structures in the vowels on both sides can be combined. Such combination yielded the best classification accuracy of 95.5%. By using appropriate methods for stops in different contexts, an overall classification accuracy of 92.1% is achieved.
Linear discriminant function analysis is used to address the relative importance of these attributes when combinations are used. Their discriminating abilities and the ranking of their relative importance to the classifications in different vowel and voicing contexts are reported. The overall findings are that attributes relating to the burst spectrum in relation to the vowel contribute most effectively, while attributes relating to formant transition are somewhat less effective. The approach used in this study can be applied to different classes of sounds, as well as stops in different noise environments. Thesis supervisor: Professor Kenneth Noble Stevens
Acknowledgement
It takes more than determination and hard work for the completion of this thesis. Supports I received from many people through out my years here at MIT undeniably played an important role. My deepest gratitude clearly goes to Ken Stevens, my thesis supervisor and my teacher. His genuine interest in the field keeps me motivated, while his kindness and understanding always help me go through hard times. Along with Ken, I would like to thank Jim Glass and Michael Kenstowicz for the time they spent on reading several drafts of this thesis and their valuable comments. I would like to specially thank Janet Slifka for sharing her technical knowledge, as well as her study and working experience, and Arlene Wint for her help with many administrative matters. I could hardly name anything I have accomplished during my doctoral program without their help. I also would like to thank all of the staffs in the Speech Communication Group, including Stefanie Shattuck-Hufnagel, Sharon Manuel, Melanie Matthies, Mark Tiede, and Seth Hall, as well as all of the students in the group, especially Neira Hajro, Xuemin Chi, and Xiaomin Mou.
My student life at MIT would have been much more difficult without so many good friends around me. Although it is not possible to name all of them in this space, I would like to extend my gratitude to them all and wish them all the best.
I would like to thank my parents who are always supportive. Realizing how much they want me to be successful is a major drive for me. Also, I would like to thank Mai for never letting me give up, and for always standing by me.
Finally, I would like to thank Anandha Mahidol Foundation for giving me the opportunity to pursue the doctoral degree here at MIT.
Table of Contents
Chapter 1 Introduction... 17
1.1 Motivation... 17
1.2 Distinctive feature-based Speech Recognition System... 19
1.3 An Approach to Distinctive Feature-based speech recognition... 20
1.4 Literature Review... 25
1.5 Thesis Goals... 29
1.6 Thesis Outline ... 29
Chapter 2 Acoustic Properties of Stop Consonants... 31
2.1 The Production of Stop Consonants ... 31
2.2 Unaspirated Labial Stop Consonants... 33
2.3 Unaspirated Alveolar Stop Consonants ... 34
2.4 Unaspirated Velar Stop Consonants ... 34
2.5 Aspirated Stop Consonants... 36
2.6 Chapter Summary ... 36
Chapter 3 Acoustic Attribute Analysis... 37
3.1 SP Database ... 38
3.2 Acoustic Attribute Extraction ... 40
3.2.1 Averaged Power Spectrum ... 40
3.2.2 Voicing Onsets and Offsets ... 41
3.2.3 Measurement of Formant Tracks ... 41
3.3 Acoustic Attribute Description ... 43
3.3.1 Attributes Describing Spectral Shape of the Release Burst... 43
3.3.2 Attributes Describing the Formant Frequencies ... 48
3.3.3 Attributes Describing the spectral shape between the release burst and the voicing onset of the following vowel... 50
3.3.4 Attributes Describing Some Temporal Cues ... 50
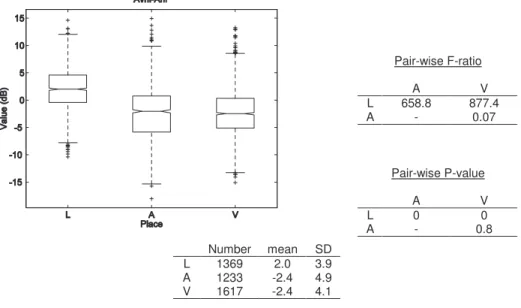
3.4 Statistical Analysis of Individual Attributes... 52
3.4.1 Results... 57
3.4.2 Comparison of Each Acoustic Attribute’s Discriminating Property ... 93
3.4.3 Correlation Analysis ... 96
3.5 Chapter Summary ... 98
Chapter 4 Classification Experiments ... 101
4.1 Classification Experiment Framework ... 102
4.1.1 Acoustic Attribute Selection... 102
4.1.2 Classification Result Evaluation... 104
4.3 LOOCV Classification Using Only Formant Information ... 110
4.4 Effect of Context Information... 112
4.5 Classification of Stops that have Vowels on Both Sides ... 115
4.5.1 Attribute-level Combination ... 116
4.5.2 Classifier-level Combination ... 121
4.6 Evaluation on the SP Database ... 130
4.7 Chapter Summary ... 139
Chapter 5 Discriminant Analysis... 141
5.1 LDA Overview... 141
5.2 Contribution Analysis on CV tokens in the ALL dataset ... 144
5.3 Contribution Analysis on VC tokens in the ALL dataset ... 148
5.4 Contribution Analysis on CV tokens with known voicing contexts... 152
5.5 Contribution Analysis on CV tokens with known vowel frontness contexts . 154 5.6 Contribution Analysis on VC tokens with known voicing contexts... 154
5.7 Contribution Analysis on VC tokens with known vowel frontness contexts . 155 5.8 Summary on the Contribution to the Place Classification of the Acoustic Attributes in Different Contexts ... 156
5.9 Chapter Summary ... 157
Chapter 6 Conclusion ... 159
6.1 Summary and Discussion... 159
6.2 Contributions... 169
6.3 Future Work... 171
Biblography ... 175
List of Figures
Figure 1-1: Distinctive feature-based approach for representing words from analog acoustic signal... 21 Figure 1-2: Illustration of an approach to distinctive feature-based speech recognition system ... 21 Figure 1-3: A diagram for a distinctive feature-based speech recognition system with the feedback path. (After Stevens, 2002)... 24 Figure 2-1: A spectrogram of the utterance /ax g ae g/. The movement of the articulators that is reflected in the acoustic signal in the area marked (1), (2) and (3) is explained in the text above. ... 33 Figure 2-2: Spectrogram of the utterance of (a) /b aa b/, (b) /b iy b/, (c) /d aa d/, (d) /d iy d/, (e) /g aa g/, and (f) /g iy g/. (The horizontal axes in all plots show time in second) ... 35 Figure 3-1: Examples of average power spectra of stops with the three places of articulation. The values of Ahi, A23, and Amax23 (calculated from these sample spectra) are shown by the location in the direction of the dB axis of their associated horizontal lines... 47 Figure 3-2: An example of CLS_DUR and VOT of the consonant /k/ in a portion of a waveform transcribed as /l uh k ae t/. CLS_DUR is the time interval between the voicing offset of the vowel /uh/ to the release of the /k/ burst. VOT is the time interval between the release of the /k/ burst to the voicing onset of the vowel /ae/. 51 Figure 3-3: A diagram showing an example of a box-and-whiskers plot used in this study
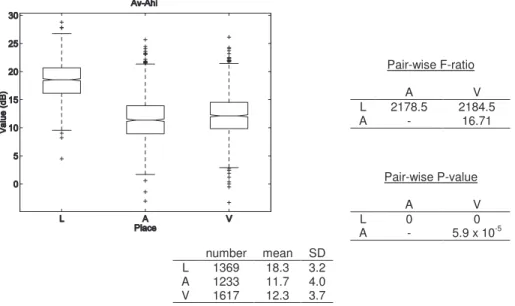
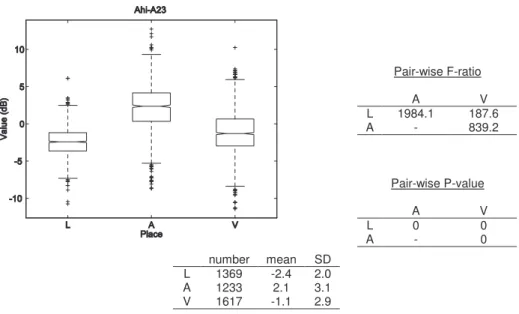
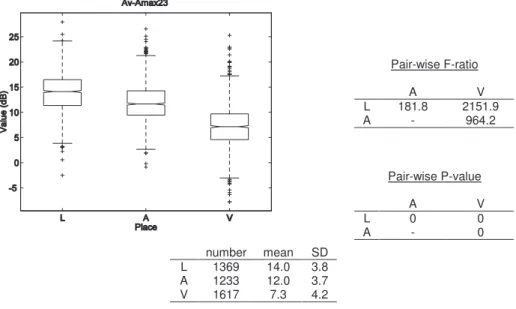
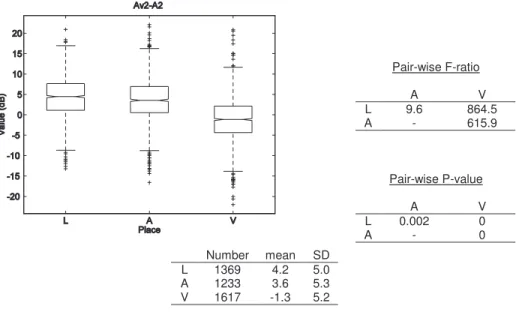
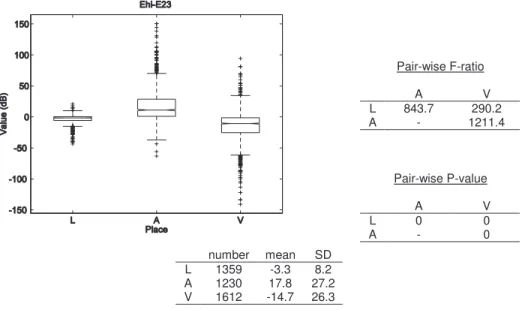
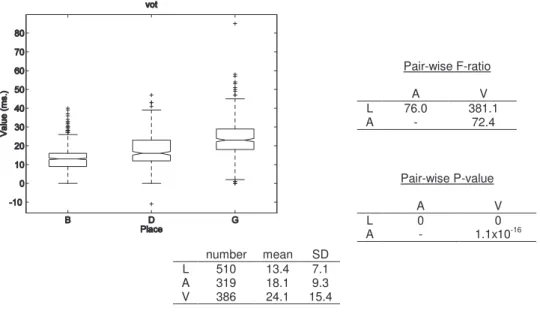
... 53 Figure 3-4 : Box-and-whiskers plot and statistics of Av-Ahi values for the three places of articulation ... 58 Figure 3-5 : Box-and-whiskers plot and statistics of Ahi-A23 values for the three places of articulation ... 59 Figure 3-6 : Box-and-whiskers plot and statistics of Av-Amax23 values for the three places of articulation ... 60 Figure 3-7 : Box-and-whiskers plot and statistics of Avhi-Ahi values for the three places of articulation ... 61 Figure 3-8 : Box-and-whiskers plot and statistics of Av3-A3 values for the three places of articulation ... 62 Figure 3-9 : Box-and-whiskers plot and statistics of Av2-A2 values for the three places of articulation ... 64 Figure 3-10 : Box-and-whiskers plot and statistics of Ehi-E23 values for the three places of articulation ... 65 Figure 3-11 : Box-and-whiskers plot and statistics of VOT values for the three places of articulation ... 66 Figure 3-12 : Box-and-whiskers plot and statistics of VOT values for ‘b’, ‘d’ and ‘g’ ... 68 Figure 3-13 : Box-and-whiskers plot and statistics of VOT values for ‘p’, ‘t’ and ‘k’ .... 68
Figure 3-15 : Box-and-whiskers plot and statistics of F1o values for the three places of articulation ... 71 Figure 3-16 : Box-and-whiskers plot and statistics of F2o values for the three places of articulation ... 72 Figure 3-17 : Box-and-whiskers plot and statistics of F2o values where the vowels are front vowels for the three places of articulation ... 74 Figure 3-18 : Box-and-whiskers plot and statistics of F2o values where the vowels are back vowels for the three places of articulation... 74 Figure 3-19 : Box-and-whiskers plot and statistics of F2b values for the three places of articulation ... 75 Figure 3-20 : Box-and-whiskers plot and statistics of F3o values for the three places of articulation ... 77 Figure 3-21 : Box-and-whiskers plot and statistics of F3b values for the three places of articulation ... 78 Figure 3-22 : Box-and-whiskers plot and statistics of dF2 values for the three places of articulation ... 80 Figure 3-23 : Box-and-whiskers plot and statistics of dF2 values where the vowels are front vowels for the three places of articulation ... 81 Figure 3-24 : Box-and-whiskers plot and statistics of dF2 values where the vowels are back vowels for the three places of articulation... 81 Figure 3-25 : Box-and-whiskers plot and statistics of dF2b values for the three places of articulation ... 83 Figure 3-26 : Box-and-whiskers plot and statistics of dF3 values for the three places of articulation ... 84 Figure 3-27: Box-and-whiskers plot and statistics of dF3b values for the three places of articulation ... 85 Figure 3-28 : Box-and-whiskers plot and statistics of F3o-F2o values for the three places of articulation ... 87 Figure 3-29 : Box-and-whiskers plot and statistics of F3b-F2b values for the three places of articulation ... 88 Figure 3-30: Box-and-whiskers plot and statistics of cgF10a values for the three places of articulation ... 90 Figure 3-31: Box-and-whiskers plot and statistics of cgF20a values for the three places of articulation ... 91 Figure 3-32: Box-and-whiskers plot and statistics of cgFa values for the three places of articulation ... 92 Figure 3-33: Comparison between the F-ratios and the ML classification error probabilities, P(err), of all of the acoustic attributes. Note that, the ML classification error probabilities are plotted in the form of 1-P(err). Both are scaled so that the maximal values are at 100%, while the minimal values are at 0%... 96 Figure 4-1: Valid acoustic attribute subsets. Valid subsets are constructed from combining four smaller subsets, one from each group (column). {Common subset} is always used as the subset from the first column. Either {Av3-A3} or {Av2-A2} must be picked from the second column due to their high correlation. The subsets listed in the third column are all of the possible combinations among cgFa, cgF10a, and cgF20a. In the last column, the listed subsets are all of the possible
combinations among F2o, F2b, F3o, F3b, F3o-F2o, and F3b-F2b in which none of the acoustic attributes are linear combinations of any other acoustic attributes in the same subset and the information about a formant frequency at a certain time point is used once... 103 Figure 4-2: Classification accuracy percentage of the place of articulation of stop consonants with release bursts using the combined classifiers under the product rule and the sum rule, when the weight used for the posterior probability obtained from the VC classifier varies from 0 to 1 ... 124 Figure 4-3: Classification accuracy percentage of the place of articulation of stop consonants using the combined classifiers under the product rule and the sum rule, when the weight used for the posterior probability obtained from the VC classifier varies from 0 to 1. The information about release bursts is not used. ... 127 Figure 4-4: Place of articulation classification process for the qualified tokens in the SP database... 131 Figure 4-5: Distribution of the classification error ... 136 Figure 4-6: Histogram of the posterior probabilities corresponding to the hypothesized place of articulation. The top histogram shows the number of the correctly classified stop consonants in different probability ranges. The bottom histogram shows the number of the incorrectly classified stop consonants in different probability ranges. ... 138 Figure 4-7: Percentage of the correctly classified stop consonants in different probability ranges ... 138 Figure 5-1: Scatter plot of the two canonical variables for CV tokens from the ALL dataset ... 146 Figure 5-2: Scatter plot of the two canonical variables for VC tokens from the ALL dataset ... 150 Figure 6-1: Relationship between the classification accuracy of stops in the entire SP database and the classification accuracy of the excluded stops... 168 Figure 6-2: Spectrograms of an utterance transcribed as ‘Go get it at the bookstore-’ with no added noise (Top), and with 28dB Signal-to-Noise Ratio white noise (Bottom). ... 173 Figure 6-3: A scatter plot comparing the ML classification error probabilities based on Av-Ahi and Av-Amax23 for clean speech and for speech in different levels of white noise ... 174
List of Tables
Table 1-1: Feature values for the stop consonants in English ... 20 Table 3-1: Distribution of stop consonants in the SP database... 40 Table 3-2 : Comparison of the means of Av-Ahi between the front and back vowel cases
... 58 Table 3-3 : Comparison of the means of Ahi-A23 between the front and back vowel cases
... 59 Table 3-4 : Comparison of the means of Av-Amax23 between the front and back vowel cases ... 60 Table 3-5 : Comparison of the means of Avhi-Ahi between the front and back vowel cases ... 61 Table 3-6 : Comparison of the means of Av3-A3 between the front and back vowel cases
... 63 Table 3-7 : Comparison of the means of Av2-A2 between the front and back vowel cases
... 64 Table 3-8 : Comparison of the means of Ehi-E23 between the front and back vowel cases
... 65 Table 3-9 : Comparison of the means of VOT between the front and back vowel cases. 66 Table 3-10 : Comparison of the means of cls_dur between the front and back vowel cases
... 70 Table 3-11 : Comparison of the means of F1o between the front and back vowel cases. 71 Table 3-12 : Comparison of the means of F2o between the front and back vowel cases. 73 Table 3-13 : Comparison of the means of F2b between the front and back vowel cases. 75 Table 3-14 : Comparison of the means of F3o between the front and back vowel cases. 77 Table 3-15 : Comparison of the means of F3b between the front and back vowel cases. 78 Table 3-16 : Comparison of the means of dF2 between the front and back vowel cases. 80 Table 3-17 : Comparison of the means of dF2b between the front and back vowel cases83 Table 3-18 : Comparison of the means of dF3 between the front and back vowel cases. 84 Table 3-19 : Comparison of the means of dF3b between the front and back vowel cases85 Table 3-20 : Comparison of the means of F3o-F2o between the front and back vowel cases ... 87 Table 3-21 : Comparison of the means of F3b-F2b between the front and back vowel cases ... 88 Table 3-22: Comparison of the means of cgF10a between the front and back vowel cases
... 90 Table 3-23: Comparison of the means of cgF20a between the front and back vowel cases
... 91 Table 3-24: Comparison of the means of cgFa between the front and back vowel cases 92 Table 3-25: normalized F-ratios of every acoustic attribute, sorted in descending order. 95 Table 3-26: Maximum likelihood classification error of every acoustic attribute, sorted in ascending order ... 95 Table 3-27: Highly correlated attribute pairs ( 2 > 0.80) across different CV contexts ... 97 Table 3-28: Highly correlated attribute pairs ( 2 > 0.80) across different VC contexts ... 97
Table 4-1: Attribute subsets yielding the best CV token classification results in their corresponding vowel and voicing contexts. Common attribute subset consists of Av-Ahi, Ahi-A23, Av-Amax23, Avhi-Av-Ahi, Ehi-E23, vot, F1o, dF2, dF3, dF2b, dF3b 108 Table 4-2: Confusion matrices of the best CV token classification in different vowel and voicing contexts. The attribute subset used in each context is shown in the above table... 108 Table 4-3: Attribute subsets yielding the best VC token classification results in their corresponding vowel and voicing contexts. Common attribute subset consists of Av-Ahi, Ahi-A23, Av-Amax23, Avhi-Av-Ahi, Ehi-E23, cls_dur, F1o, dF2, dF3, dF2b, dF3b ... 109 Table 4-4: Confusion matrices of the best VC token classification in different vowel and voicing contexts. The attribute subset used in each context is shown in the above table... 109 Table 4-5: Confusion matrices of the best CV token classification in different vowel and voicing contexts where the attributes used are obtained from the information on formants only. The attribute subset used is ‘F1o’, ‘F2o’, ‘F3o’, ‘dF2’, and ‘dF3’. 111 Table 4-6: Confusion matrices of the best VC token classification in different vowel and voicing contexts where the attributes used are obtained from the information on formants only. The attribute subset used is ‘F1o’, ‘F2o’, ‘F3o’, ‘dF2’, and ‘dF3’. 111 Table 4-7: Classification accuracies in the specific training case and the
context-free training case for CV tokens across all voicing and frontness contexts... 113 Table 4-8: Comparison between the classification accuracies of CV tokens when some contexts are known and when they are not known. ... 113 Table 4-9: Classification accuracies in the specific training case and the
context-free training case for VC tokens across all voicing and frontness contexts... 114 Table 4-10: Comparison between the classification accuracies of VC tokens when some contexts are known and when they are not known. ... 115 Table 4-11: Confusion matrix of the place of articulation classification of CV tokens whose stop consonants also have adjacent vowels on the left side. The information about the release bursts is used. ... 118 Table 4-12: Confusion matrix of the place of articulation classification of VC tokens whose stop consonants also have adjacent vowels on the right side. The information about the release bursts is used. ... 118 Table 4-13: Confusion matrix of the place of articulation classification of CV tokens whose stop consonants also have adjacent vowels on the left side. Only the information about the formant structure of the vowels is used... 118 Table 4-14: Confusion matrix of the place of articulation classification of VC tokens whose stop consonants also have adjacent vowels on the right side. Only the information about the formant structure of the vowels is used... 119 Table 4-15: Confusion matrix from place of articulation classification of stops with release bursts that have vowels on both sides. The acoustic attributes on both sides of the stops, as well as the burst information, are used together in a single classification. ... 120 Table 4-16: Confusion matrix from place of articulation classification of stops that have vowels on both sides, where the burst information is not used. The acoustic
Table 4-17: Confusion matrix of the place of articulation classification of the same set as stop consonants used in the classifier-level combination experiment based on the information from the CV tokens. The information about the release bursts is used. ... 124 Table 4-18: Confusion matrix of the place of articulation classification of the same set as stop consonants used in the classifier-level combination experiment based on the information from the VC tokens. The information about the release bursts is used. ... 124 Table 4-19: Confusion matrix of the place of articulation classification using the classifier-level combination under the sum rule with the VC weight equals to 0.5 and the VC weight equals to 0.5. The information about the release bursts is used. .... 125 Table 4-20: Confusion matrix of the place of articulation classification using the classifier-level combination under the product rule with the VC weight equals to 0.4 and the VC weight equals to 0.6. The information about the release bursts is used. ... 125 Table 4-21: Confusion matrix of the place of articulation classification of the same set as stop consonants used in the classifier-level combination experiment based on the information from the CV tokens. The information about the release bursts is not used. ... 127 Table 4-22: Confusion matrix of the place of articulation classification of the same set as stop consonants used in the classifier-level combination experiment based on the information from the VC tokens. The information about the release bursts is not used. ... 127 Table 4-23: Confusion matrix of the place of articulation classification using the classifier-level combination under the sum rule with the VC weight equals to 0.475 and the VC weight equals to 0.525. The information about the release bursts is not used. ... 128 Table 4-24: Confusion matrix of the place of articulation classification using the classifier-level combination under the product rule with the VC weight equals to 0.375 and the VC weight equals to 0.625. The information about the release bursts is not used. ... 128 Table 4-25: % Classification accuracy comparison among different classification approaches... 130 Table 4-26: Confusion matrices from the place of articulation classification of the stop consonants in the SP database that have vowels on both sides. The stop consonants in (a) contain the release burst, while in (b) they do not. The confusion matrix in (c) is the combination of the results from (a) and (b)... 133 Table 4-27: Confusion matrices from the place of articulation classification of the stop consonants in the SP database that have vowels on their right sides only. The stop consonants in (a) contain the release burst, while in (b) they do not. The confusion matrix in (c) is the combination of the results from (a) and (b)... 134 Table 4-28: Confusion matrices from the place of articulation classification of the stop consonants in the SP database that have vowels on their left sides only. The stop consonants in (a) contain the release burst, while in (b) they do not. The confusion matrix in (c) is the combination of the results from (a) and (b)... 134
Table 4-29: Confusion matrices from the place of articulation classification of the stop consonants in the SP database. The stop consonants in (a) contain the release burst, while in (b) they do not. The confusion matrix in (c) is the combination of the results from (a) and (b)... 135 Table 5-1: Confusion matrix based on using the two canonical variables obtained from LDA to classify the place of articulation of CV tokens from the ALL dataset ... 147 Table 5-2: Standardized coefficients for the 1st and the 2nd discriminant functions with respect the acoustic attributes used for classifying CV tokens in the ALL dataset 147 Table 5-3: Eigenvalues and dispersion percentages explained by the two discriminant functions for the CV tokens in the ALL dataset ... 147 Table 5-4: Contributions to the 1st, the 2nd discriminant function, and the overall discrimination among the three places of articulation of the acoustic attributes used for the CV tokens in the ALL dataset ... 148 Table 5-5: Confusion matrix based on using the two canonical variables obtained from LDA to classify the place of articulation of VC tokens from the ALL dataset ... 150 Table 5-6: Standardized coefficients for the 1st and the 2nd discriminant functions with respect the acoustic attributes used for classifying VC tokens in the ALL dataset 151 Table 5-7: Eigenvalues and dispersion percentages explained by the two discriminant functions for the VC tokens in the ALL dataset ... 151 Table 5-8: Contributions to the 1st, the 2nd discriminant function, and the overall discrimination among the three places of articulation of the acoustic attributes used for the VC tokens in the ALL dataset ... 151 Table 5-9: The overall contribution to the total separation of the acoustic attributes used for CV tokens in (a) the V dataset and (b) the U dataset ... 153 Table 5-10: The overall contribution to the total separation of the acoustic attributes used for CV tokens in (a) the F dataset and (b) the B dataset ... 154 Table 5-11: The overall contribution to the total separation of the acoustic attributes used for VC tokens in (a) the V dataset and (b) the U dataset ... 155 Table 5-12: The overall contribution to the total separation of the acoustic attributes used for VC tokens in (a) the F dataset and (b) the B dataset ... 156
Chapter 1
Introduction
1.1 Motivation
The problem of automatic speech recognition has been approached by researchers in various ways. One of the most prevalent methods is a statistical method in which speech recognizers learn the patterns of the speech units expected in incoming utterances from some sets of examples and then try to match the incoming speech units with the patterns learned. Different choices of units of speech that are used to represent sounds in the incoming utterance have been examined [Davis and Mermelstein, 1980] [Jankowski, Hoang-Doan, and Lippman, 1995]. These representations include MFCCs, LPCs, wavelets [Malbos, Baudry, and Montresor, 1994], and other spectral-based representations [Kingsbury, Morgan, and Greenberg, 1998] [Hermansky, and Morgan, 1994]. This approach to automatic speech recognition does not use much knowledge of human speech production, and the performance of the recognizer relies heavily on the training examples. The recognition performance is robust when the recognizer tries to match the sounds that are presented for a sufficient number of times in the training examples. However, it is problematic for the case where examples of some sounds are too sparse. The recognition performance also depends on the operating environment, such as background noise, types of microphones and types of channels. It does not perform well unless the operating environment matches one of the training examples.
These problems can be overcome by avoiding learning of the patterns of the chosen speech units, which explicitly represent acoustic signals derived from the training examples. Instead, one could embed the knowledge about human speech production directly into the recognizer by choosing the speech units that reflect how the sounds are produced. Despite a great deal of variability in the surface acoustic speech signal, it is believed that, by uncovering the information on the vocal source and the movement of
Observing temporal and spectral cues, a trained spectrogram reader can identify the underlying words from the acoustic speech signals with a remarkable accuracy [Zue and Cole, 1979]. This tempts researchers to try to find these acoustic cues and incorporate them into automatic speech recognition systems. However, up to now there have been no major successes in this approach to automatic speech recognition in terms of the recognition accuracy relative to the use of traditional statistical methods. The reason is that although this field of research has been studied for decades, we still have insufficient understanding about human speech production and perception.
Stop consonants represent one of the various classes of sounds in human speech. In English, there are six stop consonants, namely ‘b’, ‘d’, ‘g’, ‘p’, ‘t’, and ‘k’. Two things need to be known in order to uniquely identify the six English stop consonants. One is the voicing during their closure intervals and the other one is the articulators that make the constrictions, in other words the places of articulation of those stop consonants. In general spectrogram reading, given that the location of a stop consonant in an acoustic speech signal has already been identified, a reader will try to find any cues that will lead to the presence or lack of voicing and the place of articulation. For a machine to do such a task, the same method should be implemented. Thus, place of articulation classification is an important task that must to be solved in order to develop a module responsible for identifying stop consonants. The task is difficult since the acoustic properties of these consonants change abruptly during the course of their production. Due to the abrupt nature of stop consonants, traditional statistical methods do not classify them well without the assistance of semantic information. Also, more studies of the acoustic cues for identifying place of articulation are needed for the knowledge-based approach. The proper selection of cues clearly contributes to the recognition performance. So, the combination of cues selected should be studied in detail. Furthermore, the cues should be meaningful in the sense that they should be related to human speech production theory. If successful, the knowledge-based speech recognition system will be more robust to change in operating environment and phonological variations than the traditional speech recognizer, since the knowledge-based system does not simply match the surface signal
but tries to uncover the information that is not influenced by those variations. Also, the knowledge gained in developing the system should enhance our understanding of human speech production and perception, which in turn provides us with more understanding of how to approach other human articulatory and auditory problems such as speaking and hearing disorders.
1.2 Distinctive feature-based Speech Recognition System
Explicitly embedding the knowledge about the human articulatory and auditory system in the recognizer can be done by choosing meaningful speech units. Our choice of the speech unit is the discrete phonological unit called the distinctive feature. Certain combinations of such distinctive features, called feature bundles, can contrast all of the sounds in human speech. These distinctive features are universal for all languages but different subsets of them are used to distinguish sounds in different languages. There are about 20 such distinctive features in English, and each distinctive feature is specified by a binary value. More details on distinctive features can be found in [Stevens, 1998]. In a distinctive feature-based system, analog acoustic signals are mapped to sequences of bundles of distinctive features, representing sequences of various types of sounds, and these feature bundles are further processed in the system. This choice of speech unit is based on the assumption that words are stored in memory as sequences of discrete segments and each segment is represented by a set of distinctive features [Jakobson, Fant, and Halle, 1967] [Chomsky and Halle, 1968] [Stevens, 1972] [Stevens, 2002].
The binary values of the distinctive features describing the six stop consonants in English are shown in Table 1-1 below. The first two feature values, which are [-vocalic] and [+consonantal], identify that the sounds are consonants. The next two feature values, which are [-continuant] and [-sonorant], separate stop consonants from other kinds of consonants, i.e. nasals and fricatives. English voiced stops have spread glottis] and [-stiff vocal folds] while the unvoiced ones have [+spread glottis] and [+[-stiff vocal folds]. The place of articulation of a stop consonant is specified by assigning [+] value to one of
the corresponding place features, i.e. [+lips] for a labial stop, [+tongue blade] for an alveolar stop, and [+tongue body] for a velar stop.
When a human produces speech, sets of features are prepared in memory and then implemented using the articulators. Features are defined in terms of the articulatory gestures that produce the sound and the distinctive auditory and acoustic result of these gestures. Listeners are only exposed to the acoustic signal, resulting from the movement of the speaker’s articulators, not the intended articulator movements or the underlying features. So, the task for recognizing the speech signal is generally to extract the underlying features from acoustic cues contained in the signal.
Feature P t k b d g Vocalic - - - - Consonantal + + + + + + Continuant - - - - Sonorant - - - - Lips + + Tongue Blade + + Tongue Body + + Spread Glottis + + + - - -
Stiff Vocal Folds + + + - - -
Table 1-1: Feature values for the stop consonants in English
1.3 An Approach to Distinctive Feature-based speech
recognition
This section explains the approach to the distinctive feature-based speech recognition system, which is proposed by the Speech Communication Group in the Research Laboratory of Electronics at MIT and in which the study of place of articulation classification for stop consonants in this thesis will be incorporated. The broad idea of how the approach can be used to uncover the underlying words from the acoustic signal is illustrated in Figure 1-1, which is elaborated below. Generally, the process can be thought of as consisting of 4 major tasks, 1) landmark detection [Liu, 1995] [Sun, 1996] [Howitt, 2000], 2) organization of landmarks into bundles of features, or segments, 3)
distinctive feature extraction [Choi, 1999] [Chen, 2000] and 4) lexical access, as in Figure 1-21.
Figure 1-1: Distinctive feature-based approach for representing words from analog acoustic signal
Figure 1-2: Illustration of an approach to distinctive feature-based speech recognition system
1 This figure shows the sequence of steps that are fundamental to the approach. It is intended for helping
Landmarks
Segmentation Acoustic speech signal
+ + - - - + + + + Distinctive feature bundles Words Landmark Detection Segmentation Distinctive Feature Extraction Lexical Access Word Signal
The first step is detecting the landmarks, which provide evidence for underlying segments, each of which can be fully specified by a feature bundle. There are four types of landmarks. The first one is called Abrupt-Consonantal (AC) that appears when there is an abrupt change in spectral shape involving the production of an underlying consonantal segment. When a constriction is made in the production of a consonant, an AC landmark occurs and after that when the constriction is released, before the start of the following non-consonantal segment, another AC landmark occurs. These two AC landmarks are called outer AC landmarks. There can be extra intraconsonantal AC landmarks between two outer AC landmarks in the case where this pair of outer AC landmarks involve the constriction and the release of different primary articulators, like the case of a consonant cluster. At the place where an abrupt change is caused by glottal or velopharyngeal activities without any major activities of primary articulators, an Abrupt (A) landmark can take place. An A landmark can be either intervocalic when it is located outside a pair of AC landmarks or intraconsonantal when it is located inside a pair of AC landmarks. When there is a constriction in the production of a semi-vowel, the constriction is not narrow enough to cause an abrupt change and this produces a non-abrupt (N) landmark. This type of landmark can only occur outside a pair of AC landmarks. The last type of landmark corresponds to the production of vowels. It is called vowel (V) landmark, which occurs when there is a local maximum in the amplitude of the acoustic signal and there is no narrow constriction involved.
After the landmarks are found, the system goes into the segmentation process. In this step, the system attempts to interpret the landmark sequences and tries to identify the possible sequences of the underlying segments, which are usually not fully specified at this state. For example, given that an ideal landmark detection and an ideal segmentation is done on the word /s ih t/, the system will propose the segment sequence that appears as ‘[a fricative segment] [a vowel segment] [a stop segment]’ without specifying the places for the two consonants and the quality of the vowel. Specialized detectors are used to find some relevant articulator-free features, i.e. features specifying the general manner of each segment without telling specific information on the primary articulator or the quality of
that segment, in order to classify the segments into broad classes, including stops, nasals, fricatives, affricates, vowels and glides.
In general, outer AC landmarks relate to the closure or the release of stop consonants, fricatives, flaps, nasals and [l] next to non-consonantal segments. Intraconsonantal AC landmarks and intraconsonantal A landmarks relate to consonant clusters, while intervocalic A landmarks correspond to the onset and offset of glottal stops and aspiration in consonants. Finally, a vowel segment occurs at the location of a V landmark. The mappings between landmarks and segments are sometimes 1-to-1, such as a V landmark which corresponds to a vowel segment, but sometimes are not 1-to-1, such as a pair of AC landmarks which correspond to a fricative or stop segment and three AC landmarks which correspond to an affricate consonant segment.
In the vicinity of the landmarks, after the segments are classified, articulator-bound features, i.e. features specifying the place of the primary articulator or the quality of that segment need to be found. For example, if a segment is found to be a stop consonant segment, one of the features [lips], [tongue blade], and [tongue body] need to be assigned a [+] value in order to specify that stop’s place of articulation. Also the values of some other features need to be found in order to specify whether it is a voiced or voiceless stop. Specialized modules, responsible for filling in the binary value of each feature, are deployed in order to measure acoustic parameters from the signal and consequently interpret them into cues that help to decide the values of the features. At this point, the feature bundles are fully specified, i.e. all of the features needed in the bundles are given either [+] or [-] values, unless noise or other distortion prevents some feature to be estimated with confidence.
In the last step before the recognizer proposes the hypothesized words, it requires the mapping from sequences of distinctive feature bundles, or fully specified segments, to words. For a single-word recognition task, this step can be done simply by searching in the word repository for the word whose underlying segments match the proposed
to propose the possible word boundaries. In other words, the system needs to decide which bundles should be grouped together into the same words. In order to make the grouping decision, some linguistic constraints can be utilized. For example, one might prevent word boundaries that produce sound clusters that do not exist in English. Furthermore, semantic and syntactic constraints can also be used in making the decision. For example, one might prefer word sequences that produce syntactically correct and meaningful sentences to the ones that produce badly structured or meaningless sentences. Finally, the feature bundles between a pair of word boundaries can be mapped directly to a word in the same fashion as in the single-word recognition task.
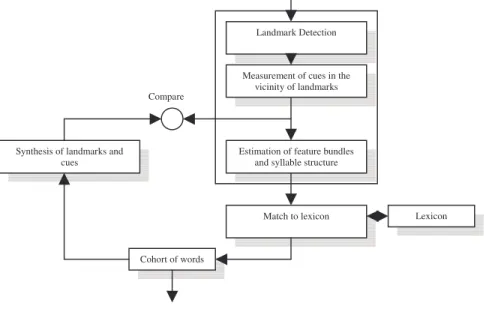
A more complex system that should resemble more closely the human speech recognition process, as well as yield better recognition performance by a machine, could be achieved by adding a feedback path. Such a path allows a comparison of real acoustic measurements from input speech signals with the acoustic measurements made on synthetic speech that is synthesized from the hypothesized landmarks and cues. Such an approach is illustrated in Figure 1-3. More details are not in the scope of this thesis, and can be found in [Stevens, 2002].
Figure 1-3: A diagram for a distinctive feature-based speech recognition system with the feedback path. (After Stevens, 2002)
Landmark Detection Measurement of cues in the
vicinity of landmarks Estimation of feature bundles
and syllable structure Match to lexicon Synthesis of landmarks and
cues
Cohort of words
Lexicon Compare
1.4 Literature Review
For several decades, different researchers have studied the acoustic cues that affect human discriminating ability for place of articulation for stop consonants. In most research, acoustic information in the speech signal in the interval following the release as well as the context leading to the stop consonant was utilized in classification experiments. As early as 1955, Delattre, Liberman and Cooper [1955] suggested that the second formant (F2) transition was sufficient in discriminating among the three places of articulation. According to the proposed locus theory, the F2 pattern was context-dependent and it pointed to a virtual locus at a particular frequency for each place of articulation. However, only the F2 transition for /d/ was shown to have such behavior. While Delattre et al. looked at formant transitions, Winitz, Scheib, and Reeds [1972] picked the burst as cues for a listener to discriminate among /p/, /t/ and /k/ instead of formant transitions.
Zue [1979] studied various aspects of temporal characteristics of stops, VOT duration of frication and aspiration, and spectral characteristics, such as frequency distribution in the burst spectrum. He suggested the presence of context-independent acoustic properties. However, the exact nature of the acoustic invariance remained unclear and needed further study. Blumstein and Stevens [1979] provided strong support for acoustic invariance. They suggested that cues for place of articulation could be perceived by a static snapshot of the acoustic spectrum near the consonant release. 80% place of articulation classification accuracy was achieved using a short-time spectrum in the interval of 10-20 ms after the release. Searle, Jacobson, and Rayment [1979] utilized spectral information by using features extracted from the spectral displays processed by one-third octave filters. Their experiment gave 77% classification accuracy. Kewley-Port [1983] claimed that in some cases using the static snapshot was sufficient in classification but in many cases it did not provide enough information. Instead, she experimented using time-varying spectral properties in the beginning interval of 20-40 ms in consonant-vowel syllables. These time-varying properties included spectral tilt of the burst, the existence of a mid-frequency peak sustained at least 20ms, and a delayed F1 onset value.
Most of the later work was conducted based on the cues suggested in the earlier publications. The studies were more focused on experimenting on one or a small set of related cues or using combinations of various cues to achieve the best classification accuracy. Repp [1989] focused on studying the stop burst and suggested that using only the initial transient of the release burst was not worse than using the entire burst to identify stop consonant place of articulation. For this purpose, equivalent information was stored in the initial transient and the release burst. Alwan [1992] performed identification tests with synthetic Consonant-Vowel utterances in noise to study the importance of the F2 trajectory and found that the shape of F2 trajectory was sufficient for discriminating /ba/ and /da/, but when the F2 transition in C/a/ was masked, listeners perceived it as flat formant transition, i.e. /da/ was perceived as /ba/. When the F2 trajectory was masked, then the amplitude difference between frequency regions could be used. The importance of F2 in stop consonant classification was also emphasized in the work of Foote, Mashao, and Silverman [1993]. An algorithm called DESA-1 was used in order to obtain information about the rapid F2 variations of the stop consonants in pseudo-words. The information was used successfully in classification of place of articulation. Nossair and Zahorian [1991] compared the classification accuracies between using attributes describing the shape of the burst spectra and attributes describing the formant movement of CV tokens. They found that the former ones were superior in classifying stop consonants.
Bonneau, Djezzar, and Laprie [1996] performed a perceptual test in order to study the role of spectral characteristics of the release burst in place of articulation identification without the help of VOT or formant transition. It was found that, when listeners were trained in two necessary training sessions, the recognition rates were fairly high for the French /p/, /t/, and /k/ in CV contexts. Still, they suggested that the knowledge of the subsequent vowel might help the stop identification.
Some of the more recent experiments that showed the potential of using combinations of acoustic attributes to classify stop consonant place of articulation were from Johnson [1996], Stevens, Manuel and Matthies [1999] and Ali [2001].
Hasegawa-Johnson categorized relevant contexts into 36 groups, including all possible combinations of speaker’s gender (male and female) and 18 right-hand (following) contexts, and performed context-dependent place classifications using manually measured formant and burst measurements. It was shown that when the formant measurements and the burst measurements were used in combination for place classification, the classification accuracy was 84%, which was better than using either the burst or the formant measurements alone. Also, he observed that the presence of either retroflex or lateral context on the right of stop consonants degraded place classification that was based on formant measurements. Stevens, Manuel and Matthies also showed that combining cues from bursts and formant transitions led to robust place of articulation classification especially when gender and the [back] feature of the following vowels were known. Experiments were performed on stop consonants in 100 read sentences. Syllable-initial consonants in various vowel environments were classified using various cues, which were hand measurements of F1 and F2 at vowel onset, the difference in frequency between F2 at vowel onset and 20 ms later, relative amplitudes between different frequency ranges within the burst spectrum as well as the amplitudes of the burst spectrum in different frequency ranges in relation to the amplitude of the following vowel. Discriminant analyses using these cues yielded 85% classification accuracy across all vowels. Ali also utilized combinations of acoustic attributes to classify stop consonants. An auditory front-end was used to process the speech signal before the attributes were extracted. The classification was based on decision trees with hard thresholds. It was pointed out that the single most important cue for such classification was the burst frequency, i.e. the most prominent peak in the synchrony output of the burst. Along with the burst frequency, F2 of the following vowel and the formant transitions before and after the burst were taken into consideration although it was found that formant transitions were secondary in the presence of the burst. Maximum normalized spectral slope was used to determine spectral flatness and compactness while voicing decision was used to determine the hard threshold values. 90% overall classification accuracy was achieved
Chen and Alwan [2000] used acoustic attributes, including some of the acoustic attributes suggested in [Stevens, Manuel and Matthies, 1999], individually to classify the place of articulation of stop consonants spoken in CV context. Those acoustic attributes can be categorized into two groups, including acoustic attributes derived from noise measurements, e.g. frication and aspiration noise after the release burst, and from formant frequency measurements. Along with the information used in the acoustic attributes suggested by [Stevens, Manuel and Matthies, 1999], the spectral information of the release burst in the F4-F5 region and the information on the third formant frequency were also used. Their results showed that the noise measurements were more reliable than the formant frequency measurements. The amplitude of noise at high frequency relative to the amplitude of the spectrum at the vowel onset in at F1 resulted in 81% classification accuracy in three vowel contexts. However, there was no single attribute that can cue place of articulation in all of the vowel contexts.
Stop consonant place of articulation classification based on spectral representations of the surface acoustic waveform was shown to be more successful than the knowledge-based attempt. Halberstadt [1998] reported that the lowest classification error among various systems found in the literature, using a similar database (TIMIT), was achieved by using a committee-based technique. In such a technique, the decision about the place of articulation was made from the voting among several classifiers with heterogeneous spectral-based measurements. The lowest classification error reported was 3.8%. Halberstadt [1998] also performed a perceptual experiment on stop consonant place of articulation classification. Subjects were asked to identify the place of articulation of the stops in the center of three-segment speech portion extracted from conversational utterances. It was found that human subjects made 6.3% error rate on average, and 2.2% error rate by the voting of seven listeners. The average error rate could be viewed as the level that machine classifications of stop place should try to achieve, if they were to perform at the human level.
1.5 Thesis Goals
Many of the previous works mentioned suggested places in the acoustic signal where one should look for cues for place of articulation classification for stop consonants, while the results obtained from the last three strongly suggested the use of acoustic attribute combinations as invariant acoustic cues for such a classification task. Despite these studies, the appropriate combination of cues remained unclear. Not much effort has been spent on studying the acoustic attributes used in the classification task in more detail, such as their contributions to the classification result and the dependencies among the attributes.
And, despite some outstanding results in the classification of stop consonant place of articulation using spectral-based representations [Halberstadt, 1998], this thesis will be restricted to the study of acoustic cues that are chosen in a knowledge-based fashion. The purpose of this research is to select a set of reasonable acoustic attributes for the stop consonant place of articulation classification task based on human speech production knowledge. The introduction of some of the acoustic attributes studied in this thesis will be based on the results collectively found in the previous works mentioned above. Some of the acoustic attributes are new to the literature and are evaluated in this thesis. Their discriminating properties across the three places of articulation and their correlations will be evaluated and utilized in the place classification experiments in various voicing and adjacent vowel contexts. Attention will also be paid to using these acoustic attributes as the basic units for a stop consonant classification module, which is one of the modules to be developed as part of our research group’s distinctive feature-based automatic speech recognizer.
1.6 Thesis Outline
The overview of human stop consonant production based on the simple tube model is provided in Chapter 2 of this thesis. This chapter describes the articulatory movements
when stop consonants with three different places of articulation are produced, along with the acoustic cues in the surface acoustic signal that reflect such movements.
Chapter 3 introduces a set of acoustic attributes that are the focus of this study. This set of acoustic attributes is chosen in order to capture the acoustic cues that are useful in the stop consonant place of articulation classification based on the production theory discussed in Chapter 2. Common methods used throughout this thesis for obtaining the acoustic attributes as well as the database used are also discussed in this chapter. Results from statistical analyses on the values of each of these acoustic attributes are shown. The abilities of the individual acoustic attributes in separating the three places of articulation are compared. Furthermore, correlation analysis is conducted and the acoustic attributes with possible redundant information are identified.
In Chapter 4, subsets of the acoustic attributes introduced in the previous chapter are used for real classification experiments. Some contexts, including the presence of the release bursts, the voicing of the stop consonants, and the frontness of the associated vowels, are taken into account in these classification experiments. The ability of our combinations of the acoustic attributes for place classification is then evaluated on the stop consonants in the entire database.
Chapter 5 concerns discriminant analyses of our combinations of acoustic attributes. This chapter points out the level of contribution of each acoustic attribute provided to the place of articulation classification in various contexts.
The final chapter summarizes this thesis in terms of its focus, the procedures used, and the findings, and also provides a discussion on some of the interesting results obtained from the experiments and analyses in this thesis. Assessment of the classification accuracies obtained using our combinations of acoustic attributes along with ideas for future work are also included in this final chapter.
Chapter 2
Acoustic Properties of Stop Consonants
The purpose of this chapter is to provide some basic knowledge on human production of stop consonants. The articulatory mechanism that a person uses to utter the sound of a stop consonant is described in the first section. The mechanism is translated into the source and filter viewpoint, which is used in order to explain acoustic events reflected in acoustic speech waveform as well as its frequency domain representation. In later sections, the three types of stop consonant used in English, including labial, alveolar, and velar stop consonants, are contrasted in terms of the characteristics of some acoustic events expected to be useful in discriminate among the three types. Differences between aspirated and unaspirated stop consonants in relation to our attempt to discriminate among the three types of stop consonants are also noted.
2.1 The Production of Stop Consonants
The human speech production process can be viewed as consisting of two major components. One is the source that generates airflow. The other is the path the air flows through. The source of airflow is simply the lungs, while the path is formed by the trachea, larynx, pharynx, oral cavity and nasal cavity. While the air flows from the lungs and passes through the lips and the nose, the shape of the path is dynamically controlled by the movement of various articulators along its length, such as glottis, velum, tongue and lips.
In English, a stop consonant is uttered by using one primary articulator, an articulator in the oral cavity, to form a complete closure in the oral region of the vocal tract while maintaining the pressure in the lungs. Due to the blockage of the airflow, the pressure behind the constriction increases until it approaches the sub-glottal pressure level. This results in the termination or inhibition of the glottal airflow. Then the closure is released
noise is generated at the constriction due to the rapid moving of the air through the small opening. This airflow generated by the noise is referred to as the burst at the release. If the stop consonant is immediately followed by a vowel, the glottis will start vibrating again in order to utter the vowel. The time interval, starting from the moment of the release until the start of the glottal vibration, is referred to as the voice onset time (VOT). For an aspirated stop consonant, the glottis remains spread after the release and lets the air flow upward through it causing the noise, similar to the one generating the burst but usually exciting the whole length of the vocal tract. The noise generated by turbulence in the glottal airflow is referred to as aspiration noise.
The way these articulators are manipulated during the production of a stop consonant reflects on the corresponding acoustic signal. The process can be explained from the spectrogram of the utterance / g ae g/ in Figure 2-1, as an example. In the region marked by (1), complete closure, formed by the tongue body and the hard palate, causes the reduction in high frequency energy. Only low frequency energy can radiate outside through the oral cavity wall. Next, in (2), the closure is released and rapid airflow rushes through the small opening causing the release burst. The section of the vocal tract starting from the closure to the outside of the oral cavity is excited by turbulence noise. Finally, in (3), the vocal folds start vibrating again. The vocal tract moves from the shape at the time the closure was formed to the shape that will be used in articulating the following vowel, causing movement of the formants.
In English, three primary articulators, which are lips, tongue blade and tongue body, are used to produce different stop consonants. For labial stop consonants, the closure is formed by the lips. For alveolar stop consonants, the closure is formed by the tongue blade and the alveolar ridge, while the tongue body and the soft palate, or the posterior portion of the hard palate, form the closure for velar stop consonants. Evidence for the three different locations of the closures of stop consonants in VCV context, e.g. /aa b aa/, can be seen temporally and spectrally in the acoustic signal as described in the following sections.
Figure 2-1: A spectrogram of the utterance / g ae g/. The movement of the articulators that is reflected in the acoustic signal in the area marked (1), (2) and (3) is explained in the text above.
2.2 Unaspirated Labial Stop Consonants
When an unaspirated labial stop consonant, i.e. a /b/ or an unaspirated /p/, is followed by a vowel, the tongue body position corresponding to that vowel is close to being in place already at the time of the closure release. So the formant movement following the release depends, to some extent, on the following vowel, and the major part of the F2 transition is caused by the motion of the lips and jaw rather than the movement of the tongue body (except as the tongue body rests on the mandible). By modeling the human vocal tract based on the resonance of concatenated uniform tube model, it has been found that progressing from labial release to a back vowel, F1 rises rapidly while there is a small upward movement in F2. F1 rises in the same fashion in the context of front vowel, but
burst is roughly the spectrum of the noise with smooth spectral shape (as modified by the radiation characteristic), without being filtered by any transfer functions. Similarly, when the stop is preceded by a vowel, the formant movement looks like a mirror image of the former case. Examples of spectrograms showing the formant movements for a front vowel and a back vowel surrounded by labial stops are shown in Figure 2-2 (a) and (b) respectively.
2.3 Unaspirated Alveolar Stop Consonants
The stop consonants that belong to this category are /d/ and unaspirated /t/. In order for a speaker to make the constriction between the tongue blade and the alveolar ridge, the tongue body is placed in a rather forward position. Such a configuration has an F2 that is a little higher than F2 of the neutral vocal tract configuration. Progressing from the release of an alveolar stop consonant to a back vowel, F2 decreases due to the backward movement of the tongue body to produce a back vowel. In the case of an alveolar stop followed by a front vowel, the tongue body at the constriction generally moves slightly forward into the position of the front vowel, resulting in the increasing of F2. For both types of following vowels, F1 increases due to the tongue body’s downward movement. Furthermore, the constriction at the alveolar ridge forms a short front cavity with high resonance frequency, resulting in a burst spectrum with energy concentrating more in the high frequency region when the cavity is excited by the frication noise. Examples of the spectrograms showing the formant movements of a front vowel and a back vowel surrounded by alveolar stops are shown in Figure 2-2 (c) and (d) respectively.
2.4 Unaspirated Velar Stop Consonants
The stop consonants that belong to this category are /g/ and unaspirated /k/. The constriction made by the tongue body and the soft palate or the posterior potion of the hard palate makes F2 and F3 relatively close together in the burst compared with the spacing between F2 and F3 of the uniform vocal tract. The position of the constriction depends a lot on the vowel context, but in general the vocal tract configuration for the
velar constriction has a high F2. For a back vowel, the convergence of F2 and F3 is lower than in the case of a front vowel. For most vowels, F2 typically goes down when moving from the velar stop release into the following vowel. However, for some cases in which the following vowels have very high F2, e.g. for /iy/, F2 moves upward to reach F2 of the following vowel. At the closure, F1 is low since the tongue body is in a high position to make the constriction. Then, it moves upward as the tongue body is lowered when progressing towards the vowel region. The movement of the formant is not as rapid as the ones in the alveolar and labial cases, since there is a greater length of constriction for velar stops. Figure 2-2 (e) and (f) show spectrograms of the utterances /g aa g/ and /g iy g/ respectively. An example of the case in which F2 moves downward from a velar stop into a front vowel can be seen in Figure 2-1, which shows a spectrogram of the utterance / g ae g/.
Figure 2-2: Spectrograms of the utterances of (a) /b aa b/, (b) /b iy b/, (c) /d aa d/, (d) /d iy d/, (e) /g aa
g/, and (f) /g iy g/. (The horizontal axes in all plots show time in seconds)
(a) (b)
(c) (d)
2.5 Aspirated Stop Consonants
When aspirated stop consonants (i.e. the aspirated version of /p/, /t/, and /k/) are followed by vowels, aspiration noise appears immediately after the release burst and ends shortly after the vocal folds start vibrating again to produce the vowels. The glottis is open near the moment of oral cavity closure. The closure of the glottis is delayed following the release of the oral closure, and this is the main cause of this aspiration noise. This is different from the unaspirated case where the glottis remains in a more closed position at least following the release. As soon as the oral cavity closure opens, the pressure from the lungs drives the air to flow rapidly through the glottis opening, causing small rotating airflows that act as a noise source at the glottis. This noise source excites the vocal tract all the way from the point it is generated to the mouth opening. Consequently, though it is noisy, we can usually observe the formant structure and formant movement as the vocal tract moves from the stop to the configuration for the following vowel. The release bursts, like the ones in their unaspirated counterparts, are still generated in the same fashion, and are superimposed with the aspiration noise. Furthermore, the voice onset time (VOT) in aspirated stop consonants is typically longer than in unaspirated consonants.
2.6 Chapter Summary
In this chapter, the articulatory mechanism in human production of stop consonants was described along with the expected characteristics of some acoustic events based on the movements of articulators involved in the mechanism. Such characteristics are reflected in the surface acoustic signal in both the time and frequency domains, and they differ across stops with the three places of articulation. Acoustic attributes used for discriminating among the three places of articulation of stop consonants in this study were selected based on these differences. Such acoustic attributes will be introduced in the next chapter.
Chapter 3
Acoustic Attribute Analysis
In this chapter, various acoustic attributes that have potential for discriminating stop consonant place of articulation, based on the model of stop consonant production mentioned earlier, are introduced and investigated in detail. These acoustic attributes are chosen such that, at some level, they capture various properties of the surface acoustic signals that are useful for identifying places of articulation. These properties include the shape of the release burst spectrum, the movement of the formant frequencies into or out of adjacent vowels, the characteristic of aspiration noise after the stop release and some temporal measurements that reflect the timing of the articulators involved. The values of these acoustic measurements are believed to distribute in statistically different manners among different places of articulation. Thus, to know the nature of their distributions and to evaluate the discriminating capability of each acoustic attribute is essential for the development of the stop place of articulation module.
The inclusion of all of the acoustic attributes in this study was based solely on their potential for discriminating stop consonant place of articulation as indicated from the model of stop consonant production. Attempts were made to select a set of attributes that capture the information known to be useful to place of articulation identification, and which are feasible to measure automatically. The set of attributes selected was not guaranteed to be mutually exclusive in their discriminating property. In fact, the effects of some attributes were expected to be redundant. Also, some subsets of the attributes were experimental, e.g. some attributes were intended to be used to capture similar information but were measured in different time intervals. Thus, it is crucial to identify the correlation among each pair of the attributes and to prevent the correlation among the attributes to interfere with our analysis or to degrade the performance of the classification experiment to be conducted.