Publisher’s version / Version de l'éditeur:
Chemical Engineering Science, 50, 19, pp. 3105-3114, 1995-10
READ THESE TERMS AND CONDITIONS CAREFULLY BEFORE USING THIS WEBSITE. https://nrc-publications.canada.ca/eng/copyright
Vous avez des questions? Nous pouvons vous aider. Pour communiquer directement avec un auteur, consultez la première page de la revue dans laquelle son article a été publié afin de trouver ses coordonnées. Si vous n’arrivez pas à les repérer, communiquez avec nous à [email protected].
Questions? Contact the NRC Publications Archive team at
[email protected]. If you wish to email the authors directly, please see the first page of the publication for their contact information.
NRC Publications Archive
Archives des publications du CNRC
This publication could be one of several versions: author’s original, accepted manuscript or the publisher’s version. / La version de cette publication peut être l’une des suivantes : la version prépublication de l’auteur, la version acceptée du manuscrit ou la version de l’éditeur.
For the publisher’s version, please access the DOI link below./ Pour consulter la version de l’éditeur, utilisez le lien DOI ci-dessous.
https://doi.org/10.1016/0009-2509(95)00148-X
Access and use of this website and the material on it are subject to the Terms and Conditions set forth at
A pervaporation model : Membrane design
Tyagi, R. K.; Fouda, A. E.; Matsuura, T.
https://publications-cnrc.canada.ca/fra/droits
L’accès à ce site Web et l’utilisation de son contenu sont assujettis aux conditions présentées dans le site LISEZ CES CONDITIONS ATTENTIVEMENT AVANT D’UTILISER CE SITE WEB.
NRC Publications Record / Notice d'Archives des publications de CNRC:
https://nrc-publications.canada.ca/eng/view/object/?id=cfa4882f-a4a8-4b7f-8eac-b84746759bd7
https://publications-cnrc.canada.ca/fra/voir/objet/?id=cfa4882f-a4a8-4b7f-8eac-b84746759bd7
Pergamon
Chemical Engineering Science, Vol. 50, No. 19, pp. 3105-3114, 1995Copyright © 1995 Elsevier Science Ltd Printed in Great Britain. All rights reserved 0009-2509/95 $9.50 + 0.00
0009-2509(95)00148-4
A P E R V A P O R A T I O N M O D E L : M E M B R A N E D E S I G N
R. K. TYAGI, A. E. F O U D A t and T. MATSUURA*
Institute for Environmental Research and Technology, National Research Council, Ottawa, Canada KIA 0R6
(First received 9 December 1994; revised manuscript received and accepted 24 April 1995) Abstract--Theoretical penetrant concentration profiles under steady-state pervaporation conditions were generated using a newly developed transport model. The transport model assumes the presence of an imaginary phase (liquid or vapor) which is in thermodynamic equilibrium with the membrane phase. Theoretical profiles were compared with experimental concentration profiles. The calculation for the phase boundary between imaginary liquid and vapor phases was also performed using the transport model. The present work is the first theoretical work that can reconstruct penetrant profiles inside the membrane showing concentration polarization.
INTRODUCTION In the present study an attempt has been made to
Pervaporation transport is commonly described by compare experimental penetrant profile data with
a solution-diffusion model (Greenlaw et al., 1977; theoretical profiles.
Mulder et al., 1985; Neel, 1991), free volume model
(Huang et al., 1992) or a pore-flow model (Okada and THEORETICAL DEVELOPMENT
Matsuura, 1991). The solution-diffusion model does The salient features of the newly developed trans-
not consider phase boundary inside the membrane, port model are that it:
while the pore-flow model does. As early as 1961,
Binning et al. (1961) considered this phase change • Assumes the presence of an imaginary phase
within the membrane. (liquid or vapor) in equilibrium with the mem-
Although there are some studies concerning pene- brane phase.
trant profiles inside the membrane (Kim and Kam- • Considers the phase change of penetrant(s) in the
mermeyer, 1970; Mulder et al., 1985) a systematic imaginary phase.
study for binary mixtures has not been done. A corn- • Considers the pressure profile inside the mem-
prehensive study was undertaken to obtain experi- brane.
mental penetrant profiles inside the membrane under • Utilizes experimental sorption data from liquid
steady-state pervaporation condition (Tyagi et al., and vapor phases.
1992; Tyagi, 1993; Tyagi and Matsuura, 1994). • Assumes an isothermal condition across the
A transport model was developed to describe mass membrane.
transport during steady-state pervaporation (Tyagi et • Considers coupling in the liquid-transport re-
al., 1994). The mathematical equations obtained for gion of the membrane but does not consider
pure penetrant permeation are the same as those coupling in the vapor-transport region of the
derived by the pore-flow model (Okada and membrane.
Matsuura, 1991). Based on the analysis of a binary
mixture system, the possibility of a concentration po- The chemical potential gradient is considered to be
larization phenomenon occurring inside the mere- the driving force for the flow of the penetrant. A mem-
brane was pointed out. In the analysis of the binary brahe is split along the penetrant flow direction into
mixture system, coupling was considered in the small segments and the presence of an imaginary
liquid-transport region of the membrane but no coup- liquid (or vapor) phase which is in thermodynamic
ling was considered in the vapor-transport region of equilibrium with each membrane segment is assumed.
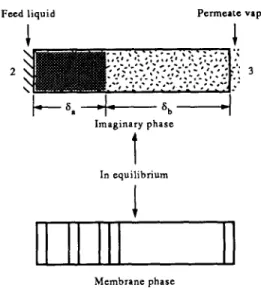
the membrane. The theoretical prediction of concen- A schematic diagram is shown in Fig. 1. The first
tration polarization occurring inside the membrane membrane segment is in sorption equilibrium with the
was substantiated by experimental data (Tyagi et al., feed liquid. Accordingly an imaginary phase is in
1992; Tyagi and Matsuura, 1995). sorption equilibrium with the penetrant in each seg-
ment. Such an imaginary phase should be liquid when
*Present address: IMRI, Department of Chemical Engin- the segment is closer to the liquid feed side. As one
eering, University of Ottawa, Ottawa, Canada KIN 6 N 5 . moves in the direction of penetrant flow, the pressure
* Corresponding author, and the composition of the imaginary liquid phase
NRCC No. 37593. should change gradually. At a point, where vapor
3106
R.K. TYAGI et al.
Feed liquid Permeate vapor
(Tyagi et al., 1994). The final mathematical expression
~
is as follows:
~
i
d = ~ ( p : _ p , ) + _ ~ ( , - P 2 )
A
B p2
(1)
2
3
I_
~
_ I
where A (mol/s m 2 Pa) and B (mol/s m 2 Pa 2) denote
I-
~, ~
8b
r l
liquid- and vapor-transport parameters involving sev-
Imaginary phase
eral physical quantities. P2, P , ,
P3and 5 are up-
l
stream pressure (Pa), saturated vapor pressure at the
phase boundary (Pa), downstream pressure (Pa) and
In equilibrium
total membrane thickness (m), respectively.
If liquid-transport and vapor-transport regions are
denoted by fa and fib, the transport equation for the
I I
I I
! 1 1
I I
PU~ttCOam/OfollntslOr
vapor penetration rate can be
B
2
Membr,ne phase
j = ~ ( p , _ p2).
(2)
Fig. 1. A schematic diagram of the transport model.
Therefore, vapor permeation rate equations for com-
ponents i and j can be written as follows:
pressure of the imaginary phase is no longer greater
Bi 2
than the vapor pressure of the penetrant, the imagi-
Ji = ~(Pi.
wp2
3)0)
nary phase would be in the vapor state. Therefore, as
far as the imaginary phase is concerned, there exists
Jr = B~t°2
2
a clear boundary between the liquid and vapor
5b~--j,,--Pj, 3).
(4)
phases. Adsorption equilibrium is established between
The variables used in the above equations are defined
the imaginary vapor phase and the penetrant in the
in the notation section. Subscripts • and 3 refer to the
membrane. When the transport takes place in the part
phase boundary and the downstream side, respec-
of the membrane that is in equilibrium with the imagi-
tively.
nary liquid phase, the transport is called hereafter
Rearranging eqs (3) and (4) yields
liquid transport. When the transport takes place in
Bi
2
the part of the membrane that is in equilibrium with
J~ = (f)(~-b/f)(P~,, - P~ 3)
(5)
the imaginary vapor phase, the transport is hereafter
called vapor transport.
Bs
2
Since the membrane phase is in equilibrium with
Js = (3)(~b/f)(PJ., - p 2 3).
(6)
the imaginary phase, #i(imaginary phase) =/t~ (mem-
brane phase) and ai(imaginary phase) = a~(membrane
Furthermore, the following equation is valid:
phase).
Mathematical equations were developed for pure
(~a 3b
component permeation. These equations resulted in
5- + 5- = 1.
(7)
the same as those developed using the pore-flow
Among the variables involved in the above equations,
model (Okada and Matsuura, 1991). For binary mix-
the known quantities are:
ture permeation, the theory concludes the possibility
of the presence of concentration polarization occur-
ring inside the membrane. Experimental evidence of
• (Bd~)
and (B/cf) at 25°C which can be obtained
from the permeation data of pure component for
concentration polarization was presented in an earlier
the ith and jth component, respectively.
communication (Tyagi and Mastuura, 1995).
• Ji, Jr, Pi. 3 and Pj. 3, which are available from the
steady-state pervaporation experiments of the
STRATEGY FOR PLOTTING THEORETICAL
binary mixture.
CONCENTRATION PROFILES INSIDE THE MEMBRANE
FOR BINARY MIXTURE SYSTEMS
Equations (5)-(7) can be solved by using the va-
Using the new transport model (Tyagi et al., 1994),
por-liquid equilibrium data and following the iter-
the theoretical concentration profile of the slower
ation method to calculate the position of the phase
component (acetic acid in this case) can be plotted by
boundary (cfa/5 and fb/5). Iterations are performed by
following the method described in this section,
using the values of Pi., and Ps., from vapor-liquid
equilibrium data. Here Pi,, and P j., indicate the
Calculation of the phase boundary in the imaginary
partial vapor pressures of components i and j, respec-
phase at a fixed temperature
tively. Initial (guess) values of Pj,, and Pj., are to be
The transport equation for pure component per-
taken from vapor-liquid equilibrium data. Therefore,
A pervaporation model: membrane design 3107
P i . . and P j . . can be obtained using eqs (5)-(7) by the density of penetrant j (kg/m3), molecular weight of
iteration method and using the vapor-liquid equilib- component i and j, respectively. It is assumed that
rium data. Vapor-liquid equilibrium data for the densities of the ith and jth components (pi and p j) in
acetic acid-water system at different temperatures the mixture are the same as their pure component
were taken from the literature (Gmehling et al., 1981). densities. Quantities J~ and Jj are known from per-
From the vapor-liquid equilibrium data ofcompo- vaporation data. Therefore, the value of v can be
nents i and j the following relationships can be calculated from eq. (13) by substituting the values of
written: known parameters on the right side. The derivation of
P~,, + P j . , = P . (8) eq. (13) is shown in Appendix A.
In eq. (11) the following quantities are known: where P . is the total vapor pressure. Also,
• X i , . from eqs (8)-(10).
Yi, * =--Pi', (9) • Y/. 3 and Xi. 2 from pervaporation data.
P ,
Yi., = f ( X i , , ) (10) The value of the mass transfer coefficient in the imagi- nary phase, k, can be calculated from eq. (11) by
where Y~., and X~., are the mole fractions of compon- substituting the known quantities and the value of
ent i at phase boundary in the vapor phase, and liquid v obtained from eq. (13).
phase, respectively. Using eqs (8)-(10) the values of Y~., and X i . , corresponding to the best-fit values of
P~,, and P~., can be obtained. These values will be Calculation of phase boundary and mass transfer coef-
used in the next section to calculate the mass transfer ficient at different temperatures
coefficient. The values of parameters B~/3 and B J 6 at 25°C
were used to perform the calculations. These values
Calculation of mass transfer coefficient were obtained from pure component permeation data
The equation for concentration polarization based at 25°C. For the permeation data of the pure compo-
on the boundary film theory approach can be written nents (water and acetic acid) the permeation rate for
as follows: each component was recorded against the down-
stream pressure. These parameters were calculated in
X i . , - Y i . a = e x p ( v / k ) (11) an earlier communication (Tyagi et al., 1994). It
Xi,
2 - Y/. 3 should be noted that these parameters will changewhere X~. 2, X~., and Y~, 3 are the mole fractions of with temperature. Pure component permeation data
component i in the liquid feed mixture, at phase are available only at 25°C. The parameters at 35 and
40°C were obtained in the following manner. boundary, and in the downstream, respectively. In eq.
F r o m eq. (3) the permeation rate equations for (11), v and k represent penetrant velocity (m/s) and
mass transfer coefficient (m/s) in the imaginary phase, component i at 25 and 35°C can be written as
respectively. A general derivation of the concentration Bi 25 2
• - P/, 3.25) (14)
polarization equation based on boundary film theory Ji 25 = ~ ( P i , *. 25 2
can be found in standard membrane text-books, e.g.
Matsuura (1994). In the present case it is assumed that and
component i (acetic acid) permeates through the B~ 35 2
, = - - P I , 3, 3 5 ) . ( 1 5 )
membrane more slowly than component j and the J~ 35 ~ ( P i , , . 3 5 2
thickness of the liquid-filled region is equal to the
thickness of the boundary layer. The above equation The first subscript in the sequence of subscripts, i.e.
is derived to describe the phenomenon of concentra- i or j, refers to component i or j. The second subscript
tion polarization occurring inside the membrane. At • or 3 refers to the vapor-liquid equilibrium boundary
steady state, the net flow rate of component i in the or to the downstream, respectively. The third sub-
liquid-filled region is the sum of the diffusive flow and script 25 or 35 refers to the temperature of the feed
the convective flow and should be equal to the per- mixture in °C. Therefore, in this case P~,,. 25 indicates
meation rate of component i through the membrane, the saturation vapor pressure of component i at 25°C
Furthermore, the following relationship is valid: and B~, 25 refers to the parameter B for component i at
V = Mmix(Ji + di)/Pmix (12) 25°C. By rearranging eqs (14) and (15), the following expression can be obtained:
where v, Mmix and Pmix are penetrant velocity (m/s),
= p2 ,. 25 - P ~ 3, 25 ( 1 6 )
molecular weight of the mixture (kg/mol) and density Bi. 3 5 Bi. 25 x Ji, a5 x p2 _ p~.
of the mixture (kg/m3), respectively. Equation (12) c an ~b, 35 6b. 2s Ji,25 ,.,.35 .a. 35
be rearranged to give the following expression: A similar relationship can be obtained for component
j,M, JjMj
v = - - + - - (13) J:
Pj.,, 25 - Py. 3,25 (17)
Pi Pj Bj, 35 Bj. 25 x Jj' 35 x 2 2
= , P j , * , 3 5 - - P 2 , 3, 3 5
3108 R.K. TYAGI
et al.
In the above equations the values of Pi... a5 and fraction of acetic acid in this case) of the imaginary
P~,,. s5 for the desired composition can be obtained phase at different positions across the membrane can
from vapor-liquid equilibrium data. The values of be obtained.
parameters J/.25, Jj.35, Pi.3.25 and
Pj. 3,35
(corres-ponding to the downstream pressure conditions) can
Penetrant profile in the membrane phase
be obtained from the pervaporation data. Thus, the As the presence of an imaginary phase in equilib-
numerical value of the parameter Bi, as/fib can be rium with the membrane phase is assumed, sorption
calculated if the value of the parameter Bi.25/~ b is (liquid or vapor) data are to be used to generate the
known with one single pervaporation data at 35°C. penetrant profile in the membrane phase. In other
Similarly the values of the parameter
B/6b
at 40°C can words, the sorption data are applied to find the com-be computed for both components separately by position of the penetrant in the membrane phase
a single pervaporation data at 40°C. using that of the imaginary phase. When the imagi-
nary phase is liquid, corresponding penetrant amount and composition of the membrane phase is obtained
Penetrant profile in the imaginary phase
from the liquid sorption data. Similarly, when theThe objective now is to generate the penetrant imaginary phase is vapor, vapor sorption data are
composition profile along the penetrant flow direc- used to obtain the penetrant amount and composition
tion in the liquid-transport and in the vapor-transport in the membrane phase.
regions of the membrane. At this point it should be Therefore, for the slower component (acetic acid)
remembered that we are still dealing with the imagi- the following two family of curves (in membrane
nary phase and not the membrane phase. For the case phase) can be obtained:
when the imaginary phase is liquid, the following
equation can be used to find different X~,~ (refers to • Mole fraction of acetic acid in the membrane
the value of X~ at any position l) values at different phase vs the relative distance in the membrane.
positions (l)in the membrane: • Total penetrant (sorbed) amount in the mem-
( v ~ ) brahe phase us the relative distance in the mem-
Xi.
t - Yi, 3 = exp brane.Xi, 2 -
Yi, 3 ~X . (18)This equation can also be derived from the boundary These profiles obtained from the transport model are
film theory and will give us the values of Xi., at to be compared with the experimental penetrant con-
different positions, i.e.
1/6o.
This relative distance centration profiles. Experimental profiles were ob-should be converted to
I/6,
which is relative to the tained using a stack of identical membranes duringtotal membrane thickness, steady-state pervaporation.
Equations (3) and (4) can be rewritten in the follow- Assuming convective flow for liquid mixtures in the
ing manner for calculating the vapor pressure at liquid-transport portion of the membrane, the equa-
a position Iv from the phase boundary inside the tion for Ami~ for the liquid mixture can be written as
membrane along the penetrant flow direction: follows:
Bi
p2
p2
Am,.
J, = - - ( , . -- ,) (19) J, + Jj = (P2 - P.). (23)
( , ~ ) ( l . / ~ ) " "
6o
Bj
2
J~ = (6)(-f~/6) (P~'* --P].I).
(20) It should be noted that a strong coupling, and no separation, is assumed in liquid transport, whereas no coupling is considered in vapor transport. The possi-A further rearrangement of eqs (19) and (20) leads to bility of convective flow for liquid mixtures is
the following equations for the calculation of partial documented in the literature (Adam
et al.,
1983).vapor pressures of components i and j:
~/p
J. (lv/~)
EXPERIMENTALP " ' =
~'*-- '
(21)A stack of dense aromatic polyamide films was used
X/ to generate experimental data on penetrant profile
Pj I
p2
(lv/J._.._~)
(22) studies. An acetic acid-water system was used. These. =
~., -- Jj x (Bj/6)"
experiments were performed by using a stack of iden-These equations will give the value of P~.~ and tical membranes during steady-state pervaporation,
Pj, t
and, therefore, the mole fraction of component stopping the pervaporation experiment, dividing thei can be calculated as follows: stack into substacks, then desorbing and analyzing
Yi I = Pi,
l/(Pi, t+ Pj, t)"
the penetrants from each substack (Tyagiet al.,
1994;' Tyagi and Matsuura, 1995). Sorption experiments
The position
1~/6
should be converted to relative dis- were performed from liquid phase and vapor phasetance
I/6
measured relative to the membrane-feed for the same binary mixture of acetic acid and water.mixture interface. By combining the data for the The sorption experiments from the liquid phase were
A pervaporation model: membrane design 3109 mixture composition range. Vapor sorption isotherms tivity was observed for the highest downstream pres- were also established at these temperatures (Tyagi, sure (Tyagi
et al.,
1994). At a downstream pressure of 1993). In the present paper these sorption data will be 2666 Pa (20.0 mmHg), the membrane was mostly used only for prediction purpose, filled with liquid: the relative liquid-transport region was 0.74. Since the total saturation vapor pressure of RESULTS AND DISCUSSIONS the mixture is very close to 2666 Pa (20.0 mmHg) at this temperature, it is quite reasonable to expect thatTestin# the transport model
the phase was mostly liquid. Thus, the transport The newly developed transport model was used to model can describe the experimental data very well. calculate the theoretical penetrant concentration pro- The pervaporation mode having liquid on both sides file curves. The following data are needed to generate is similar to the case in reverse osmosis in the sensethese curves: that both feed and downstream are in liquid phase.
The transport mechanism in pervaporation mode • Vapor-liquid equilibrium data for the acetic having liquid on both sides should be the same as in
acid-water system at 25, 35 and 40°C. reverse osmosis. • Pure component permeation data at different
downstream pressures to obtain
Bi/¢5
andBj/6
The effect of feed composition on the vapor-liquid phase boundary is shown in Table 2. These data parameters. These parameters were calculated correspond to a downstream pressure of 467 Pa using the pure component permeation data of (3.5 mmHg) and a feed temperature of 25°C. A definite individual components at a fixed temperature, trend in the value of the relative vapor-transport • Liquid and vapor sorption data for the binary portion can be seen when the acetic acid mole fraction system for the same polymeric membrane at 25, is increased from 0.13 to 0.50. The relative vapor- 35 and 40°C. The sorption data are necessary tofind the sorbed amount and the mole fraction of transport portion increases from 0.51 to 0.85. In other each component in the membrane phase in equi- words, the membrane selectivity should increase as the mole fraction of acetic acid is increased or the librium with the imaginary phase. In the present water mole fraction is decreased. Referring back to the paper sorption data will be used to generate
penetrant profiles only. Detailed sorption data pervaporation data of the binary mixture at the same process conditions, it is evident that the lower mole will be presented in a later communication, fraction of water in the binary mixture led to higher
Effect of process variables on the phase boundary
separation factors (Tyagiet al.,
1994). Therefore, the The effect of different process variables on the phase observed trend of the pervaporation data is in agree- ment with the prediction using the transport model. boundary was calculated using the newly developed However, once the feed concentration of acetic acid transport model. The summary of calculation resultsincreases further, the relative vapor-transport region is shown in Tables 1, 2 and 3.
diminishes to 0.72.
The effect of downstream pressure on the liquid- The effect of feed temperature on the phase bound- vapor phase boundary is shown in Table 1. This table
shows the results for the phase boundary calculations ary is shown in Table 3. These data correspond to a downstream pressure of 467 Pa (3.5 mmHg) and an at a feed temperature of 25°C and an acetic acid feed
mole fraction of 0.50. For the downstream pressure of 467 Pa (3.5 mmHg) the vapor-transport region has
Table 2. Effect of feed composition on the phase boundary the highest value. As the downstream pressure in-
creases from 467 Pa (3.5 mmHg) to 2666 Pa Relative Relative
(20 mmHg) the fraction of the vapor-transport region M o l e fraction of liquid-transport vapor-transport decreases from 0.85 to 0.26. As separation occurs in acetic acid region region the vapor-transport region, the decrease in the in feed (J~/t~) (3b/J) amount of the vapor-transport fraction denotes a de- 0.13 0.49 0.51 crease in selectivity. This observation is in agreement 0.25 0.48 0.52 with pervaporation data at these downstream pres- 0.37 0.44 0.56 sures. In pervaporation experiments the lowest selec- 0.50 0.15 0.85
0.65 0.28 0.72
Table 1. Effect of downstream pressure on the phase bound-
ary Table 3. Effect of feed temperature on the phase boundary
Relative Relative Relative Relative
Downstream liquid-transport vapor-transport liquid-transport vapor-transport
pressure region region Feed temperature region region
Pa (mmHg)
(6a/6)
(6b/6)
(°C)(6a/~5)
(6b/~)
467 (3.5) 0.15 0.85 25 0.15 0.85
1200 (9.0) 0.22 0.78 35 0.21 0.79
3110 R.K. TYAGI et al.
acetic acid mole fraction of 0.50 in the feed. The ~ 0.8
• E x p e r i m e n t a l D a t a relative vapor-transport portions corresponding to
the feed temperature of 25 and 40°C are similar: 0.85 £ o P r e d i c t e d U s i n g Transport Model and 0.86, respectively. During the steady-state per-
vaporation experiments, the selectivity at 25 and 40°C .~ was the same, which can be explained by the same ~ 0.8 phase boundary position in both cases. At the feed
temperature of 35°C, the vapor-transport fraction was ~ the smallest, i.e. 0.79. Recall that concentration polar- ization inside the membrane was observed only at
. ~ 0.4 35°C (Tyagi e t al., 1994). Thus, a moderate selectivity +
occurring inside the membrane was attributed to one ~ e l l of the factors leading to concentration polarization.
Table 4 is a summary of the data generated using ~ = the transport model. The table shows the acetic acid ~ o.z
. < mole fraction at different positions inside the mem- brane. Relative mass transfer coefficients are also pre- sented with the mass transfer coefficient at the down- o stream pressure of 467 Pa (3.5 mmHg), feed temper-
ature of 25°C and at the acetic acid mole fraction of ~ 0.o . . . J i 0 t 0 . z 0.a 0.4 0.5 0.6 0.7 0.8 0 . 9 0.50 as the basis. The absolute value of the mass
transfer coefficient corresponding to the above pro- Relative Position inside the Membrane cess conditions is 6.24 x 10 - s m/s. The mass transfer
Fig, 2. Calculated penetrant profile compared with the ex- coefficient at the downstream pressure of 2666 Pa perimental data of the acetic acid-water system at 25°C, (20.0 mmHg) is nearly zero. This pressure is close to downstream pressure = 467 Pa, AA = 0.50. the total saturation vapor pressure of the feed mixture
at these conditions.
The penetrant concentration profile inside the
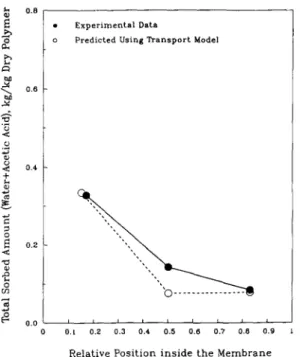
membrane was predicted using the newly developed responds to a downstream pressure of 467 Pa transport model. The prediction was made using the (3.5 mmHg), feed temperature of 25°C and acetic acid vapor-liquid equilibrium data, pure component per- mole fraction of 0.5 in the feed mixture. Figure 3 meation data, liquid sorption data, vapor sorption shows the results of a downstream pressure of 467 Pa data and the binary mixture pervaporation data. The (3.5 mmHg), feed temperature of 25°C and acetic acid prediction using the transport model was compared mole fraction of 0.25 in the feed mixture. Figure 4 to the experimental penetrant concentration profile, shows similar data at 35°C (downstream pressure of Six representative figures are shown in this paper. 467 Pa and acetic acid mole fraction in the feed solu- Both experimental and predicted penetrant concen- tion of 0.50).
tration profiles corresponding to the same process In these figures, only three data points are shown. conditions are plotted on the same figure. Figures 2, Each experimental data point represents an average 3 and 4 show the total sorbed amount of the pene- data for the corresponding section. Experimental data trants in the membrane phase plotted against the points were obtained using a stack of membranes. The relative distance inside the membrane. Figure 2 cor- stack was divided into three substacks and desorbed
Table 4. Summary of calculation data showing acetic acid mole fraction in the membrane phase at different positions Mole fraction of acetic acid
at liquid- at liquid-
vapor vapor
at feed- boundary boundary Relative
Downstream liquid (liquid- (vapor- mass
pressure Temperature in bulk membrane transport) transport) in down- transfer
(Pa) (°C) solution interface region region stream coefficient
467 25 0.50 0.16 0.19 0.05 0.07 1.00 1200 25 0.50 0.16 0.17 0.04 0.10 1.39 2666 25 0.50 0.16 0.16 0.03 0.12 - - 467 25 0.13 0.09 0.15 0.03 0.07 0.22 467 25 0.25 0.12 0.17 0.04 0.07 0.30 467 25 0.37 0.14 0.17 0.04 0.07 0.65 467 25 0.65 0.24 0.27 0.06 0.07 1.49 467 35 0.50 0.16 0.17 0.04 0.07 1.58 467 40 0.50 0.17 0.17 0.05 0.07 3.62
A pervaporation model: membrane design 3111
~, 1 with the downstream permeate vapor. This change in
• Experimental V,ta total sorbed penetrant a m o u n t reflects the large differ-
f:~ o Predicted Using Transport Model ence in the sorbed a m o u n t depending on whether the
m e m b r a n e is in equilibrium with liquid or vapor
0 . 8 phase. The a m o u n t sorbed from the liquid phase was
order of magnitude higher than that from the a n
vapor phase (Tyagi, 1993). Agreement between the
• z experimental and predicted data is quite good in
< ; 0 . 6
Figs 2 and 4.
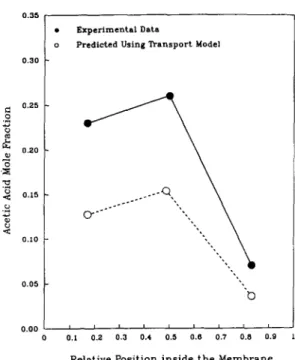
.~ O.... Figures 5, 6 and 7 show the calculated and experi-
+, ""-... mental results for acetic acid mole fraction profile.
3 "'" The mole fraction is plotted against the relative dis-
0.4 " " ( 3
tance inside the m e m b r a n e in these figures. There are three experimental points available. Figure 5 shows the data at the downstream pressure of 467 Pa
0.2 (3.5 mmHg) and at the feed temperature of 25°C.
In Fig. 6 a definite trend can be observed for acetic acid mole fraction inside the membrane. A maximum was observed in experiments under steady-state per- t2 . . . vaporation conditions. In Fig. 6 the experimental
o.1 0.2 0.3 0.4 0.5 0 . 6 o a o.~ 0.9
acetic acid mole fraction was the highest in the middle Relative Position inside the Membrane section/substack of the m e m b r a n e stack. Aromatic Fig. 3. Calculated penetrant profile compared with the ex- polyamide membranes permeate water preferentially. perimental data of the acetic acid-water system at 25°C, Therefore, acetic acid will be expected to accumulate downstream pressure = 467 Pa, AA = 0.25. close to the selective layer. In the present model the selective layer is the vapor-filled region. The higher mole fraction of acetic acid in the middle layer is the manifestation of this effect. The effect has close sim-
s.5 ilarity to the concentration polarization p h e n o m e n o n
• Experimental Data
-~ observed in reverse osmosis. The possibility of the
0 o Predicted Using Transport Model
presence of concentration polarization inside the
,~ m e m b r a n e was predicted using the newly developed
.~ transport model (Tyagi and Matsuura, 1995). The
predicted mole fraction of acetic acid inside the mem-
"o
rJ 0 . 3 5
• E x p e r i m e n t a l D a t a <
+ o Predicted Using Transport Model
0.30 0.5 "~ 020 0 . . . ~ 0,~ O.I 0 . 2 0 .3 0 .4 0 . 5 0 . 8 0 .7 0 . 8 0 . 9 rJ :,3 Relative Position inside t h e M e m b r a n e o °
0.10
Fig. 4. Calculated pcnetrant profile compared with the ex- perimental data of the acetic acid-water system at 35°C,
downstream pressure = 467 Pa, AA = 0.25.
o.o5 (3- . . . < 3
penetrant was analyzed Calculated data points cor- • 0.oo 0.1 , 0 . 2 0 . 3 ' 0 . 4 ' 0 . 5 ' 0 . 8 ' 0.7 ' 0 . 8 ' 0 . 9 ' responding to only three relative distances inside the
m e m b r a n e are shown in these figures. Relative Position inside the Membrane In all three figures, the total sorbed a m o u n t is the Fig. 5. Calculated penetrant profile compared with the ex- highest in the section in contact with the upstream perimental data of the acetic acid-water system at 25°C, liquid feed and is the least in the section in contact downstream pressure = 467 Pa, AA = 0.50.
3112 R.K. TYAGI et al.
o.as bulk feed mole fraction of the same. The mole fraction
• Experimental Data of acetic acid in the section closest to the downstream o Predicted Using Transport Model side is close to the mole fraction in permeate. In this
o.3o figure also, the transport model can reproduce the
qualitative behavior of the experimental data.
0.as It should be recalled that the coupling between the
flow of two penetrants (acetic acid and water in this case) was considered in the liquid-transport section of
0.20 the membrane. The coupling was not considered in
"~ the vapor-transport section of the membrane. If the
coupling p h e n o m e n o n in the vapor-transport region ,~ 0.15 . - - ~ is also quantified and incorporated into the transport model, the agreement with the experimental data
-~ would be even better. Incorporating coupling para-
0.:o meters will also explain m e m b r a n e selectivity decrease
• at higher acetic acid concentrations as extent of coup-
0.0s ,, ling changes with feed composition. O n the other
"t3 hand, the transport model would become more com- plex as compared to the present simple and easy-to- 0.oo , , ' ' ' ' ' ' ' use model.
0 . 1 0 . 2 0 . 3 0 . 4 0 . 5 0 . 6 0 . 7 0 . 8 0 . 9
It should also be pointed out that the p h e n o m e n o n Relative Position inside the Membrane of concentration polarization occurring inside the m e m b r a n e was first reported in the present work. Fig. 6. Calculated penetrant profile compared with the ex-
perimental data of the acetic acid-water system at 25°C, Other transport models available in the literature fail downstream pressure = 467 Pa, AA = 0.25. to predict this phenomenon. Therefore, the present work is the first theoretical work that can reconstruct the penetrant concentration profiles inside the mem-
o.s brane showing concentration polarization. The pres-
• Experimental Data ent work is also the first attempt to examine the 0 . 7 o P r e d i c t e d U s i n g Transport Model predictability of the newly developed transport model. The uniqueness of concentration polarization phe- n o m e n o n occurring only at a certain temperature (e.g. o . s at 35°C) can be explained qualitatively in terms of
~o penetrant-penetrant interaction, p e n e t r a n t - p o l y m e r
,~ o.~ interaction and the plasticizing effects of the pene-
-~ 0~ trants. Acetic acid forms dimers and can also associate
"~ with water in the solution. Water can also form clus-
0 . 4
ters in the membrane. All of the equilibrium constants associated with these effects will change with temper-
-~ o.s ature and composition of the mixture, and the pres-
< ence of the polymeric m e m b r a n e will further compli-
0.2 cate the case. The decoupling of these effects is not
possible at this stage. The simultaneous presence of these effects makes the profile data at a particular 0.1 "'",~> . . . © temperature and feed composition unique data for
a particular m e m b r a n e - p e n e t r a n t s system. 0 . o i i I I i i t i i
0 0.1 0 . 2 0 . 3 0 . 4 0 . 5 0 . 6 0 . 7 0 . 8 0 , 9
Relative Position inside the Membrane IMPLICATIONS OF THE EXPERIMENTAL DATA FOR THE MEMBRANE DESIGN
Fig. 7. Calculated penetrant profile compared with the ex-
perimental data of the acetic acid-water system at 25°C, In the present study a transport model was used downstream pressure = 467 Pa, AA = 0.65. which considers a phase boundary between the imagi- nary liquid and vapor phases. The imaginary phase is in t h e r m o d y n a m i c equilibrium with the m e m b r a n e phase. It was assumed that the part filled with liquid is brane also shows a similar trend. Therefore, the trans- nonselective and the part filled with vapor is selective. port model is able to describe the qualitative behavior Based on these assumptions an analysis of the binary of experimental data quite well. mixture permeation led to the possibility of the con- Figure 7 also shows acetic acid mole fraction in the centration polarization occurring inside the mem- membrane phase. Experimental mole fraction in the brane. This theoretical prediction was substantiated section closest to the liquid feed is very close to the with the help of experimental data obtained. The
A pervaporation model: membrane design 3113
phenomenon of concentration polarization occurred should not be very dense otherwise the permeation
in some specific cases but not in all cases, rate will be sacrificed. The top layer should also be as
The typical concentration polarization equation in- thin as possible. The following requirements must be
volves the term
exp(v/k),
which represents concentra- satisfied for the design of composite membranes:tion polarization modulus. This term should be mini-
mized in order to minimize the concentration polar- (l) The thickness of the layer, where the liquid
ization phenomenon. In the above expression v is transport takes place, should be as thin as pos-
defined by eq. (13) and is the penetrant permeation sible to increase the mass transfer coefficient of
velocity. The mass transfer coefficient
(D/ra)
is de- the layer.noted by k. Here D represents the diffusion coefficient (2) The coated layer should be as highly swollen as
of penetrant in the liquid-transport region and 6a is possible to increase the penetrant diffusivity.
the interfacial boundary layer thickness or the thick- (3) The bottom layer, where the vapor transport
ness of the liquid-transport layer, takes place, should be dense so that a high
There are two possibilities to minimize this term. selectivity can be achieved. The thickness of this
The first one is to lower v, which is impractical since vapor transport layer should be controlled to
an increase in v is normally desirable. The other possi- achieve an optimized flux.
bility is to maximize k, i.e. maximize the mass transfer
coefficient. Mass transfer can be maximized by either CONCLUSIONS
• The newly developed transport model can de-
• reducing the thickness of the liquid-transport scribe the qualitative behavior of the experi-
region, or mental data. Therefore, the present work is the
• increasing the value of the diffusion coefficient D. first theoretical work that can reconstruct pene-
trant profiles inside the membrane showing con-
In the present case, the interracial layer represents the centration polarization.
liquid-transport region of the pore or the layer where • The concentration polarization occurring in the
liquid transport takes place. For pervaporation, the
membrane should be minimized. The minimiz-
diffusivity of the penetrant inside the membrane is ation of this phenomenon is favorable to obtain
a function of the penetrant concentration in the mem-
brane. A high concentration of the penetrant inside grater permeation rates during steady-state per-
vaporation. Concentration polarization modu-
the membrane results in a greater value of diffusivity, lus can be minimized by
From all pervaporation data obtained it was quite - - k e e p i n g the liquid-transport region
6a/6
as smallclear that the permeation rate was greater when the
as possible, concentration of the penetrant inside the mem-
- - keeping penetrant concentration of the preferen-
brane was greater in the liquid-transport portion of tially permeating component in the liquid-trans-
the membrane. For example, for the pure water
permeation case, the highest permeation flux port region of the membrane as high as possible.
(1.62 x 10⁻³ mol/s m 2) was observed while the sorbed A novel membrane design for pervaporation separ-
amount of the penetrant in the liquid-transport region ation has been proposed. This membrane is a corn-
(the section in contact with liquid feed) was also the posite membrane consisting of two distinct layers. The
highest (0.718kg/kg of dry polymer). Therefore,
top layer should be as thin as possible. The top part of
higher penetrant concentration in the membrane will the polymeric membrane should have strong interac-
lead to a greater diffusivity value, greater mass trans- tion with the preferentially permeating component of
fer coefficient, and eventually, to greater total perme- the mixture. The bottom layer should be the selective
ation rates.
Thus, minimization of concentration polarization is layer and should be dense.
favorable to obtain greater permeation rates and
lower concentration polarization modulus. In con- NOTATION
clusion, concentration polarization occurring inside
Bi, Bj
vapor-transport parameter for componentsthe membrane has negative side effects, e.g. lower / a n d j, respectively, mol/s m 2 Pa 2
permeation rate and lower selectivity. Ji, Jj permeation flux of components i and j, re-
A novel composite pervaporation membrane can spectively, mol/m 2 s (kg/m 2 h)
be designed based on the above observations. This
Mi, Mj
molecular weights of components i and j,membrane should utilize a bottom layer for selectiv- respectively, kg/mol
ity; hence it should be a dense and selective layer. The P~.,, partial vapor pressure of components i and j,
top layer should have good interaction with the pref- P~.. respectively, at the phase boundary, Pa
erentially permeating component. A dense polymeric (mmHg)
base film (to achieve high selectivity) should, there- Pi, 3. partial vapor pressure of components i and j,
fore, be coated with a thin layer of hydrophilic poly- P j. 3 respectively, in the downstream vapor, Pa
mer for the purpose of preferential permeation of (mmHg)
water from a water-acetic acid mixture. In order to k mass transfer coefficient, m/s
3114 R.K. TYAG1 et al.
Wi, Wj weight fraction of components i and j in the cesses in Chemical Industry (Edited by R. Bakish), pp. mixture, respectively 320-334. Bakish Materials Corp., Englewood Cliffs, New
Jersey.
Tyagi, R. K., Fouda, A. E. and Matsuura, T., 1994, Possibi-
Greek letters lity of concentration polarization occurring inside the
total membrane thickness, m membrane during steady state pervaporation. Chem. ft., 6~ liquid- and vapor-transport regions of the Engn 9 Commun. (accepted).
membrane, respectively,
m Tyagi, R, K. and Matsuura, T., 1995, Concentration polar-ization occurring inside the membrane during steady state pi, pj density of components i and j, respectively, pervaporation. Chem. Enong Commun. 134, 157-170.
kg/m 3
pmix density of mixture, kg/m 3 APPENDIX a
v = Mmix(J i "4" Jj)/Pmix.
REFERENCES Let Xi and X j be mole fractions and wl and wj be the
Adam, W. J., Luke, B. and Meares, P., 1983, Mixture of weight fractions of components i and j, respectively. The organic liquid by hyperfiltration. J. Membrane Sci. 13, following expressions can be written:
127-149. X~ = JJ(J~ + J~) and S j = JJ(J~ + Jj)
Binning, R. C., Lee, R. J., Jennings, J. F. and Martin, E. C.,
1961, Separation of liquid mixtures by permeation. Ind. X~ + X~ = 1 and w~ + wj = 1.
Engng Chem. 53, 45-50.
Gmehling, J., Onken, U. and Arlt, W., 198 I, Vapor-Liquid The following relationship between the mole fraction X~ and
Equilibrium Data Collection: Aqueous-Organic Systems weight fraction w~ can be written:
(Suppl. 1), Chemistry Data Series, Vol. I, Part la. DE- w~ = MiX~/(M~X~ + MjXj).
CHEMA, Frankfurt.
Greenlaw, F. W., Prince, W. D., Shelden, R. A. and The following xpression can also be written for the mixture Thompson, E. V., 1977, Dependence of diffusive per- density:
meation rates on upstream and downstream pressures: I. 1/pmi I = w~/p~ + w j p j Single component permeant. J. Membrane Sci. 2, 141-151.
Huang, R. Y. M., Balakrishnan, M. and Rhim, J. W., 1992, which yields Pervaporation separation of pentane-alcohol mixture us-
ing nylon 6-polyacrylic acid (PAA) ionically crosslinked Pmix = PlPj/(wlPj + wjpi).
membranes, lI. Exprimental data and theoretical inter- The molecular weight of the mixture can be written as pretation. J. Appl. Polym. Sci. 46, 109-118. follows:
Kim, S. N. and Kammermeyer, K., 1970, Actual concentra-
tion profiles in membrane permeation. Sep. Sci. 5, M,,~x = X~M~ + XjM~.
679-697. By substituting the values of p,,~x, M,o~x and mole fractions,
Matsuura, T., 1994, Synthetic Membranes and Membrane the following expression for the penetrant velocity can be
Separation Processes, Chap. 5. CRC Press, Boca Raton. obtained:
Mulder, M. H. V., Franken, A. C. M. and Smolders, C. A.,
1985, On the mechanism of separation of ethanol-water v = (Ji + Jj)(XiMi + XjMi)
mixtures by pervaporation. II. Experimental concentra-
M~X~pj/(M~X~ + MjX~) + M~X~pi/(M~X~ + MjXj)
tion profiles. J. Membrane Sci. 23, 41-58. x
Neel, J., 1991, Pervaporation Membrane Separation Processes PiPj
(Edited by R. Y. M. Huang). Elsevier, New York.
Okada, T. and Matsuura, T., 1991, A new transport model By simplifying the above expression and substituting the for pervaporation. J. Membrane Sci. 59, 133-150. values of mole fraction in terms of permeation flux (J~ and Ji), Tyagi, R. K., 1993, Ph.D. thesis, Department of Chemical the following expression can be obtained:
Engineering, University of Ottawa, Ottawa. J~Mj -~ J~M~
Tyagi, R. K., Fouda, A. E., Handa, P. and Matsuura, T., v =
1992, Transport studies in pervaporation, in Proceedinos P~ P~ of the 6th International Conference on Pervaporation Pro- The above expression is the same as eq. (13).