A CELL-BASED SENSOR OF FLUID SHEAR STRESS FOR
MICROFLUIDICS
Sarvesh Varma
B.A.Sc., Nanotechnology Engineering, University of Waterloo, 2010
SUBMITTED TO THE DEPARTMENT OF ELECTRICAL ENGINEERING AND COMPUTER SCIENCE IN PARTIAL FULFILLMENT OF THE REQUIREMENTS FOR THE DEGREE OF
MASTER OF SCIENCE AT THE
MASSACHUSETTS INSTITUTE OF TECHNOLOGY June 2013
@ 2013 Massachusetts Institute of Technology All rights reserved.
ARCjS
\SSACHUSES INSTfE. O TECHNOLOGYR R8.013
3?RARES
Signature of Author Sarvesh Varma Department of Electrical Engineering and Computer Science May 23, 2013Certified by
I
Associate Professor of Electrical Engineering and Computer ScienceJoel Voldman Thesis SupervisorAccepted by
,., U Leslie A. Kolodziejski Professor of Electrical Engineering and Computer Sciences Chairman, Department Committee on Graduate Committee
A CELL-BASED SENSOR OF FLUID SHEAR STRESS FOR
MICROFLUIDICS
by Sarvesh Varma
Submitted to the Department of Electrical Engineering and Computer Science May 23, 2013
in Partial Fulfillment of the Requirements for the Degree of Master of Science
ABSTRACT
Fluid flow is an essential feature of every microsystem involving cell handling, culture or sorting. The particular application determines the relevant flow rates used in a device. Flows inevitably generate fluid shear stress (FSS) that may cause undesirable physiological cell stress. Simple assays of cell viability, morphology or growth are typically reported to indicate any gross disturbances to cell physiology. However, no straightforward metric exists to specifically evaluate physiological implications of FSS within microfluidic devices, or among competing microfluidic technologies).This thesis presents the first genetically encoded cell sensors that fluoresce in a quantitative fashion upon FSS pathway activation. A transcriptional sensor was chosen, meaning that fluorescence would be turned on when transcription of a relevant protein was initiated. Creating an effective transcriptional sensor requires identifying an
appropriate inducible promoter to drive fluorescence expression upon FSS. To this end, the native mechanotransduction of a widely used and easy-to-culture cell line (NIH3T3s) was elucidated by culturing them in a microfluidic device and applying logarithmic FSS via microfluidic perfusion. A panel of shear-responsive genes was analyzed using qRT-PCR, which resulted in the choice of EGR-1 upregulation as the node for FSS detection. A reporter plasmid with a minimal EGR-1 promoter driving the expression of Turbo-RFP fluorescence was chosen and the cell sensor was created by stable transfection and clonal selection. Inducing the pathway with Phorbol-myristate-acetate resulted in fluorescence induction by both microscopy and flow cytometry, verifying the sensor functionality. The fluorescence activation was then characterized across PMA doses and durations. Next, the sensors were tested using multiple duration microfluidic perfusions, where it was noted that the mean induced fluorescence intensity correlated to applied FSS intensity, as desired. It is anticipated that these cell sensors will have wide application in the microsystems community, allowing the device designer to engineer systems with acceptable FSS, and allowing the end-user to evaluate impact of FSS upon their assay of interest.
Thesis up rvisor: Joel Voldman
Acknowledgements
This thesis would have not been possible without the valuable supervision of Prof. Joel Voldman. I am enormously grateful to him and all his kind considerations and assistance in getting this thesis done. Additionally, I am very grateful to have the opportunity to work in his lab and learn so much within this environment.
As a student, I have an immense amount of debt to the knowledge, inspiration and teachings provided by all my teachers from high-school, to undergrad, to grad school. I am indebted to all my mentors and everyone who has provided me advice on my academic choices as well as provided perspectives on how to lead a better life. I am thankful to all the professors for teaching me valuable lessons either in a classroom environment or in a lab environment.
The support of all my friends has been tremendously appreciated and valued. Without all of them, I would have not maintained any sanity or happiness throughout my education and growth.
I am extremely grateful to everyone in the Voldman lab- past and present members for their help and kind encouragement. The same goes to all of my previous colleagues in various environments and locations.
If you know me, you would know relative to the deadline, at which point I would chose to write this acknowledgement section. The amount of gratitude I have towards all of you is overwhelming and cannot be described in short. I owe you all.
Finally, I dedicate this thesis to my family, ever-loving my parents and my precious sister. I would have never been able to do anything in my life without your support, love and blessings.
Table of Contents
Chapter 1: Introduction...10
1.1. Cell-based m icrosystem s that im pose fluid shear stress on cells ... 10
1.2. Motivation and approach for a cell-based sensor for fluid shear stress... 13
1.3. Fluid shear-stress m echanobiology... 15
1.4. Thesis overview ... 21
Chapter 2: M icrofluidic Shear-Induced Gene Expression ... 22
2.1. Introduction...22
2.1.1. Im m ediate-early pathw ay induction ... 22
2.1.2. Shear induced gene panel ... 23
2.2. M aterials and M ethods ... 24
2.2.1. Cell culture...24
2.2.2. Serum inductions...24
2.2.3. Device fabrication and perfusion setup ... 25
2.2.4. Q uantitative RT-PCR ... 28
2.3. Results and Discussion ... 30
2.3.1. Serum pathw ay induction ... 30
2.3.2. Perfusions...32
2.4. . Conclusions...39
Chapter 3: Induction Prom oters ... 40
3.1. Introduction...40
3.1.1. Shear stress response elem ents... 40
3.1.2. Prom oter constructs...42
3.2. M ethods ...- ... .. .45
3.2.1. Cell line construction: m aterials and m ethods ... 45
3.2.2. Chem ical inductions ... 46
3.2.3. Q uantitative RT-PCR...46
3.2.4. Flow cytom etry setup...47
3.3. Results and Discussion ... ... 49
3.3.2. Induced gene expression - qRT-PCR analysis... 51
3.3.3. Induced RFP expression - flow cytom etry analysis... 51
3.4. Conclusions...59
Chapter 4: EGR-1 Reporter...60
4.1 Introduction...60
4.1.1. EGR-1 Transcription and Regulation ... 60
4.1.2. Prom oter design ... 63
4.2 M ethods ... 65
4.2.1. Cell line construction: m aterials and m ethods ... 65
4.2.2. PM A induction...65
4.2.3. FACS sorting...65
4.2.4. Perfusion device fabrication and setup... 65
4.2.5. Sodium Arsenite and M M S inductions...66
4.2.6. Pathw ay inhibition...66
4.2.7. Flow Cytom etry Setup ... 67
4.3 Results and Discussion ... 68
4.3.1. Transient Transfection...68
4.3.2. Transient induction ... 68
4.3.3. Induction of stable population ... 71
4.3.4. Population sub-sorting ... 75
4.3.5. Characterization of RFP Induction Dynam ics ... 78
4.3.6. Selection of Clonal Population ... 80
4.3.7. Induction dynam ics of Clone 47... 85
4.3.8. Shear sensitivity of Clone 47 ... 86
4.3.9. Selectivity of sensor induction towards shear stress ... 89
4.4 Conclusions...93
Chapter 5: Contributions and Future W ork ... 95
5.1. Conclusions and Contributions... 95
5.1.1. The first cell-based fluorescent shear stress sensor ... 95
5.1.2. Characterization and com parison of response elem ent prom oters ... 96
5.1.3. M icrofluidic device for analysis of shear pathway inductions ... 97
5.2.1. Development of a screening platform for multiplexed perfusions... 98 5.2.2. Enhancing sensitivity and selectivity of shear stress reporter ... 98 5.2.3. Investigating new avenues of shear stress biology ... 99 R e fe re n ce s ... 10 0
Table of Figures
Figure 1-1 Fluid shear stress is ubiquitous in m icrosystems... 11
Figure 1-2 Microfluidic perfusion conditions for diversity of applied shear stress intensities ... 12
Figure 1-3 Schem atic of a variety of in-vitro techniques ... 13
Figure 1-4: Schematic showing the approach to create a fluid shear stress sensor in NIH3T3 cells...14
Figure 1-5: Schematic showing various stimuli induced endothelial cell gene expression. ... 15
Figure 1-6: Schematic showing the cross-sectional illustration of hemodynamic shear stress...16
Figure 1-7 Overview of mechanotransmission and mechanotransduction due to fluid shear stress ... 16
Figure 1-8 Shear inducible gene expression dynamics with sensitivity towards different flow patterns ..18
Figure 1-9 Genes sensitive to various exposure profiles of uniform laminar shear stress ... 18
Figure 1-10: Sequence of biochemical activation events upon shear stress. ... 19
Figure 1-11: Possible shear induced M EK-ERK 1/2 pathway... 20
Figure 2-1 Primary response genes c-Fos and EGR-1 sharing serum response element...23
Figure 2-2 Similarity of SRE driven induction by various stimuli... 24
Figure 2-3 Perfusion setup and chip layout... 27
Figure 2-4 Device disassembly procedure for collecting cell lysate ... 27
Figure 2-5 Mold for perfusion device of 8 microfluidic chambers...27
Figure 2-6 GAPDH normalized gene expression of serum induced cells ... 31
Figure 2-7 Comparison of cell morphology and proliferation in a cell culture dish...32
Figure 2-8 Cell seeding process across shear condition chambers. ... 33
Figure 2-9 Shear induced gene expression from 3 hour perfusion...34
Figure 2-10 Operational challenges with the designed device ... 36
Figure 2-11 Comparison of cell morphology after 24h of seeding...36
Figure 2-12 GAPDH normalized shear induced gene expression ... 37
Figure 3-1 Panel of shear sensitive genes in different endothelial cells ... 40
Figure 3-2 Positive and negative shear stress response elements...41
Table 3-1: Com parison of Red Fluorescent Proteins... 42
Figure 3-3 Plasm id m ap of pTurboPRL-RFP... 43
Figure 3-4 Promoter design containing tandem shear stress response elements ... 43
Figure 3-5 Forward and side scatter gates chosen in flow cytometry...48
Figure 3-6 A Gating in the PE-TexasRed (RFP) channel ... 48
Figure 3-7 Merged phase and fluorescence images after 24 hours of post-treatment incubation...50
Figure 3-8 SSRE RE cell line chem ical induction. ... 54
Figure 3-9 EG R-1 RE cell line chem ical induction: ... 55
Figure 3-10 SP1/EGR-1 RE cell line chem ical induction... 56
Figure 3-11 TRE RE cell line chem ical induction... 57
Figure 3-12 SPI RE cell line chem ical induction... 58
Figure 4-1 EGR-1 induction upon mechanical injuries and wounds in vasculature...60
Figure 4-2 EGR-1 mRNA transcript upregulation in vascular endothelial cells exposed to shear ... 61
Figure 4-4 Regulatory ER-1 binding sites in the promoters of shear sensitive genes...62
Figure 4-5 Model for EGR-1 displacing SP-1 in the promoter region of PDGFA,...62
Figure 4-6 Regulatory response elements in the EGR-1 promoter...63
Figure 4-7 Relative luciferase activity from EGR-1 based CAT reporters...64
Figure 4-8 Promoter deletion assay of EGR-1 promoter with CAT activity...64
Figure 4-9 Fluorescent images of blank cells (A), inducible cells (B)...68
Figure 4-10 Fluorescence, phase images and RFP intensity distributions of... 69
Figure 4-11 Fraction of cells expressing RFP in transient transfections and PMA inductions ... 70
Figure 4-12 Transient transfection inductions ... 70
Figure 4-13 RFP intensity distributions. ... 72
Figure 4-14 Comparison of population normalized mean RFP induction between transiently and stable tra nsfe cte d ce lls. ... 7 3 Figure 4-15 Fraction of cell activation between different reporter cells...73
Figure 4-16 Normalized mean RFP induction in PMA treated reporter cell lines...74
Figure 4-17 Comparison of EGR-1 response element to native promoter in context of inductions ... 75
Figure 4-18 Population RFP intensity histogram and gates used for sorting cells on the RFP channel...76
Figure 4-19 Fraction of population expressing RFP before and after PMA treatment ... 77
Figure 4-20 Normalized population mean RFP levels before and after PMA treatment ... 78
Figure 4-21 Time course evolution of normalized population mean RFP level ... 79
Figure 4-22 Time course evolution of normalized population activation level shifts...79
Figure 4-23 Population RFP intensity histogram and gates used for sorting single cells...81
Figure 4-24 Collective results from clonal inductions:... 82
Table 4-1 Comparison of clonal populations to parent population ... 82
Figure 4-25 Population RFP intensity histograms for control and induced conditions...84
Figure 4-26 PMA dose sensitivity of Clone 47 & parental population in terms of normalized percent cell a ctiv a tio n ... 8 5 Figure 4-27 PMA dose sensitivity of Clone 47 & parental population in terms of normalized fold induction of m ean population fluorescence ... 85
Figure 4-28 Bright field microscopy images of cells in chambers ... 86
Figure 4-29 Population RFP intensity histogram for A. Static cells (negative control) B. Cells perfused with media perfusion. C. Cells perfused with media containing PMA (positive control). Shear intensity of 16 dynes/cm2 for a duration of 3 hours ... 87
Figure 4-30 Shear induced mean RFP expression normalized to the device static control, across increasing shear inte nsities...87
Figure 4-31 Shear induced fraction of population activation normalized to device static control, across increasing shear inte nsities...88
Figure 4-32 Shear induced median RFP expression normalized to the device static control, across increasing durations of applied shear stress of 16 dynes/cm2. ... .. . . . .. . . .. . . . .. . . .. . . .. . . . . 89
Figure 4-33 Inhibition of PMA induction of population mean fluorescence with PD98059...90
Figure 4-34 MMS induction of DNA damage pathway in EGR-1 reporter. ... 91
Figure 5-1 A. High-shear region within the margination device. B. Experimental setup: cells flowing through the setup without the device (controls) and with the device (induced) C. Flow cytometry analysis of control and induced population. D. Normalized fold inductions of mean fluorescence at va rio u s flo w rates...9 6
Chapter 1: Introduction
1.1. Cell-based microsystems that impose fluid shear stress on cells
In the context of cell-based microsystems and technologies, the past few decades provide a plethora of platforms where cells have been cultured and processed for various applications. Large efforts have been made towards developing cell-type-specific systems where the chosen phenotype significantly impacts device design and cell culture techniques. For instance, in-vitro toxicity models and devices have been designed for primary hepatocytes [1], whereas an on-chip lung model was designed for primary alveolar epithelial cells [2]. Similarly, there has been substantial development of devices designed independently of cell types chosen to be used with them. Some examples include devices meant to manipulate or sort cells with light [3], electric fields [4], magnetic fields [5] or by hydrodynamic trapping [6].
Fluid flow is an essential feature of every microsystem involving cell handling, culture or sorting. The particular application determines the relevant flow rates used in a device [7]. Microfluidic platforms and technologies can generally be categorized by virtue of their operational flow rate and experimental duration. There is a whole gamut of devices which operate at high flow fluid rates for short durations, such as high-throughput cell sorters [5], inertial-force devices [8] and droplet-based microsystems [9, 10] to name a few. Such devices commonly use non-adherent cells, or adherent cells maintained in suspension, because cells are meant to have short residence durations within the device. In another flow regime, many devices are meant to apply very low flow rates for long durations. Typical examples of such microfluidic devices are those used for long term cell static culture [11] or perfusion culture [12, 13].
Flows inevitably generate fluid shear stress (FSS) that may cause undesirable physiological cell stress. In the 'short-but-intense' flow category of devices, cells experience large FSS
(~100s-1000s dynes/cm2) for a short duration (milliseconds-seconds). For the other category of
'prolonged-and-gentle' flow based devices, cells experience lower FSS (0.001-10 dynes/cm2) for
long durations (~hours-days). Several other microfluidic technologies fall in between these two extremes, where cells could experience moderate shear stresses (~10s-100s dynes/cm2) for
moderate durations (~minutes-hours). An illustration mapping the range of shear exposures and durations of various microfluidic systems is shown in Figure 1-1.
It is important to realize that such categorization of fluid shear stress in microenvironments implies a level of subjectivity. To illustrate, in one study, a microsystem platform was used to apply shear of 0.2-5 dynes/cm2 shear stress on rat kidney cells for 12 hours[14]. In another study, a microfluidic device was used to study stem cell self-renewal, which required 0.007
as one with 'short-but-intense' shear stress. To contrast, in a third study osteoblast cells were differentiated for 10 days using a microfluidic platform with a fluid shear stress of 0.07 dynes/cm2[ 15]. When comparing this third study to the second, the third could be categorized as one with 'long-and-intense' shear. These examples essentially highlight an underlying fact that the device operation and design differ because of the chosen cell-type. This fact makes categorization of fluid shear stress intensity and duration within microsystems somewhat subjective. Therefore, the choice of fluid flow conditions (FSS intensity and duration) may not only depend on the device application, but also on the chosen cell phenotype, as shown in Figure 1-2 [7]. Fluid shear stress may not always be detrimental to cell health because in some cases it is required for beneficial outcomes such as endothelial cell maintenance [16]. Nevertheless, in the context of cell-based microsystems and technologies, shear stress is generally viewed as a stress stimulus.
Cell Response - High-throughput morphology
proliferation & inertial sorters iability
gene expression phenotype
Droplet motility
microsystems (U 0
Cell culture/ Implications to
cell health largely
2- perfusion devices unknown
milliseconds seconds days
Duration
Figure 1-1 Fluid shear stress is ubiquitous in microsystems with a large range of imparted shear intensities and durations. Resulting cell responses are complex and largely uncorrelated with cell health in microsystems.
It is conceivable that in the context of many cell-based microsystems, the implementation of protocols itself may influence cell physiology and therefore may cause undesirable stress conditions. For example, fluid shear stress can cause physiological changes to migrating leukocytes and their activation profiles within the vasculature [17]. When handling or sorting such cells, a system generating fluid shear stress could presumably alter the physiology and therefore the functionality of such cells. Knowing the effect of microsystems upon cell health is therefore important to the designer as it would be desirable to minimize any adverse impact on cells simply due to the device environment. Likewise, the same knowledge is useful for the end-user of the technology for evaluate the extent to which the cell physiology may be biased due to the experimental setup and operations.
CELL TYPE Culture Chamber height Media residence time Estimated Shear Stress
microns min dyn-cm-2
Primary rat Hepatocytes 100 0.0026 0.7
85-500 0.042-15.63 0.01-21
HepG2 human hepatocytes 100 0.4 1.4-1.6
50 0.033-4.17 0.001-4
Primary bovine endothelial cells 50 0.033-4.17 0.001-4
Bovine aortic endothelial cells 100 0.009 20
HeLa cells 50 0.033-4.17 0.001-4
Human Neural stem cells 100 24 0.0005
Human SY5Y neuroblastoma 50 0.033-4.17 0.001-4
3T3 fibroblasts 50 0.033-4.17 0.001-4
MC3T3-El osteoblasts 100-200 8 0.05-0.7
Figure 1-2 Microfluidic perfusion conditions for various cells types, showing large diversity of applied shear stress intensities. Information adapted from [7].
Unfortunately, it is challenging to quantify how an intentionally or unintentionally imparted fluid shear stress may affect the cell physiology. Cells demonstrate a complex combination of responses towards external stress stimuli. The exact set of cellular decisions depends on the bio-chemical and bio-physical cellular environment, the cell type, as well as on the type, intensity, and duration of the applied fluid shear stress [18]. Stress causes cells to either promote self-protection, repair and therefore survival, or to proceed towards a destructive fate by programmed cell death. Initial cell responses are geared towards recovery and defense against the insult. However, if unbearable, the cell activates death signaling pathways such apoptosis, pyroptosis, or necrosis [19, 20].
In order to gain insight into cell physiology, microscopy is used to characterize morphology, proliferation and motility; MTT assay for studying metabolism; staining and flow cytometry to analyze cellular viability or phenotype, RT-PCR for revealing changes in gene expression; and ELISA for analysis of antigen production. An assortment of these measures paints a picture of cellular responses towards a stressful stimulus at a given time. A large number of micro-analytical systems focus on the extraction of intracellular contents for analysis of metabolities and genetic material [7]. In a more specific context of gene expression, several off-chip assays can be used to analyze mRNA/Protein levels, protein-protein interactions, phosphorylation and translocation of relevant regulatory biomolecules (Figure 1-3).
In vitro Assays
proten levels
X Tis0oDO aiwproei Interenos
-WeaeSotion (nuclear)
* I~fse
j
URNAfootprint Proteinrom
+ ChIP TARGET NE Promoter otvity
Figure 1-3 Schematic of a variety of in-vitro techniques used for analysis of cell physiology in the context of genetics.
Obtained with permission from [21].
However, microsystems engineered for cell biology may not necessarily be able to utilize all of these methods to evaluate their impact on cell physiology. Part of the reason lies in the fact that many of the traditional assays for cell physiology require large cell numbers or complicated protocols which may not be feasible with all device platforms. Nevertheless, studies of cell morphology, viability and growth rate are performed by microscopy itself- a tool available for most experimentalists and device designers. It is therefore typical to observe microsystems engineers presenting viability, morphology and growth rate data as gross indicators of cell health in the context of their devices. For example, an on-chip cell culture platform meant for long term cell culture used cell-viability staining and morphology information as an indicator of favorable cell culture conditions [22]. In another example, cell morphology was used to infer cell physiology in a microfluidic single-cell culture array [6]. Lecault, and others cultured hematopoietic stem cells in a microfluidic device and compared growth rates of their on-chip and off-chip cultures as a metric of evaluating stem cell physiology [23]. As there is no current 'standard' or metric for quantifying physiological shear stress in microsystems, it is currently not straightforward to compare platforms to each other for evaluating cell physiology. This thesis will address this concern by providing a unique cell-based sensor approach that could be useful in the microsystems community for evaluation of fluid shear stress.
1.2. Motivation and approach for a cell-based sensor for fluid shear stress
In this thesis a cell-based fluid shear stress sensor will be developed by correlating applied stress exposure to resulting stress pathway activation and subsequent gene expression.
Primarily this will be advantageous because changes in gene expression are up-stream to the later chronic changes in cell physiology that dictate morphology, proliferation and viability. Conveniently, gene expression is quantifiable (by RT-PCR, protein immunoblotting, etc.) as compared to other observable metrics such as morphology. The caveat of using RT-PCR or blotting is that these methods are end-step processes which require cell processing and are eventually detrimental to the cells. Therefore, a cell health sensor that allows for a visual and non-destructive assessment of gene expression through quantitative fluorescence will be beneficial and desirable.
A genetically encoded live-cell sensor that provides information regarding chosen stress pathway activation via expression of fluorescence is a relevant solution to this concern. This ability will eliminate the need for disruptive cellular processing and does not require any additional reagents for fluorescence visualization. Furthermore, this sensor would be able to provide an extra dimension of information about cell heath alongside morphology, growth rate and viability available through microscopy alone. Such a sensor could be used for real time monitoring of cell health at a single-cell level by recording fluorescence with microscopy and live-cell imaging. The presented sensor will be a reporter cell-line, whose expression of a fluorescent protein is driven by a promoter of a stress responsive gene. This approach is shown in Figure 1-4.
Shear stress Measure fluorescence
reporter plasmid Selection and single correlating to stress transfection N1H3T3 mouse cell cloning of Stressful flow
fibroblast stable reporter conditions
Figure 1-4: Schematic showing the approach to create a fluid shear stress sensor in NIH3T3 cells
A clonal population of such a sensor will be selected based on high sensitivity and selectivity towards a given stress stimulus. Mapping fluorescence expression dynamics towards a sub-lethal range of stress intensity would be extremely useful in characterizing the sensor response. Subsequently, these cells could be provided to the cell-based microsystems community to evaluate device designs and operations with more comprehensive insight towards its impact on cell health.
In order to develop the proposed sensor, the primary goal is to choose a cell line which is representative of a 'model' cell line that most laboratories would be comfortable using and culturing. Also, the cell line needs to be relatively straight forward to engineer with an ability to elicit a response to shear stress with moderate sensitivity. In this thesis, the shear stress sensor is embedded within NIH-3T3 cells, which are mesenchymal cells and are known to show a shear
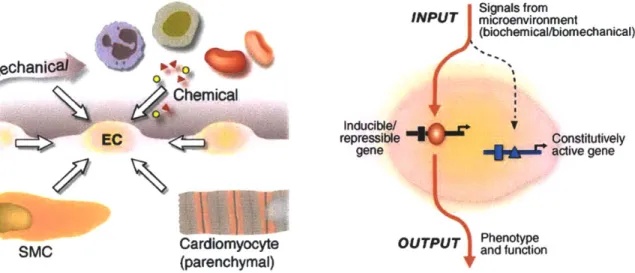
stress response [24]. The underlying functionality of this shear sensor is modeled after mechanosensitive biology of endothelial cells. These cells reside at the lumen wall, and can sense flow induced shear stresses in order to adapt towards a homeostatic state. In accordance to a range of vascular fluid shear stresses, these cells exhibit shear induced genetic responses, in a manner that makes them natural shear stress sensors (Figure 1-5)[21].
Signals from INPUT microenvironment (biochemical/biomechanical) Whania Chemical Inducible/ EC repressible Constitutively
gene active gene
14\Phenotype
SMC Cardiomyocyte OUTPUT and function
(parenchymal) y
Figure 1-5: Schematic showing various stimuli induced endothelial cell gene expression. Obtained with permission from [21].
1.3. Fluid shear-stress mechanobiology
Similar to cells flowing in a microsystem, blood flow in vasculature also experiences fluid shear stress of various ranges. In contrast to laminar flow characteristics found in microfluidics, blood flow is relatively complex and can follow both laminar-like and turbulent regimes (Figure 1-6) [25]. While physiological shear stresses range from 1-20 dyne/cm2, it is possible to observe high ranges of shear stresses in disease states. Interestingly the range of physiological and disease-state shear stress intensities is also found in many microsystems, which is why vascular mechanotransduction mechanisms are relevant for creating a shear stress sensor for microsystems.
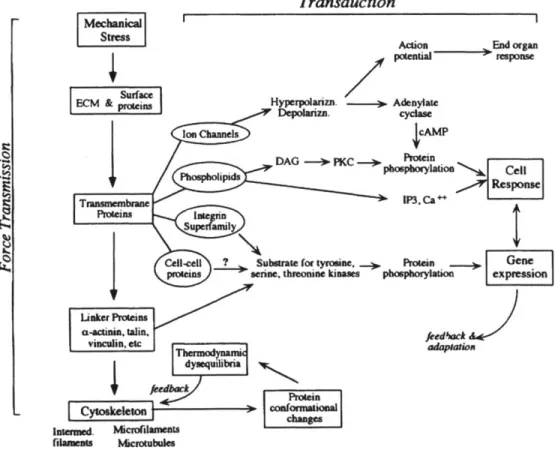
In order to assess the implications of fluid shear stress on cell physiology it is important to understand the mechanisms by which endothelial cells experience and adapt to an applied shear force. Fluid shear stress is transmitted through luminal trans-membrane proteins, via tension of the cytoskeleton, to the nuclear membrane. This phenomenon is called mechanotransmission, and can influence morphological changes by cytoskeleton rearrangements. At the same time, shear stress also affects the cell physiology through membrane signaling, second messengers, and activation of transcription factors. This type of response to shear stress is categorized as mechanotransduction, and is fundamentally tied to
stress pathway activation and gene expression modulation [18]. A schematic overview of these effects are shown in Figure 1-7 [26].
Vein Artery High Shear Thrombosis Blood Flow
Range of Wall Shear Stress Magnitude
16
10 70
C 4
70 >100
Shear Stress on Lumen Wall
50
Shear Stress (dynes/cm)
Figure 1-6: Schematic showing the cross-sectional illustration of blood vessel with hemodynamic shear stress, along with ranges of shear stress magnitudes encountered in arteries, veins, and in high shear stress conditions. Adapted with permission from [25].
Transduction
ECM & I
Action End organ
pott response
Hyperpolaizn. - Adenylate
Depolrizn.cyclase
IonChanel cMP
DAG -- PKC - Potein
Phospbolipide pbosporylaon Cel
1P3. Ca + esos
? Substrate for tyromine. y Protein Gene
e serine threonine kiasses phosphoryaio expression
feed~w A*., ... 4..-;adtadkrn dyequlibna Cyoskeetn | confornama Inermed. Microfilanents filaments Microtubules
Figure 1-7 Overview of mechanotransmission and mechanotransduction due to fluid shear stress. Obtained with permission from [26].
In terms of designing a shear stress sensor for microsystems, it will useful to know if cells are sensitive to only a particular kind of flow profile. For example, if a shear stress sensor is based
100
A
Li., L I Mechanical StressIon cells which are naturally only sensitive to pulsatile (blood) flow, then they may not be as responsive to continuous laminar flow observed in many microfluidic systems. Fortunately, in terms of gene expression, many flow profiles are found to elicit a biological response (Figure 1-8) [27]. Therefore, designing a shear stress sensor will require investigation of shear sensitive genes with sensitivity to relevant flow patterns (steady and laminar) more commonly found in microsystems. Furthermore, it is interesting to note that even within the regime of uniform laminar shear stress, cells can be sensitive either acute exposure or chronic exposure to shear stress and therefore illicit differential gene expression patterns (Figure 1-9) [28].
This makes it possible to investigate a subset of shear inducible genes for a particular microsystem flow profile. The 'gentle-but-prolonged' category of microfluidic devices may impart shear stress intensities which may possibly be below the detection limit of cells within their natural environment. While such stresses may still affect cellular physiology, it is possible these effects may be smaller than that from the category of 'short-but-intense' shears. In this thesis, genes sensitive to acute and uniform laminar shear stress will be explored, in order to investigate physiological stress from 'short-but-intense' category of microfluidic devices.
Most of the seminal work in analyzing the effects of shear stress on cell physiology and gene expression has been performed using primary endothelial cells such as bovine aortic endothelial cells (BAECs) or human umbilical vascular endothelial cells (HUVECs) due to their relevance to vascular diseases and blood pathology. Various shear sensitive genes have been identified in literature using these cells and others [29] and with various expression dynamics.
Endothelial Cell Responses to Different Types of Unsteady Laminar Shear Stress
Response
Shear Sress Tp
fI
aI~
Reftmce
Figure 1-8 Shear inducible gene expression dynamics with sensitivity towards different flow patterns. Obtained with permission from [27]. Induction: Acute: Chronic: Repression: Acute induction prolonged repression.
Umform laminar shear stress
P01 synthase, connexin43, c-myc, c-fos. c-jun, egrl
PDGF-A, tissue factor, smad 6,7.
PDGF-B, TGF-#, b-FGF, HB-EG CNP, COX-2,
Thrombomdulin, HO-I, thrombospondin laminin B1, myosin light chain dnase, Mn SOD
ICAM-1, GRO, IL-1, IL-6, IL-8 receptor, tPA, lysyl oxidase, Cu/Zn SOD.
PAI-1, Endothetin converting enzyme, NADH dehydrogenase.
VCAM-1 (lymphatic EC)
Endothehn-1, ACE, thrombomodulin.
Figure 1-9 Genes sensitive to various exposure profiles of uniform laminar shear stress. Obtained with permission from [28]
Figure 1-10 illustrates an overview of biochemical events that are activated by shear stress, including gene expression [30].
l61t X 96 K Clumel activation + 9K -pHi t 97 b-FGF mRNA 74 c-os mRNA 64 c-jmn mRNA 64 c-myc mRNA 64 cNOS mRNA - -0 - -- X 14y, ET-1 49 ET-1 mRNA 4, X PDGF-A mRNA T4 PD3GF-8 mRNA Prostacychtn "5 TGF-bl _ _ _ _ 75__ _ TM mRNA 95 tPA 1 Cell alignment 9 EC proliferatikM9 Elongadon 3 Xt IM E-sciecfin X 77.3 ICAM-1 z3 NKC cotransponer X 89 NO - 49 NOS3nmRNA X X 97 sU~m4 4 1 4 sncaMs rJe $$79-? VCAM-1 X -+ 77.131
Time Scale PDGFA
o-fos C-jun
seconds minutes 1-8 hrs >8 hrs Typel -Ps,
ion channel
activation .wo8 ili;Z ~~
second messengers 0 N TGF
I P,
JOM-Calcium flow
MAP kinase signaling
EGR-1 upregualtion PDGF-B
Immediate early genes
TM-cytoskeletal changes Tye
MP-SSRE dependant regulation V , . . -.-- _. IN I
0 3 6 9 12
lignment Duraton of Shear Stress (Hours)
Figure 1-10: Sequence of biochemical activation events upon shear stress (left). Gene expression dynamics with respect to shear stress duration with genes categorized by the expression profile types Iright). Figure adapted from [30, 31] with permission.
In order to specifically focus on shear gene induction due to acute exposures, it is imperative to focus on genes that are upregulated within minutes of exposure. It will also be interesting to focus on genes with regulation that returns to basal levels following maximal induction. Such feature would allow the sensor to 'reset' after some time and could potentially be usable for another shear stress measurement. Therefore in this thesis, genes following the Type and Type II category (Figure 1-10) will be investigated.
Taken together, it can be seen that shear responsiveness of endothelial cells can be highly specific towards many fluid shear stress characteristics. In this thesis a gene panel of relevant shear sensitive genes will be explored given the stated sensitivity preferences towards shear intensity, flow profiles, and exposure duration. The main idea would be to identify the ideal shear sensitive gene in NIH3T3 cells, with consistent and high level of inductions. It would also be important to choose a gene that is conserved and explored within many cell phenotypes, for the cell sensor to represent a generalized shear-induced physiological stress among the many cell types used in microsystems. In this thesis, the chosen shear responsive genes will be PDGF-a, PDGF-0, MCP-1, EGR-1, c-Fos, ICAM-1, VCAM-1 and TF. To check cross-sensitivity to other stress pathways such as DNA damage and heat shock pathway, p53 and HSF-1 will be chosen as representative genes respectively.
In this thesis, the shear-induced gene expression in NIH3T3 cells is studying by using a logarithmic shear-stress device that can multiplex 6 shear conditions at once [12]. Gene expression profiles will be specifically evaluated upon cells following various perfusion conditions using qRT-PCR.
In order to elucidate the relevant shear pathway in NIH3T3s, it is important to understand the cause of shear sensitivity of the chosen gene by understanding regulatory domains in its
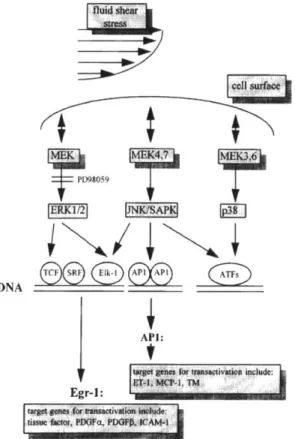
promoter sequence. In literature, several shear response elements are correlated to the chosen gene panel [30]. These response elements are essentially short sequences in the promoter that are essential to elicit induction of that gene upon shear stress. Specifically, the PDGF-a, PDGF-@, MCP-1, and TF response elements were identified and named as Spl/Egr-1, SSRE, TRE and Spi [28]. In many cases, these sequences are the binding sites to known transcription factors which are inferred to be activated upon shear stress. A general characteristic of the shear stress physiology is that there is no-consensus transcription factor that is activated upon shear stress across a range of genes, let alone cellular phenotypes. One possible shear induced pathway relevant to the chosen gene panel is shown in Figure 1-11.
7 D9O959 1 JNKISAP DNA/\1 API: Egr-1: 'C ' Pia.: SCA*I..
Figure 1-11: Possible shear induced MEK-ERK 1/2 pathway relevant to regulation of chosen gene panel. Obtained with permission from [30].
As the native promoters of the shear responsive genes contain multiple response elements, it is possible that desirable shear sensitivity may not necessarily guarantee desired induction selectivity towards shear stress. To investigate this further, the chosen approach in this thesis will be to clone three tandem response elements in the multiple cloning site of a promoter-less vector (pTurboRFP-PRL). This is a typical approach mentioned in the research literature [32] as well as in commercially available reporter plasmids. Following this approach will allow
construction and also comparison of reporter cell lines that will be induced by chemicals known to trigger the inferred shear pathway from initial genetic analysis. The induced expression will be evaluated in terms of induced fluorescence expression as well as the by quantifying the fraction of induced population.
Following the investigation of shear induced genetic expression profiles as well as chemical induction profiles of reporter cell lines, a suitable promoter for shear stress induction will be identified, and used to construct the final shear stress reporter cell line. This cell line will be first characterized in its response to chemicals stimulating pathways similar to that of the inferred shear pathway. Subsequently, the reporter cell line will be cloned and used for characterization of devices imparting fluid shear stress.
In summary, this proposed cell-based sensor will provide a more convenient approach to quantify cell health in microsystems. With its application, it will be possible to be to eliminate the need for having large cell numbers for obtaining information regarding cell physiology. Similarly, system characterization will be convenient due to minimal steps and processing required characterizing the proposed cells sensor response. Finally, the future distribution and propagation of this cell-sensor in the microsystems community could allow it to become one of the 'standard' metrics in evaluating microsystem design.
1.4. Thesis overview
In order to pursue creating a shear stress sensor with the considerations described as above, the main objectives of this these are:
1. Analyzing changes in gene expression of cells using microfluidic perfusion platform that imparts a range of fluid shear stress (Chapter 2: ).
2. Development and characterization of a set of reporter cell lines to choose an appropriate promoter for shear stress (Chapter 3: ).
3. Development and characterization of the shear stress sensor (Chapter 4:).
The main conclusions, contributions and future prospects of this thesis work will be provided in Chapter 5:.
Chapter 2: Microfluidic Shear-Induced Gene Expression
2.1. Introduction
This chapter discusses fluid shear stress-induced gene expression in NIH3T3 cells. First, immediate-early gene expression profile of shear inducible genes was characterized by serum treatment. Microfluidic devices were developed and used to apply logarithmic shear stresses on these cells. Induced gene expression was analyzed by qRT-PCR to characterize shear stress pathways in NIH3T3s, which could be later utilized to identify suitable shear-inducible promoter candidates.
2.1.1. Immediate-early pathway induction
Each inducible promoter can have multiple response elements (binding sites) of different regulatory transcription factors, which could synergistically orchestrate transcription in a complex fashion. In fact, certain transcription factors can increase mRNA levels of one gene and decrease that of another through the same shear stress response element. For example, fluid shear stress induced AP-1 transcription factor can increase levels of MCP-1 as well as decrease VCAM-1 levels in HUVEC cells through the same AP-1 response element [30]. Both of these genes have NF-KB binding sites as well, which have been reported to regulate shear stress induced PDGFB expression. It is not clear if that transcription factor NF-KB could also affect shear induced regulation by AP-1. Such transcription aspects add complexity to elucidating a unique shear mechanism.
One method of thoroughly characterizing shear induced pathways could be to study gene expression dynamics due to large range of shear stimulus exposure doses. Such screening is a cumbersome process and has not yet been reported for NIH3T3 cells. One report however, has reported a genome-wide study of these cells experiencing mechanical stretching in-vitro [33]. Two prominent genes reported to be upregulated due to this stress were EGR-1 and c-Fos. While the stimulus is not the same as fluid shear stress, it induced these two genes which are interestingly also upregulated due to fluid shear stress.
Specifically, EGR-1 and c-Fos were deduced to be responsible for the downstream shear induced expression of PDGFA and MCP-1 respectively. EGR-1 and c-Fos encode for transcription factors which share many similar characteristics. In fact, these two genes have been categorized as immediate-early response genes whose transcription transiently rises to very high levels following growth factor or mitogen stimulation and subsequently decays to basal levels [34, 35]. Such induction kinetics have been linked to these genes having serum
response factor (SRF) REs in their promoters, as show in Figure 2-1 Primary response genes
c-Fos and EGR-1 sharing common regulatory elements such as serum response element (S) and the cAMP response element (C). Information adapted from [37].
[34, 36, 37]. c-Fos -300 -100 0
00
[
EGR-1 -400 -400 -100 0Figure 2-1 Primary response genes c-Fos and EGR-1 sharing common regulatory elements such as serum response element
(S) and the cAMP response element (C). Information adapted from [37].
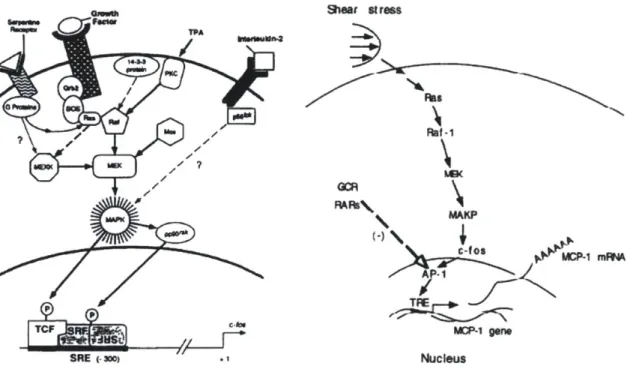
Interestingly, PKC and MEK/ERK dependent expression of EGR-1 and c-Fos due to wound
induction or applied fluid shear stress involves the activation of this serum response. element (SRE), shown in Figure 2-2 Figure 2-1 Primary response genes c-Fos and EGR-1 sharing common regulatory elements such as serum response element (S) and the cAMP response element (C). Information adapted from [37].
[38-42]. Therefore, it was of interest to first verify if such a mechanism existed in NIH3T3 cells, and could be triggered by chemical stimulus, such as by serum treatment.
2.1.2. Shear induced gene panel
In order to directly evaluate shear stress driven regulation of inducible genes, a panel of genes was chosen from literature as: PDGFA, MCP-1, c-Fos, EGR-1, PDGFB and TF [30]. These genes have known shear stress response elements within their promoters, suggesting ability to be upregulated by fluid shear stress [28]. VCAM-1 was added to this panel of genes because it has been reported to be down-regulated due to shear stress [43]. Representative genes from other stress pathways such as DNA damage and heat shock pathways were chosen as p53 and
oma Staat st rees
AMK
TM- gene
ORE
-a*oi .' Nucleus
Figure 2-2 similarity of sRE driven c-Fos induction by various stimuli and shear stress induced c-Fos pathway. Obtained with permission from [41] [44].
2.2. Materials and Methods 2.2.1. Cell culture
NIH3T3 cells were expanded from a continuing cell stock in the laboratory, with the parental cell line originating from ATCC cell bank (ATCC* CRL-1658TM). The culture conditions were maintained according to the proposed ATCC protocol. The cell culture media ATCC-formulated Dulbecco's Modified Eagle's Medium, with high glucose content (Catalog No. 30-2002) was supplemented with bovine calf serum (10% v/v), L-glutamine (2% v/v) and penicillin-streptomycin (1% v/v).
2.2.2. Serum inductions
Cells were seeded in 6-well plates to reach 80% confluence. Serum free media (0.15% serum) was introduced to cell cultures for 24 hours in order to serum-starve cells prior to induction.
The serum starved cells were then incubated with regular cell culture media with 3, 10 and 20%
(v/v) serum concentrations for 30 minutes, 1 hour and 2 hour durations. The reference controls were cell cultures with no serum inductions. Cells were lysed for RNA extraction immediately after the serum exposure. Induced expression was normalized to basal expression of serum starved cells.
2.2.3. Device fabrication and perfusion setup
The general perfusion operation is outlined in Figure 2-3. Cells were seeded in a microfluidic device overnight, perfused with media, collected and used for qRT-PCR analysis of induced gene expression. In this chapter, two different microfluidic devices were used for this purpose.
For long term (3 hour) perfusions, a microfluidic device that can impart logarithmic shear stress on adherent cells was used to evaluate shear induced gene expression Figure 2-3D [12]. Toh and others previously characterized this device operations and fabrication protocols, which were followed identically for this chapter. Figure 2-3B shows the perfusion setup with the closed loop perfusion network and peristaltic pump. Figure 2-3C shows the clamping procedure used to assemble a leak-proof device setup.
Following perfusions, microfluidic devices were disassembled from their clamped configuration and aligned to a vacuum-sealed membrane manifold. This manifold allowed for accessing of individual cell chambers for cell lysis buffer needed for subsequent RNA collection process. Procedure of disassembling the microfluidic device and assembling the vacuum-based network for cell lysate collection is shown in Figure 2-4.
For short term (1-2 hour) perfusions, a new device was designed and used for gene expression studies. These devices were casted from a designed mold, ordered from Fineline Inc. Each device consisted of 8 chambers (20 mm length x 2.5 mm width x 0.15 mm height). Wall shear stress and flow profiles were modelled according to previous work [12]. These chambers were four times larger in surface area than the device descibed above, allowing for larger cell numbers to be analyzed after perfusion. The device mold and individual chamber design are shown in Figure 2-5. After punching holes for inlets and outlets, the device was plasma bonded to a borosilicate glass slide (76.2 mm length x 25.4 mm width). Within half an hour of bonding and baking the device, ethanol (80% purity and 0.2 pm filtered) solution was manually added to all chambers for 5 minutes to sterilize the chambers and to wet the surfaces with an aqeous solution. This ethanol solution was rinsed with deionized water 5 times to remove any residue (ethanol, PDMS, or otherwise) potentially toxic to cell culture. A 0.1% aqeous gelatin solution was then introduced for 30 minutes to make the surface favorable for cell adhesion and proliferation. Subseuqently, regular cell culture media (0.2 im filtered) was manually introduced into each chamber to prime the device. The entire device, without any fluidic connections, was stored in a cell culture incubator for 16-24 hours to equilibrate the device with media constituents and cell culture environment.
On the day after device priming, cells of interest were brought to suspension at 5 x 10⁶ cells/mI
cells were strained to remove any large cell clusters. Inside a sterile environment, the media in each chamber was rinsed and replaced with 100 pL of fresh and pre-equilibrated cell culture media. Subsequently, 30 pL of cell suspension was manually dispensed into each chamber sequentially. With a chamber volume of 7.5 pL, approximately 37,500 cells were introduced into each chamber. This condition provided cells at 80-90% confluency the next day, prior to perfusion. Furthermore, this cell number accounted for any marignal error in cell attachment during seeding or perfusion processes. The device with cells was placed inside a sterile dish and then inside a sterile incubator for 24 hours.
On the day proceeding seeding, cells in each chamber were imaged using microscopy. For perfusion studies, each experiment consisted of running parallel perfusions at a given flow rate (divided into logarthmic flows according to external tubing diamter ratios) for a given duration. The static condition consisted of cells in culture dish experiencing no flow. Chambers experiencing flow were connected to 20-30 mL reservoirs of cell culture media. All chambers were connected by external closed loop fluidic connections and the entire device was placed in a cell culture incubator for the perfusion duration Figure 2-4B. The pump was used to first prime the tubing connections at the experimental flow rate through a device bypass in order to remove any potential bubbles in the systems and to ensure a leak-free connectivity. The bypass was then routed to the device to begin the perfusion.
Following perfusion, this device was disconnected from the perfusion setup and the cells were imaged again with microscopy. The cell media within each chamber was manually replaced with Trypsin (0.25% v/v with no EDTA) (at 370C) for 5-10 minutes. The suspended cells were collected, centrifuged and resuspended in lysis buffer prior to RNA extraction.
Seeding Perfusion Recovery D. Pe Pum13 rfusion Setup Device Incubator Fluidic Connections
L~IILJ
qRT-PCR cycle MPneumatic layer MicroscopeFigure 2-3 Perfusion experimental A: approach, B: setup, C: assembly and D: chip layout (unpublished figure from [12]).
Figure 2-4 Device disassembly procedure for collecting cell lysate (A) using PDMS vacuum network manifold (B) (unpublished figure from [12]). A. B. 20.0 mm 14... 1 2.50 mm
Figure 2-5 Mold for perfusion device of 8 microfluidic chambers (A), with individual dimensions (B).
A.
2.2.4. Quantitative RT-PCR
Cellular mRNA was extracted from the collected lysate using Qiagen RNeasy Micro kit (catalog #:74004) using its reccomended protocol. The collected mRNA quality and concentration was evaluated using NanoDrop 1000 Spectrophotometer. The amount of mRNA used for reversre transcription was taken as 1 pg from all sample conditions and convered to cDNA using random hexamer primers. Specifically, the PCR mixture composition and thermocycling protocol was taken from DyNAmo cDNA synthesis kit (Thermo Scientific, catalog # F-470L). The qPCR reaction setup utilized the Bio-Rad iQ SYBR Green Supermix (Bio Rad, catalog # 170-8882) The PCR reaction was conducted and analyzed with Bio Rad CFX96 Touchm Real-Time PCR Detection
System, according to its recommended protocol. Gene expression profiles were quantified and normalized as relative expression to GAPDH, using its standard curve.
PCR primers used for qRT-PCR are listed in the following page. These primers, spanning exon junctions, were designed using NCBI Primer-BLAST tool, to all have no non-specific products as
verified by NCBI BLAST results. Each primer length was kept around 20 base pairs, with product lengths (in this case, 100 base pairs). Likewise, the primer sets were checked for any primer-dimer possibilities, both in-silico, and with each experiment. The GC content was also kept comparable among primers (around 60%). Such considerations were taken in order to achieve similar priming and amplification efficiencies from each gene primer set.
PCR Primers
GeneBank Sequence Product Exon Start- Melting GC
Gene ID/Source Primer (5'-->3') Size junction Stop Temp %
Fwd AGGGCTCACTCC 1147- 63.5 66.7 p53 NM_001127233.1 AGCCTCCAG 113 1248- 1167 Rev AGGGGAGGGAT 1249 1259- 60.7 59.1 GAAGTGATGGG 1238 Fwd TGCTGGAGCCCG 262- 63.8 65 HSF1 NM_008296.2 AGTGGGAA 110 273- 281 Rev TGCCGCACGAAG 274 371- 62.2 60 CTAGCCAT 352 Fwd ATCCAGGGAGCA 1395- 63.7 61.9 PDGFB NM_011057.3 GCGAGCCAA 116 1411- 1415 Rev CCGCCTTGTCAT 1412 1510- 62.7 61.9 GGGTGTGCT 1490 Fwd CAGCCAGATGCA 155- 60.9 59.1 MCP-1 NM_011333 GTTAACGCCC 106 161- 176 Rev ACCTGCTGCTGG 162 260- 62.4 54.2 TGATCCTCTTGT 237 Fwd ACTCCGTAGGGG 334 63 63.6 PDGFA NM_008808 CTGAGGATGC 97 342- 355 Rev CGAATGGGCACA 343 430- 63.6 65 GGCCGCTT 411 Fwd GCGGGTGCAGG 257- 63.5 66.7 TF NM_010171 CATTCCAGAG 95 266- 277 Rev TAGTTGGTGGGT 267 351- 61.4 52.2 TTGGGTTGCCA 329 Fwd GGCTTACGCCAG 451- 62.5 65 c-Fos NM_010234.2 AGCGGGAA 90 532- 470 Rev GGAGATAGCTGC 533 540- 60.9 56 TCTACTTTGCCCC 516 Fwd GCACCTGACCAC 567- 59.8 54.2 EGR-1 NM_007913.5 AGAGTCCTTTTC 103 580- 590 Rev GGTGATGGGAG 581 669- 60.6 65 GCAACCGAG 650 Fwd CAGAACGGCTGC 346- 54.8 50
pTurbo pTurboRFP-C ATCATCTA 116366
RFP (Evrogen) Rev GGGTACAGCATC 461- 57.1 55
2.3. Results and Discussion 2.3.1. Serum pathway induction
The primary goal of serum induction was to mimic an immediate-early pathway in NIH3T3 cells, similar to what may be the case for fluid shear stress imparted pathway induction. It is seen from Figure 2-6 that these cells can indeed express immediate-early genes c-Fos and EGR-1 upon serum treatment of 30 minutes. Both transcripts are expressed at the highest level compared to any other gene or downstream targets, with sensitivity towards serum concentration. Observing this anticipated behavior suggested that an immediate-early serum-induced pathway could occur in NIH3T3 cells involving c-Fos and EGR-1. While serum induction may not necessarily be the true mechanism of shear induction in NIH3T3s, it shares similar pathway nodes and expression dynamics for both shear induced c-Fos and EGR-1, as described in literature [38-42].
It was further noticed that at 1 hour of induction, PDGFA, MCP1 and TF start to increase expression, with lowered expression of c-Fos and EGR-1. PDGFA and TF are downstream targets of EGR-1 and their shear induced expression is initiated after EGR-1 upregulation itself [45]. Similarly, MCP1 is a downstream target of shear induced AP-1 (consisting of c-Fos and c-Jun) that follows immediate high but transient expression of c-Fos [32]. Upon 2 hours of serum induction, there is more prominent serum concentration dependent expression of PDGFA, MCP1 and TF. EGR-1 and c-Fos levels return to basal levels for 3% serum concentration exposure and were comparable to each other for 10% and 20% concentrations at 2 hours. It was not clear why there was higher c-Fos and EGR-1 expression for the latter two serum dosages at 2 hours from 1 hour exposure. It is possible that other delayed regulatory pathways
may be involved to control the expression of c-Fos and EGR-1 at 2 hour time point.
Interestingly, other downstream targets of other shear inducible genes, as well as representative genes from DNA damage (p53) and heat shock pathway (HSF) were not stimulated by serum. PDGFB and ICAM1 are reported to be downstream targets of shear induced NF-KB transcription factor, which did not show serum sensitivity in this experiment. Shear induction mechanism of NF-KB has not been clearly elucidated in literature and it is
possible that its pathway may not be analogous to serum induced pathways or shear induced pathway of c-Fos and EGR-1.
Taken together, this experiment demonstrated ability of NIH3T3 to trigger an immediate-early induction pathway. In this case the cells show sensitivity to serum concentrations and durations of exposure. The induction dynamics and profiles are similar to that observed for shear induction; however no further studies were performed to definitely support this assertion for NIH3T3s. These results provided some confidence in using NIH3T3 cells as a model cell line to
sense an immediate-early pathway triggered by fluid shear stress that happens to be share similar profiles to a serum induced immediate-early pathway.
Serum Induction (30 min)
PDGFA PDGFB MCP1 EGR-1 cFos p53 HSF ICAM1 VCAM1 TF
Serum Induction (1h)
N 3% Serum * 10% Serum o 20% Serum PDGFA PDGFB i MCP1 EGR-1 r -rcFos p53 HSF ICAM1 VCAM1 TF
Serum Induction (2h)
A. 70 60 50 40 30 20 10 0 C .2. 0 I-0 N B. 12 -0 10 - U- *4-2 Z0-C.
30 0 25 20 .15 U-0 z 0PDGFA PDGFB MCP1 EGR-1 cFos p53 HSF ICAM1 VCAM1 TF
Figure 2-6 GAPDH normalized gene expression of serum induced cells at 30 min (A), 1 hour (B) and 2 hour (C) exposure duration. N = 2 experiments, error bar: standard error of mean.
2.3.2. Perfusions
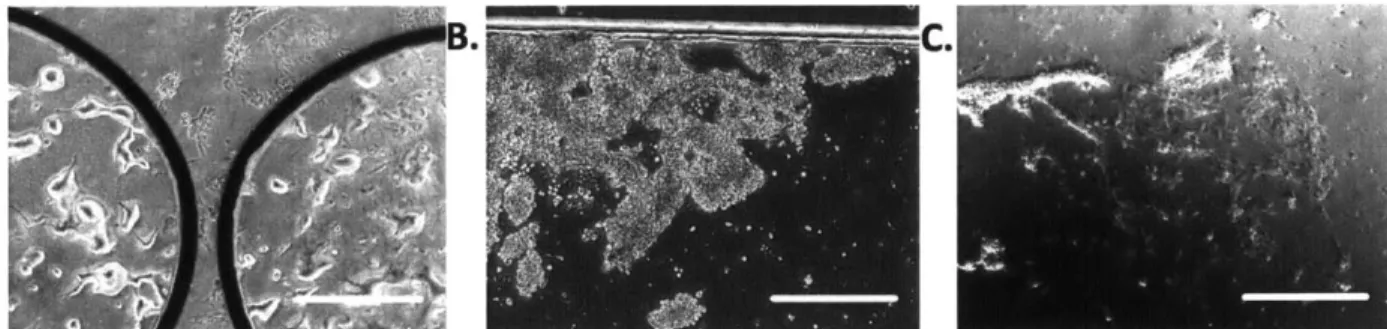
Cell morphology was used to qualitatively assess any potential gross physiological changes due to the cell seeding process within microfluidic devices. As desired, it was observed that cell morphology within the device was similar to that observed from cells cultured in a dish (Figure 2-7). Cell growth rate was indirectly inferred by qualitative assessment of cell confluence over two days of cell culture in a dish and in cell chambers. The observed cell growth rate (not quantified) within the device was however, slightly lower than that seen in the native environment. However, as growth rate is an indicator of cell health relevant for prolonged culturing, it was not within the scope of these perfusion studies to optimize such long term cell culture conditions within the device.
A. B.
Figure 2-7 comparison of cell morphology and proliferation in a cell culture dish (A) and in the device prior to shear exposure (B). Scale bar: 150 pm.
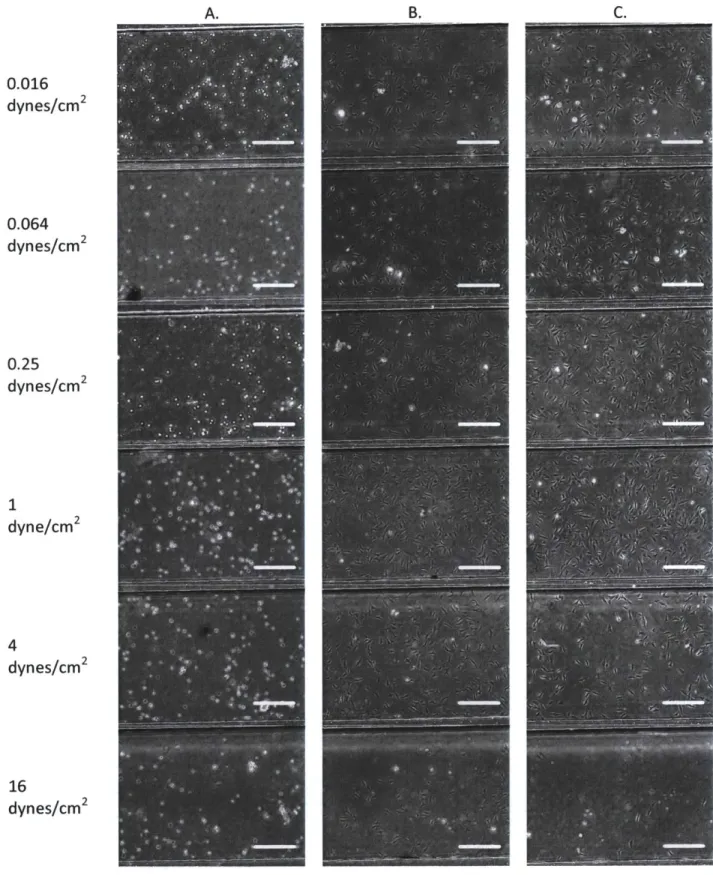
Cells in each chamber of the microfluidic device (Figure 2-3) were imaged using microscopy during the seeding process (Figure 2-8A). Adherent cells were imaged the following day (Figure 2-8B), where comparable cell confluence was observed, suggesting identical cell culture conditions among chambers of the device. These cells were also imaged immediately after applied shear stress, (Figure 2-8C) where it was observed that cells indeed maintained similar morphology and confluence before and after perfusion. In some experiments, there was cell loss observed for the highest shear conditions. This effect was compensated by a higher cell seeding density in order to have adequate cell number for gene expression analysis.
B, 0.016 dynes/cm2 0.064 dynes/cm2 0.25 dynes/cm2 1 dyne/cm2 4 dynes/cm2 16 dynes/cm2
Figure 2-8 Cell seeding process across shear condition chambers (A), resulting adherent cells after 24 hours (B) and the same immediately following perfusions (c). Scale bar: 150 pm.
C.