HAL Id: inserm-01304868
https://www.hal.inserm.fr/inserm-01304868
Submitted on 20 Apr 2016
HAL is a multi-disciplinary open access
archive for the deposit and dissemination of
sci-entific research documents, whether they are
pub-lished or not. The documents may come from
teaching and research institutions in France or
abroad, or from public or private research centers.
L’archive ouverte pluridisciplinaire HAL, est
destinée au dépôt et à la diffusion de documents
scientifiques de niveau recherche, publiés ou non,
émanant des établissements d’enseignement et de
recherche français ou étrangers, des laboratoires
publics ou privés.
Endothelial fibrinolytic response onto an evolving matrix
of fibrin
Omar Castillo, Hector Rojas, Zury Domínguez, Eduardo Anglés-Cano, Rita
Marchi
To cite this version:
Omar Castillo, Hector Rojas, Zury Domínguez, Eduardo Anglés-Cano, Rita Marchi. Endothelial
fibrinolytic response onto an evolving matrix of fibrin. BMC Hematology, BioMed Central, 2016, 16,
�10.1186/s12878-016-0048-6�. �inserm-01304868�
R E S E A R C H A R T I C L E
Open Access
Endothelial fibrinolytic response onto an
evolving matrix of fibrin
O. Castillo
1,2, H. Rojas
3,4, Z. Domínguez
5, E. Anglés-Cano
6,7and R. Marchi
1*Abstract
Background: Fibrin provides a temporary matrix at the site of vascular injury. The aims of the present work were (1) to follow fibrin formation and lysis onto the surface of human dermal microvascular endothelial cells (HMEC-1), and (2) to quantify the secretion of fibrinolytic components in the presence of fibrin.
Methods: Fibrin clots at different fibrinogen concentrations were formed on top of (model 1) or beneath (model 2) the endothelial cells. Fibrin formation or lysis onto the surface of HMEC-1 cells, was followed by turbidity. Clot structure was visualized by laser scanning confocal microscopy (LSCM). The secretion of uPA and PAI-1 by HMEC-1 cells was quantified by ELISA.
Results: The rate of fibrin formation increased approximately 1.5-fold at low fibrinogen content (0.5 and 1 mg/mL; p < 0.05) compared to the condition without cells; however, it was decreased at 2 mg/mL fibrinogen (p < 0.05) and no differences were found at higher fibrinogen concentrations (3 and 5 mg/mL). HMEC-1 retarded dissolution of clots formed onto their surface at 0.5 to 3 mg/mL fibrinogen (p < 0.05). Secretion of uPA was 13 × 10−6ng/mLper cell in the absence of RGD and 8 × 10⁻⁶ng/mLper cell in the presence of RGD, when clots were formed on the top of HMEC-1. However, the opposite was found when cells were grown over fibrin: 6 × 10⁻⁶ng/mLper cell without RGD vs. 17 × 10−6 ng/mLper cell with RGD. The secretion of PAI-1 by HMEC-1 cells was unrelated to the presence of fibrin or RGD, 7 × 10⁻⁶ μg/mL per cell and 5 × 10⁻⁶μg/mL per cell, for the apical (model 1) and basal clots (model 2), respectively.
Conclusions: HMEC-1 cells influence fibrin formation and dissolution as a function of the fibrin content of clots. Clot degradation was accentuated at high fibrin concentrations. The secretion of fibrinolytic components by HMEC-1 cells seemed to be modulated by integrins that bind RGD ligands.
Keywords: Fibrinogen, Fibrin, Fibrinolysis, Urokinase-type plasminogen activator, Plasminogen activator inhibitor type 1, Endothelium, Human dermal microvascular endothelial cells
Background
Fibrinogen is a 340 kDa plasma glycoprotein that circulates at approximately 2–4 mg/mL. The molecule is 45 nm long and comprises a symmetrical dimer consisting of two outer D domains and a central E domain, linked by α- helical coiled-coil rods. The fibrinogen molecule consists of two sets of three different polypeptide chains Aα, Bβ, and γ, joined by disulphide bonds at their N-termini E domain. The C-termini of the Bβ and γ chains are located in the D domain, while that of the Aα chains form a free non well-structured domain, theαC domain [1].
Fibrinogen does not polymerize spontaneously due to negative charges repulsion at the N-termini of the A α-and Bβ- chains. The removal by thrombin of short peptide sequences at Aα A1-R16 (fibrinopeptide A, FpA) and Bβ Q1-R14 (fibrinopeptide B, FpB) triggers the association between the fibrin monomers (fibrinogen molecules devoid of FpA and FpB) [1, 2]. The release of fibrino-peptides A and B exposes the polymerization sites “A” (knob A) and“B” (knob B), which associate to constitu-tive polymerization sites located at the C-termini end of theγ chains (“a” or hole a) and β (“b” or hole b). The association of fibrin monomers give rise to protofibrils that have two monomer units of width. The lateral ag-gregation of protofibrils forms the fibrin fibers. It seems
* Correspondence:rmarchi@ivic.gob.ve
1Centro de Medicina Experimental, Laboratorio Biología del Desarrollo de la
Hemostasia, Instituto Venezolano de Investigaciones Científicas, Caracas, República Bolivariana de Venezuela
Full list of author information is available at the end of the article
© 2016 Castillo et al. Open Access This article is distributed under the terms of the Creative Commons Attribution 4.0 International License (http://creativecommons.org/licenses/by/4.0/), which permits unrestricted use, distribution, and reproduction in any medium, provided you give appropriate credit to the original author(s) and the source, provide a link to the Creative Commons license, and indicate if changes were made. The Creative Commons Public Domain Dedication waiver (http://creativecommons.org/publicdomain/zero/1.0/) applies to the data made available in this article, unless otherwise stated.
that FpBs release contribute to the lateral aggregation of protofibrils [3–5].
Coagulation and fibrinolysis are activated simultan-eously in response to injury. The cross-linked fibrin is deposited in blood vessels and tissues, and plasmin is re-sponsible of the soluble fibrin degradation products [6]. Under physiological conditions, activators, inhibitors, and cofactors finely regulated fibrinolysis. Plasmin is formed from its precursor (plasminogen, Pg) by tissue type plasminogen activator (tPA) at the surface of fibrin [7]. Furthermore, endothelial cells are involved in fibrinolysis regulation by secreting substances, such as tPA and plasminogen activator inhibitor type 1 (PAI-1). Although tPA is a poor plasminogen activator in solution, at the surface of fibrin the reaction is amplified approximately two orders of magnitude [7, 8].
Fibrin network structure depends on the quality and amount of fibrinogen, on thrombin and calcium concen-trations, and on ionic strength, among others [9, 10]. The fibrin meshwork structure is characterized by fibrin thickness, fiber density, pores size, and rigidity that re-flects fibrin FXIIIa cross-linking and clot structure [11]. It has been found that clots from patients with throm-botic disorders were composed by thin fibers with increased fibrin density and rigidity, and decreased clot lysis rate [12–14]. Endothelial cells (ECs) interact with fibrin at the sites of vascular injury, thrombosis, inflam-mation and tumour growth, whereas they are quiescent when exposed to circulating fibrinogen [15]. The regulation of fibrinolysis by the endothelium has been widely studied [16–19]; however, the response of ECs to different fibrin structures has not been explored as yet. This knowledge can be relevant in thrombotic or bleeding mechanisms.
In the present work, fibrin clots of different structure were prepared at varying fibrinogen concentrations. Fibrin polymerization and fibrinolysis onto the HMEC-1 surface were followed by turbidity. Furthermore, fibrin association to ECs receptors was visualized by LSCM in the presence and absence of the synthetic disintegrin RGD.
Methods Materials
The MCDB 131 medium, foetal bovine serum, penicillin, streptomycin, fungizone, L-glutamine were purchased from GIBCO (Grand Island, NY, USA). Epidermal growth factor was from Invitrogen (Nalge Nunc International, Rochester, NY, USA). The 96 well microtiter plates and the 8 wells LabTek® Chamber Slide™ from Nalge Nunc International (Rochester, NY, USA). Lysine-sepharose was purchased from Health Care (Piscataway, NJ, USA). Bovine thrombin and RGD peptide were from Sigma (St Louis, MO. USA). The dyes di-8-anepps and Alexa 488 were from Molecular
Probes (Eugene, OR, USA). FluoSpheres size kit # 1 carb-oxylate modified microspheres red fluorescent was from Molecular Probes (Eugene, OR, USA). The uPA and PAI-1 ELISA kits were purchased from American Diagnostica (Greenwich, Connecticut, USA).
Endothelial cells culture
The human dermal microvascular endothelial cells (HMEC-1) were kindly donated by Dr. Edwin Ades, Department of Health and Human Services Centers for Disease Control and Prevention (CDC, Atlanta USA). The cells were cultivated with MCDB 131 medium supplemented with 10 % foetal bovine serum, penicillin 100 U/mL, streptomycin 100μg/mL, L-glutamine 200 mM, and epidermal growth factor 10 ng/mL. For polymerization and fibrinolysis experiments, cells were plated in 96 wells microtiter plates, and for confocal microscopy experiments in 8 wells LabTek® Chamber Slide™. Cells were cultivated at 37 °C in a humid atmosphere with 5 % CO2until ~80 % confluence. The optimal quantity of thrombin to be used in order to clot fibrinogen without affecting cell morphology and viability was standardized. After cells reached ~80 % confluence, 1 to 5 nM thrombin was incubated on the surface of the cells monolayer during 2 h. The cells’ morph-ology was observed with an optical microscope (unchanged at 1 nM; results not shown). Similarly, the number of cells to be seeded in the microplate wells and confocal micros-copy chambers were previously standardized in order to obtain 80 % confluence overnight.
Fibrinogen purification
Fibrinogen was purified from pooled human plasma obtained from healthy donors. The Ethics Committee of the Instituto Venezolano de Investígaciones Científicas (IVIC) approved the project, and all subjects signed an informed consent before blood withdrawal. Blood was collected in citrate (1 volume of 0.13 M trisodium citrate and 9 volumes of blood). Immediately centrifuged at 2500 × g during 20 min, at 4 °C. Fibrinogen was precipi-tated by salting out using β-alanine, essentially as de-scribed elsewhere [20]. The plasminogen was removed from fibrinogen preparation using a lysine-sepharose column, following the manufacturer’s instructions. The clottability of the purified fibrinogen was >90 %.
Fibrin polymerization and fibrinolysis on HMEC-1
The HMEC-1 cells (100,000 cells/well) were seeded on 96-well microtiter plate and cultivated overnight. The following day the medium was discarded and the fibrin meshwork was formed on top of the cells. Clots directly formed on the plastic surface of the microtiter plate served as controls. In an Eppendorf tube 143 μL of purified fibrinogen (0.5–5 mg/mL, final), 40 μL MCDB 131 non-supplemented medium and 17.5 μL of bovine
thrombin– CaCl2(1 nM and 2 mM, respectively, final) were mixed and immediately transferred on the top of the cells or directly on the plastic well surface. The optical density (OD) was read every 2 min during 100 min at 350 nm in an Infinite 200 M (Tecan, Vienna, Austria). For each curve it was calculated the slope (mOD/s)×100 and the maximum absorbance (MaxAbs, mOD). Experiments were run at least three times by tripli-cate. Fibrinolysis was triggered by the addition of 100 nM Pg and 0.145 nM tPA (previously standardized) to fibrino-gen solutions (0.5–3 mg/mL) before clotting with thrombin – CaCl2. The OD was recorded every minute until the OD reached baseline values. For each curve it was measured the time needed to decrease by 50 % the maximum absorb-ance (T50; s), the lysis rate, in the descending part of the curve (LR; mOD/s)×100; and the area under the curve (AUC; mOD × s). Experiments were run at least three times by duplicate.
At the end of each experiment the morphology of the cells was checked with an optical microscope.
Fibrin interaction with HMEC-1
Cells (120,000) were seeded in LabTek glass chamber slide and maintained at 37 °C in a humid atmosphere with 95 % air and 5 % CO2 and grown-up to 80 % confluence. The culture medium was removed and cells were labelled with 4 μM di-8-anepps for 15 min. The cells were then washed three times with phosphate buffered-saline (PBS). Fibrinogen (0.5, 2, and 5 mg/mL) mixed with 1 mM RGD (or the equivalent volume of buffer) and Alexa Fluor 488-labeled fibrinogen (19 μg/ 206 μL sample volume), was clotted with 1 nM throm-bin – 2 mM CaCl2 (final). The clotting mixture was immediately transferred over the cells or directly to the bottom of the glass chamber (control, without cells). Clot formation was allowed to progress for 2 h in a tis-sue culture incubator. Finally, the clot’s surface was cov-ered with supplemented medium without serum. Duplicates of each condition were performed at least in three independent experiments.
In order to discard that the interaction of fibrin with the cells was merely an adsorption phenomenon, 2 μm fluorescent microspheres were included in the reaction mixture before adding thrombin.
The clot structure on the surface of HMEC-1 was visu-alized using a Nikon Eclipse TE 2000-U laser microscope (with a 488 nm Argon or 543 nm HeNe laser). The object-ive used was Plan Apo VC 60X in water immersion with a work distance of 0.27. The acquisition pinhole was set to 60μm. For each clot several fields were examined at ran-dom before digital recording. Five areas of 212 × 212μm (x,y) were selected from each duplicate. A Z- stack was imaged from the bottom of the dish (0 μm) to different distances from the surface of the cells, with step sizes of
0.5 μm. The fibers diameter and density were measured from the volume render obtained with the Olympus FV10-ASW 2.1, and peak analysis from OriginPro 8.
Urokinase-type plasminogen activator (uPA) and plasminogen activator inhibitor 1 (PAI-1) secretion by HMEC-1 in the presence of fibrin
Fibrinogen was polimerized on the top of a HMEC-1 cul-ture (model 1) or the cells were grown on fibrin as substra-tum (model 2). In model 1, fibrin was formed on HMEC-1 cells (100,000) using different fibrinogen concentration (0.25, 0.5, 1, 1.5, 2, 3, and 5 mg/mL). Clots were allowed to form during 30 min in the incubator and 200 μL of medium without serum was then added. The supernatant was carefully collected after 12 h and stored at−80 °C until use. The following protocol was used with RGD: a cell monolayer was incubated during 3 h with 1 mM RGD pre-pared in supplemented MCDB 131 medium. The medium was then discarded and the cells washed with PBS. A fibrin reaction mixture with 1 mM RGD was added on the top of the cells. The basal condition consisted of the cell monolayer incubated during 12 h with supplemented MCDB 131 medium.
In order to cultivate the HMEC-1 on a fibrin layer (model 2), thin fibrin films of 30μL were formed on the bottom of the 96-well microplate, using the same clotting condition as model 1. After 30 min at 37 °C, 100,000 cells/ well supplemented or not with 1 mM RGD were seeded on the top of the fibrin and the plate left overnight in the incubator. The following day fresh medium without serum was added, and incubated for 12 h. The supernatant was collected and kept at−80 °C until use. Experiments were performed in triplicate and uPA and PAI-1 concentrations were measured in the cell supernatant by ELISA. The basal condition consisted of the cells monolayer incubated during 12 h with supplemented MCDB 131 medium.
The quantity of uPA and PAI-1 secreted was normalized to the number of cellsper well.
Statistical analysis
Statistical analysis was performed with OriginPro version 8.1. Descriptive statistics: mean, standard deviation (SD) or the standard error of the mean (SEM) were calculated. Normality was assessed by Shapiro-Wilk Test. Means were compared by one-way-ANOVA. A significance level of 0.05 was used.
Results
Fibrin polymerization and fibrinolysis on the top of HMEC-1
The slope and MaxAbs increase steadily from 0.5 to 5 mg/mL both when fibrin was formed on the top of HMEC monolayer or without cells (Table 1). Figure 1 shows the time course of fibrin formation at 3 different
fibrinogen concentrations (1, 3 and 5 mg/mL). The influence of fibrinogen concentration on the kinetics of fibrin polymerization is clearly evidenced. In the presence of cells MaxAbs was higher compared to the condition without cells. Fibrinolysis results are summa-rized in Table 2. The lysis rate (LR) was slightly but significantly decreased in the presence of cells at the fibrinogen concentrations tested (0.5 to 3 mg/mL). How-ever, the time needed for 50 % of clot lysis (T50%) was similar. In Fig. 2 are shown the time course of fibrinoly-sis at 1, 2, and 3 mg/mL fibrinogen.
Fibrin interaction with HMEC-1
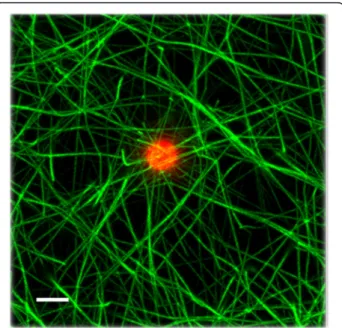
Fibrin network formed at three different fibrinogen concentrations (0.5, 2, and 5 mg/mL) on the top of HMEC-1 monolayers were digitized near the cell surface and at 15 μm, both in the presence and absence of 1 mM of the synthetic peptide RGD that competes with fibrinogen for integrin-ligand binding. In Fig. 3 it is clearly seen that at 0.5 and 2 mg/mL the fibrin fibers
interacted profoundly with the cell surface, the fibers looked radially stressed and the colocalization (in yellow) of the fibrin (green) with the cells membrane (red) is evidenced. However, at 5 mg/mL the interaction with the cell surface was rather decreased. This peculiar fibrin fibers distribution disappears with distance from the cell surface. At approximately 15 μm, the fibers looked uniformly distributed. When RGD was added to the fibrinogen solutions, the interaction between fibrin and cells decreased.
In order to rule out that the fibrin association to the cells was merely an adsorption phenomenon, fluorescent microspheres of 2 μm were incorporated into the clotting mixture. The fibrin fibers did not interact with the beads nor looked stressed, confirming that fibrin fibers are interacting with specific receptors on the cell membrane (Fig. 4).
The fibrin network was characterized by measuring fi-brin fiber diameter and fifi-brin density near the cell surface and at 15μm (Table 3). Fibrin fibers were thicker near the cell surface compared to that observed at 15μm at all fi-brinogen concentrations tested without RGD. In contrast, in the presence of RGD there was not such relationship. Apparently, only at 5 mg/mL the fibrin fibers diameter did not change. Fibrin density was greater near the cell surface both in the presence or absence of RGD, except at 0.5 mg/mL in the presence of RGD (p > 0.05).
Changes in fluorescence intensity as a function of the distance from the cell surface at 2 mg/mL of fibrinogen is shown in Fig. 5.
HMEC-1 secretion of uPA and PAI-1 in the presence of fibrin
The basal secretion of uPA was 7.0 ± 0.5×10⁻⁶ ng/mL per cell and that of PAI-1 6.7 ± 0.5×10⁻⁶μg/mL per cell. Since the secretion of uPA and PAI-1 was almost similar at the different fibrinogen concentrations tested in the presence or not of RGD, these values were averaged and reported in Table 4. In model 1, when fibrin was formed on the top of the cells monolayer, uPA secretion in the absence of RGD was ~2-fold higher than in its presence (p < 0.05). However, the opposite was found for model 2.
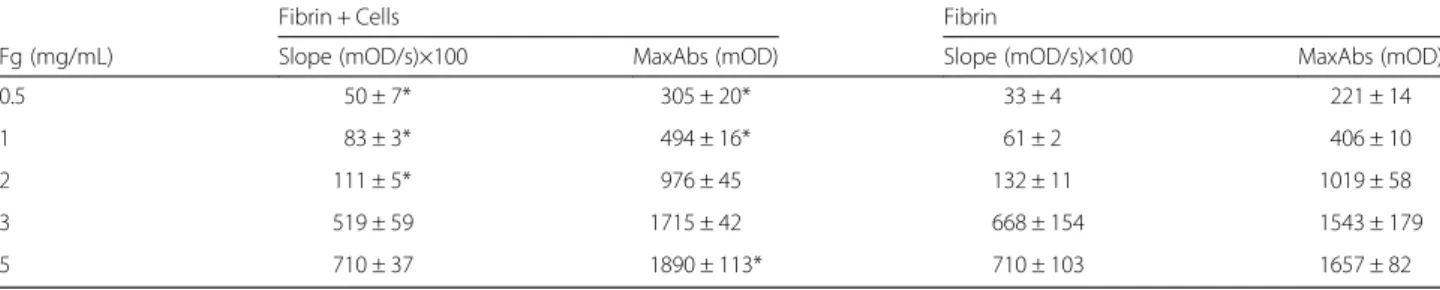
Table 1 Summary of the kinetics of fibrin polymerization on the top of HMEC-1 at different fibrinogen concentrations
Fibrin + Cells Fibrin
Fg (mg/mL) Slope (mOD/s)×100 MaxAbs (mOD) Slope (mOD/s)×100 MaxAbs (mOD) 0.5 50 ± 7* 305 ± 20* 33 ± 4 221 ± 14 1 83 ± 3* 494 ± 16* 61 ± 2 406 ± 10 2 111 ± 5* 976 ± 45 132 ± 11 1019 ± 58 3 519 ± 59 1715 ± 42 668 ± 154 1543 ± 179 5 710 ± 37 1890 ± 113* 710 ± 103 1657 ± 82
Results are expressed as the mean (± SD) Fg fibrinogen, MaxAbs maximum absorbance
*p < 0.05 Comparison between fibrin polymerization parameters of clots formed on the top of the cells with those performed in its absence
Fig. 1 Fibrin polymerization on the top of HMEC-1 at different fibrinogen concentrations. Filled symbols represent the condition of fibrin formed on the top of the cells and empty symbols clots formed directly on the plastic dish. (■, □): 1 mg/mL, (▲, △): 3 mg/mL and (★, ☆): 5 mg/mL
When cells were grown on the top of the fibrin network the secretion of uPA in the absence of RGD was decreased 2-fold (p < 0.05). The secretion of PAI-1 in model 1 was 1.3-fold higher compared to model 2 (p < 0.05). The PAI-1 concentration in the presence of fibrin was comprised in the 95 % CI of HMEC-1 basal secretion.
Discussion
The aims of the present work were (1) to study fibrin formation and lysis onto the surface of HMEC-1 cells, and (2) to quantify uPA and PAI-1 secretion in the pres-ence of fibrin. We also analyzed the fibrin meshwork formed on the top of HMEC-1 cells by laser scanning confocal microscopy. The structure of fibrin was modu-lated by modifying the concentration of fibrinogen.
Fibrin is pro inflammatory, pro-angiogenic and may contribute to the development of inflammatory disease processes and tumorigenesis [21–23]. Atherogenesis is a multifactorial process and the atherosclerotic lesions may be initiated by the interaction of fibrin with the endothelium [24]. In normal physiologic conditions, the endothelium displays antiplatelet, anticoagulant and fibrinolytic properties [25].
In order to measure the secretion of fibrinolytic components from HMEC-1 we have used an adhesion model, where HMEC-1 cells were seeded directly on the plastic surface and after reaching 80 % of confluence fibrin was formed on their top (model 1) or cells were grown on a fibrin film (model 2).
The type of plasminogen activator secreted by HMEC-1 has been differently reported in the literature [26–28]. However, a majority of reports [29–31], including those from the group of Angles-Cano [26, 32, 33], have clearly demonstrated, using methods that identify either the mo-lecular mass (Western blot) or the activity of the momo-lecular mass (fibrin or casein zymography) that only uPA (54 kDa) is detected in culture media or lysates from HMEC-1. We have verified that the HMEC-1 line used in these studies secretes uPA (lysis band at 54 kDa by zymography).
Similar to what has been found for other ECs cultured in vitro, HMEC-1 basal PAI-1 secretion was higher than uPA, approximately 1000-fold [34–36]. In model 1, with-out RGD, the amount of uPA secreted to the medium was 2-fold higher compared to the basal secretion and to model 2. This difference was attributed to the avail-ability of thrombin. In model 1, at the beginning of fibrin formation, thrombin is in solution and directly in contact with the cells, while in model 2 fibrin was already gelled, and less thrombin was accessible to the cells. The response of the ECs to thrombin depends on their origin, in human umbilical vein endothelial cells (HUVEC) the quantity of tPA and PAI-1 is dose-dependent on thrombin concentration, but not in human omental tissue microvascular endothelial cells (HOTMC) [35].
During fibrin formation from 0.5, 1, and 5 mg/mL fibrinogen the OD increased faster in the presence of HMEC-1 than without it (p < 0.05). Tietze et al. found similar results with human mesothelial cells (HOMC) but at constant fibrinogen concentration [34]. This “catalytic” cell effect at low fibrinogen concentration may be an advantage for patients with hypofibrinogenemia, which could contribute to stop faster blood extravasation. The rate of fibrin degradation in the presence of HMEC-1 was significantly decreased at all fibrin concentration (0.5 to 3 mg/mL), reaching a maximum value at 3 mg/mL (2-fold less). These results were attributed to several factors. The
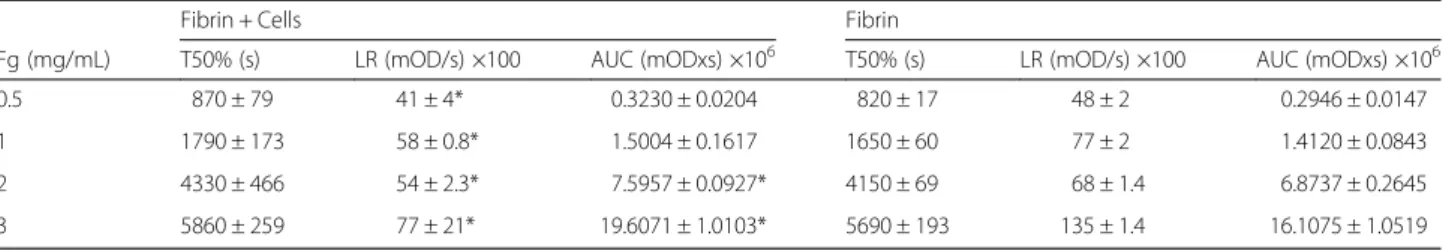
Table 2 Summary of the fibrin degradation on the top of HMEC-1
Fibrin + Cells Fibrin
Fg (mg/mL) T50% (s) LR (mOD/s) ×100 AUC (mODxs) ×106 T50% (s) LR (mOD/s) ×100 AUC (mODxs) ×106 0.5 870 ± 79 41 ± 4* 0.3230 ± 0.0204 820 ± 17 48 ± 2 0.2946 ± 0.0147 1 1790 ± 173 58 ± 0.8* 1.5004 ± 0.1617 1650 ± 60 77 ± 2 1.4120 ± 0.0843 2 4330 ± 466 54 ± 2.3* 7.5957 ± 0.0927* 4150 ± 69 68 ± 1.4 6.8737 ± 0.2645 3 5860 ± 259 77 ± 21* 19.6071 ± 1.0103* 5690 ± 193 135 ± 1.4 16.1075 ± 1.0519
Results are expressed as the mean (± SD)
Fg fibrinogen, T50% time required to decrease the MaxAbs 50 %, LR lysis rate, AUC area under the curve
*p < 0.05 Comparison between fibrin degradation parameters of clots formed on the top of the cells with those performed in its absence
Fig. 2 Fibrin degradation on the top of HMEC-1 at different fibrinogen concentrations followed by turbidity. (■, □): 1 mg/mL, (▲, △): 2 mg/ mL and (★, ☆): 3 mg/mL. Filled symbols: fibrin formed on the top of the cells; empty symbols: clots formed directly on the plastic dish
presence of PAI-1 (basal secretion ~ 6.7×10⁻⁶ μg/mL per cell) could decrease both the functional availability of uPA and tPA (externally added tPA), although the tPA bound to fibrin is less susceptible to PAI-1 inactivation [7, 37]. The peculiar fibrin structure observed near the cell surface could impair clot dissolution. In general, fibrin network with increased fibers density are digested slower [38]. However, opposite results were found with HOMC, where the T50% was decreased in the presence of cells [34]. The results reported by these authors were intriguing, since clots formed without cells were totally degraded earlier than those in the presence of cells.
It was previously found that fibrin fibers forms clumps near the surface of HUVEC culture; however, at 50μm this pattern disappear and they distributed homogeneously [39]. The integrin involved in this interaction was theαvβ3[39]. This integrin binds the ligand at specific RGD sequences of different adhesive proteins such as fibronectin, vitronectin, fibrinogen, among others [40]. In the present work the fibrin network structure formed at different fibrinogen con-centrations was analyzed by LSCM. As expected, increasing the fibrinogen concentration increases the fibrin density [41], and the fibers associated to the cell surface looked
Fig. 3 Laser scanning confocal microscopy images of clots formed on the top of HMEC-1 at different fibrinogen concentrations. The fibrin fibers were visualized with Alexa 488 and the cell membrane with di-8-anepps. The pictures show the fibrin fibers arrangements of clots supplemented or not with 1 mM RGD near the cell surface at 0.5, 2 and 5 mg/mL fibrinogen, and at 15μm away. The tool bar represents 20μm
Fig. 4 Fibrin network formed with fluorescent microspheres. A field with only one bead was magnified in order to appreciate that these particles did not interact with fibers. The tool bar represents 2μm Castillo et al. BMC Hematology (2016) 16:9 Page 6 of 9
stressed (Fig. 3), as has already been observed in other works at a given fibrinogen concentration [39, 42, 43]. Interestingly, at high fibrinogen concentration (5 mg/mL) the interaction of fibrin with the cells was decreased. Indeed, at increasing fibrin content, the number of protofibrilsper fiber are greater [44], probably diminishing the accessibility of the RGD sites on the fibrin fibers (Aα 572–575) to integrins [40, 45].
The changes in fibrin fiber diameter at varying fibrino-gen concentrations were not clearly appreciated by LSCM in spite of the low thrombin concentration used. This is probably due to the lower resolution limit of LSCM (~200–400 nm).
Conclusions
We demonstrated that HMEC-1 influenced fibrin forma-tion as a funcforma-tion of the fibrinogen input. However, the rate of fibrin degradation in the presence of HMEC-1 was significantly decreased at all fibrin concentrations. Impairment of fibrin binding to its cell receptor by RGD influenced the secretion of fibrinolytic components thus suggesting a role for fibrin binding in this mechanism. The next step would be to investigate the signalling pathway involved in theαvβ3integrin activation, probably coupled to thrombin. A limitation of our study is that the results were obtained using HMEC-1 cells and may therefore be pertinent only to this cell line.
Abbreviations
ECs:endothelial cells; ELISA: enzyme-linked immunosorbent assay; Fg: fibrinogen; FXIIIa: activated factor XIII; HMEC: human dermal microvascular endothelial cells; HOMC: human mesothelial cells; HOTMC: human omental tissue microvascular endothelial cells; HUVEC: human umbilical vein endothelial cell; LR: lysis rate; LSCM: laser scanning confocal microscopy; MaxAbs: maximum absorbance; OD: optical density; PAI-1: plasminogen activator inhibitor type 1; PBS: phosphate buffered-saline; Pg: plasminogen; RGD: arginyl glycyl aspartic acid; SEM: standard error of the mean; tPA: tissue type plasminogen activator; uPA: urokinase-type plasminogen activator.
Table 3 Characterization of fibrin networks formed on the surface of HMEC-1 culture by laser scanning confocal microscopy (LSCM)
Fibers diameter (μm)
Fg (mg/mL) - RGD Near - RGD Far + RGD Near + RGD Far 0.5 2.02 ± 0.05* 1.65 ± 0.05 1.49 ± 0.09* 1.72 ± 0.07 2 1.98 ± 0.12* 1.76 ± 0.12 1.99 ± 0.06* 1.62 ± 0.07 5 2.03 ± 0.65* 1.52 ± 0.33 2.00 ± 0.10 1.95 ± 0.33 Fibrin density (peaks/μm)
Fg (mg/mL) - RGD Near - RGD Far + RGD Near + RGD Far 0.5 0.192 ± 0.052* 0.099 ± 0.045 0.205 ± 0.051 0.160 ± 0.054 2 0.299 ± 0.029* 0.135 ± 0.035 0.270 ± 0.023* 0.152 ± 0.030 5 0.254 ± 0.030* 0.141 ± 0.057 0.282 ± 0.022* 0.138 ± 0.056
Fibrin fibers diameter and density were quantified from LSCM images Values are expressed as mean (± SEM) of 3 experiments performed in duplicate *p < 0.05. Comparisons are between near the cells surface vs. far, without (−) and with (+) RGD
Fig. 5 Representation of the changes of the mean fluorescence intensity according to the distance from the bottom of the dish up to 40μm. a Without and with RGD at 2 mg/mL fibrinogen. b Without cells at 0.5, 2 and 5 mg/mL fibrinogen
Table 4 HMEC-1 cells secrete urokinase-type plasminogen activator and plasminogen activator inhibitor type 1
μg/mL per cell Model 1 Model 2 uPA×10−9(−RGD) 12.7*,**(11.2–14.1) 6.2*(5.0–7.4)
uPA×10−9(+RGD) 7.5**(5.9–9.1) 17.3 (15.0–19.6)
PAI-1×10⁻⁶(−RGD) 7.87**(6.65–9.10) 5.97 (4.50–7.44)
PAI-1×10⁻⁶(+RGD) 7.38**(6.54–8.23) 5.08 (3.01–7.16)
Urokinase and PAI-1 were quantified by ELISA in HMEC conditioned-medium obtained in the presence of fibrin. Fibrin was formed on the top of the cells monolayer (model 1) or cells were seeded on the top of fibrin film (model 2). The basal secretion of uPA was 7.0 ± 0.5 × 10⁻⁹μg/mL per cell, and that of PAI-1 6.7 ± 0.5 × 10⁻⁶μg/mL per cell. The quantity of uPA and PAI-1 secreted was normalized to the number of cells. Results are expressed as the mean and the 95 % confidence interval (CI) in brackets
*p < 0.05 uPA secretion without RGD (−RGD) compared to that with RGD (+RGD) for model 1
**p < 0.05 uPA secretion without RGD of model 1 compared to that of model 2, and with RGD in model 1 compared to that in model 2
Competing interests
The authors declare that they have no competing interests. Authors’ contributions
CO has performed the experiments, standardization of most of the techniques, and contributed to experiments design and data discussion. RH handled the LSCM, and quantified and analyzed LSCM images. DZ participated in cells culture. A-CE participated in the fibrinolysis experiments and interpretation of data, and manuscript writing. MR: designed the project, participated in data analysis and wrote the manuscript. All authors have read and approved the final manuscript.
Acknowledgements
The authors are grateful to Drs. Peter Taylor and Reinaldo Di Polo of IVIC (Caracas, República Bolivariana de Venezuela), for cell culture and confocal microscopy facility, respectively. The human microvascular endothelial cells (HMEC-1) were kindly donated by Dr. Edwin Ades and Mr. Francisco J. Candal of the Centers for Disease Control and Prevention (CDC) (Atlanta, GA, USA) and Dr. Thomas Lawley of Emory University (Atlanta, GA, USA). Dr. Eduardo Anglés-Cano is supported by Inserm.
This work was partially financed by Oficina de Planificación del Sector Universitario (OPSU).
Author details
1Centro de Medicina Experimental, Laboratorio Biología del Desarrollo de la
Hemostasia, Instituto Venezolano de Investigaciones Científicas, Caracas, República Bolivariana de Venezuela.2Universidad de Carabobo, Escuela de
Bioanálisis (Sede Aragua), Maracay, República Bolivariana de Venezuela.
3Instituto de Inmunología, Universidad Central de Venezuela, Caracas,
República Bolivariana de Venezuela.4Laboratorio de Fisiología Celular, Centro de Biofísica y Bioquímica, Instituto Venezolano de Investigaciones Científicas, Caracas, República Bolivariana de Venezuela.5Instituto de Medicina
Experimental, Universidad Central de Venezuela, Caracas, República Bolivariana de Venezuela.6Inserm UMR_S 1140, Faculté de Pharmacie, Paris, France.7Université Paris Descartes, Sorbonne Paris Cité, Paris, France.
Received: 31 October 2015 Accepted: 7 April 2016
References
1. Weisel JW. Fibrinogen and fibrin. Adv Protein Chem. 2005;70:247–99. 2. Blomback B, Hessel B, Hogg D, Therkildsen L. A two-step fibrinogen–fibrin
transition in blood coagulation. Nature. 1978;275:501–5.
3. Weisel JW, Veklich Y, Gorkun O. The sequence of cleavage of fibrinopeptides from fibrinogen is important for protofibril formation and enhancement of lateral aggregation in fibrin clots. J Mol Biol. 1993;232:285–97.
4. Medved L, Weisel JW. Recommendations for nomenclature on fibrinogen and fibrin. J Thromb Haemost. 2009;7:355–9.
5. Okumura N, Terasawa F, Haneishi A, Fujihara N, Hirota-Kawadobora M, Yamauchi K, et al. B:b interactions are essential for polymerization of variant fibrinogens with impaired holes‘a’. J Thromb Haemost. 2007;5:2352–9. 6. Cesarman-Maus G, Hajjar KA. Molecular mechanisms of fibrinolysis.
Br J Haematol. 2005;129:307–21.
7. Hoylaerts M, Rijken DC, Lijnen HR, Collen D. Kinetics of the activation of plasminogen by human tissue plasminogen activator. Role of fibrin. J Biol Chem. 1982;257:2912–9.
8. Diamond SL, Eskin SG, McIntire LV. Fluid flow stimulates tissue plasminogen activator secretion by cultured human endothelial cells. Science. 1989;243:1483–5.
9. Blomback B, Banerjee D, Carlsson K, Hamsten A, Hessel B, Procyk R, et al. Native fibrin gel networks and factors influencing their formation in health and disease. Adv Exp Med Biol. 1990;281:1–23.
10. Wolberg AS, Monroe DM, Roberts HR, Hoffman M. Elevated prothrombin results in clots with an altered fiber structure: a possible mechanism of the increased thrombotic risk. Blood. 2003;101:3008–13.
11. Ryan EA, Mockros LF, Weisel JW, Lorand L. Structural origins of fibrin clot rheology. Biophys J. 1999;77:2813–26.
12. Mills JD, Ariens RA, Mansfield MW, Grant PJ. Altered fibrin clot structure in the healthy relatives of patients with premature coronary artery disease. Circulation. 2002;106:1938–42.
13. Collet JP, Allali Y, Lesty C, Tanguy ML, Silvain J, Ankri A, et al. Altered fibrin architecture is associated with hypofibrinolysis and premature coronary atherothrombosis. Arterioscler Thromb Vasc Biol. 2006;26:2567–73. 14. Undas A, Kaczmarek P, Sladek K, Stepien E, Skucha W, Rzeszutko M, et al.
Fibrin clot properties are altered in patients with chronic obstructive pulmonary disease. Beneficial effects of simvastatin treatment. Thromb Haemost. 2009;102:1176–82.
15. Francis CW, Bunce LA, Sporn LA. Endothelial cell responses to fibrin mediated by FPB cleavage and the amino terminus of the beta chain. Blood Cells. 1993;19:291–306.
16. Michiels C. Endothelial cell functions. J Cell Physiol. 2003;196:430–43. 17. Libby P, Aikawa M, Jain MK. Vascular endothelium and atherosclerosis.
Handb Exp Pharmacol. 2006;176(Pt 2):285–306.
18. van Hinsbergh VW. Endothelium–role in regulation of coagulation and inflammation. Semin Immunopathol. 2012;34:93–106.
19. Suzuki Y, Yasui H, Brzoska T, Mogami H, Urano T. Surface-retained tPA is essential for effective fibrinolysis on vascular endothelial cells. Blood. 2011;118:3182–5.
20. Jakobsen E, Kierulf P. A modified beta-alanine precipitation procedure to preparefibrinogen free of antithrombin-III and plasminogen. Thromb Res. 1973;3:145–59.
21. Tang L, Eaton JW. Fibrin(ogen) mediates acute inflammatory responses to biomaterials. J Exp Med. 1993;178:2147–56.
22. Varisco PA, Peclat V, van Ness K, Bischof-Delaloye A, So A, Busso N. Effect of thrombin inhibition on synovial inflammation in antigen induced arthritis. Ann Rheum Dis. 2000;59:781–7.
23. van Hinsbergh VW, Engelse MA, Quax PH. Pericellular proteases in angiogenesis and vasculogenesis. Arterioscler Thromb Vasc Biol. 2006;26:716–28.
24. Zacharowski K, Zacharowski P, Reingruber S, Petzelbauer P. Fibrin(ogen) and its fragments in the pathophysiology and treatment of myocardial infarction. J Mol Med (Berl). 2006;84(6):469–77.
25. De Caterina R, Massaro M, Libby P. Endothelial functions and dysfunctions. In: De Caterina R, Libby P, editors. Endothelial dysfunctions and vascular disease. Oxford, UK: Blackwell Futura; 2007. p. 3–25.
26. Lacroix R, Sabatier F, Mialhe A, Basire A, Pannell R, Borghi H, et al. Activation of plasminogen into plasmin at the surface of endothelial microparticles: a mechanism that modulates angiogenic properties of endothelial progenitor cells in vitro. Blood. 2007;110:2432–9.
27. Fiuza C, Bustin M, Talwar S, Tropea M, Gerstenberger E, Shelhamer JH, et al. Inflammation-promoting activity of HMGB1 on human microvascular endothelial cells. Blood. 2003;101:2652–60.
28. Jiang SJ, Lin TM, Wu HL, Han HS, Shi GY. Decrease of fibrinolytic activity in human endothelial cells by arsenite. Thromb Res. 2002;105:55–62. 29. Michaud-Levesque J, Rolland Y, Demeule M, Bertrand Y, Beliveau R.
Inhibition of endothelial cell movement and tubulogenesis by human recombinant soluble melanotransferrin: involvement of the u-PAR/LRP plasminolytic system. Biochim Biophys Acta. 2005;1743:243–53.
30. Quemener C, Gabison EE, Naimi B, Lescaille G, Bougatef F, Podgorniak MP, et al. Extracellular matrix metalloproteinase inducer up-regulates the urokinase-type plasminogen activator system promoting tumor cell invasion. Cancer Res. 2007;67:9–15.
31. Senchenko VN, Anedchenko EA, Kondratieva TT, Krasnov GS, Dmitriev AA, Zabarovska VI, et al. Simultaneous down-regulation of tumor suppressor genes RBSP3/CTDSPL, NPRL2/G21 and RASSF1A in primary non-small cell lung cancer. BMC Cancer. 2010;10:75.
32. Doeuvre L, Plawinski L, Goux D, Vivien D, Angles-Cano E. Plasmin on adherent cells: from microvesiculation to apoptosis. Biochem J. 2010;432:365–73. 33. Lacroix R, Plawinski L, Robert S, Doeuvre L, Sabatier F, Martinez De
Lizarrondo S, et al. Leukocyte- and endothelial-derived microparticles: a circulating source for fibrinolysis. Haematologica. 2012;97:1864–72. 34. Tietze L, Elbrecht A, Schauerte C, Klosterhalfen B, Amo-Takyi B, Gehlen J,
et al. Modulation of pro- and antifibrinolytic properties of human peritoneal mesothelial cells by transforming growth factor beta1 (TGF-beta1), tumor necrosis factor alpha (TNF-alpha) and interleukin 1beta (IL-1beta). Thromb Haemost. 1998;79:362–70.
35. Speiser W, Anders E, Binder BR, Muller-Berghaus G. Clot lysis mediated by cultured human microvascular endothelial cells. Thromb Haemost. 1988;60:463–7.
36. Van Hinsbergh VW, Sprengers ED, Kooistra T. Effect of thrombin on the production of plasminogen activators and PA inhibitor-1 by human foreskin microvascular endothelial cells. Thromb Haemost. 1987;57:148–53. Castillo et al. BMC Hematology (2016) 16:9 Page 8 of 9
37. Wun TC, Capuano A. Initiation and regulation of fibrinolysis in human plasma at the plasminogen activator level. Blood. 1987;69:1354–62. 38. Weisel JW, Litvinov RI. The biochemical and physical process of fibrinolysis
and effects of clot structure and stability on the lysis rate. Cardiovasc Hematol Agents Med Chem. 2008;6:161–80.
39. Jerome WG, Handt S, Hantgan RR. Endothelial cells organize fibrin clots into structures that are more resistant to lysis. Microsc Microanal. 2005;11:268–77. 40. Cheresh DA, Berliner SA, Vicente V, Ruggeri ZM. Recognition of distinct
adhesive sites on fibrinogen by related integrins on platelets and endothelial cells. Cell. 1989;58:945–53.
41. Blomback B, Carlsson K, Hessel B, Liljeborg A, Procyk R, Aslund N. Native fibrin gel networks observed by 3D microscopy, permeation and turbidity. Biochim Biophys Acta. 1989;997:96–110.
42. Marchi R, Rojas H, Castillo O, Kanzler D. Structure of fibrin network of two abnormal fibrinogens with mutations in the alphaC domain on the human dermal microvascular endothelial cells 1. Blood Coagul Fibrinolysis. 2011;22:706–11.
43. Campbell RA, Overmyer KA, Selzman CH, Sheridan BC, Wolberg AS. Contributions of extravascular and intravascular cells to fibrin network formation, structure, and stability. Blood. 2009;114:4886–96. 44. Weisel JW, Nagaswami C. Computer modeling of fibrin polymerization
kinetics correlated with electron microscope and turbidity observations: clot structure and assembly are kinetically controlled. Biophys J. 1992;63:111–28. 45. Suehiro K, Mizuguchi J, Nishiyama K, Iwanaga S, Farrell DH, Ohtaki S.
Fibrinogen binds to integrin alpha(5)beta(1) via the carboxyl-terminal RGD site of the Aalpha-chain. J Biochem. 2000;128:705–10.
• We accept pre-submission inquiries
• Our selector tool helps you to find the most relevant journal
• We provide round the clock customer support
• Convenient online submission
• Thorough peer review
• Inclusion in PubMed and all major indexing services
• Maximum visibility for your research Submit your manuscript at
www.biomedcentral.com/submit